

Briefly: In our opinion, short (full) speculative positions in gold, silver and mining stocks are justified from the risk/reward point of view.
Gold moved to the previous 2015 low and reversed on relatively strong volume, which seems to be very bullish, but at the same time gold closed below the previous low (in terms of closing prices), so we saw a breakdown, which seems to be very bearish. What’s the real outlook?
Before we provide the answer to the above question, let’s take a closer look at the charts (charts courtesy of http://stockcharts.com).
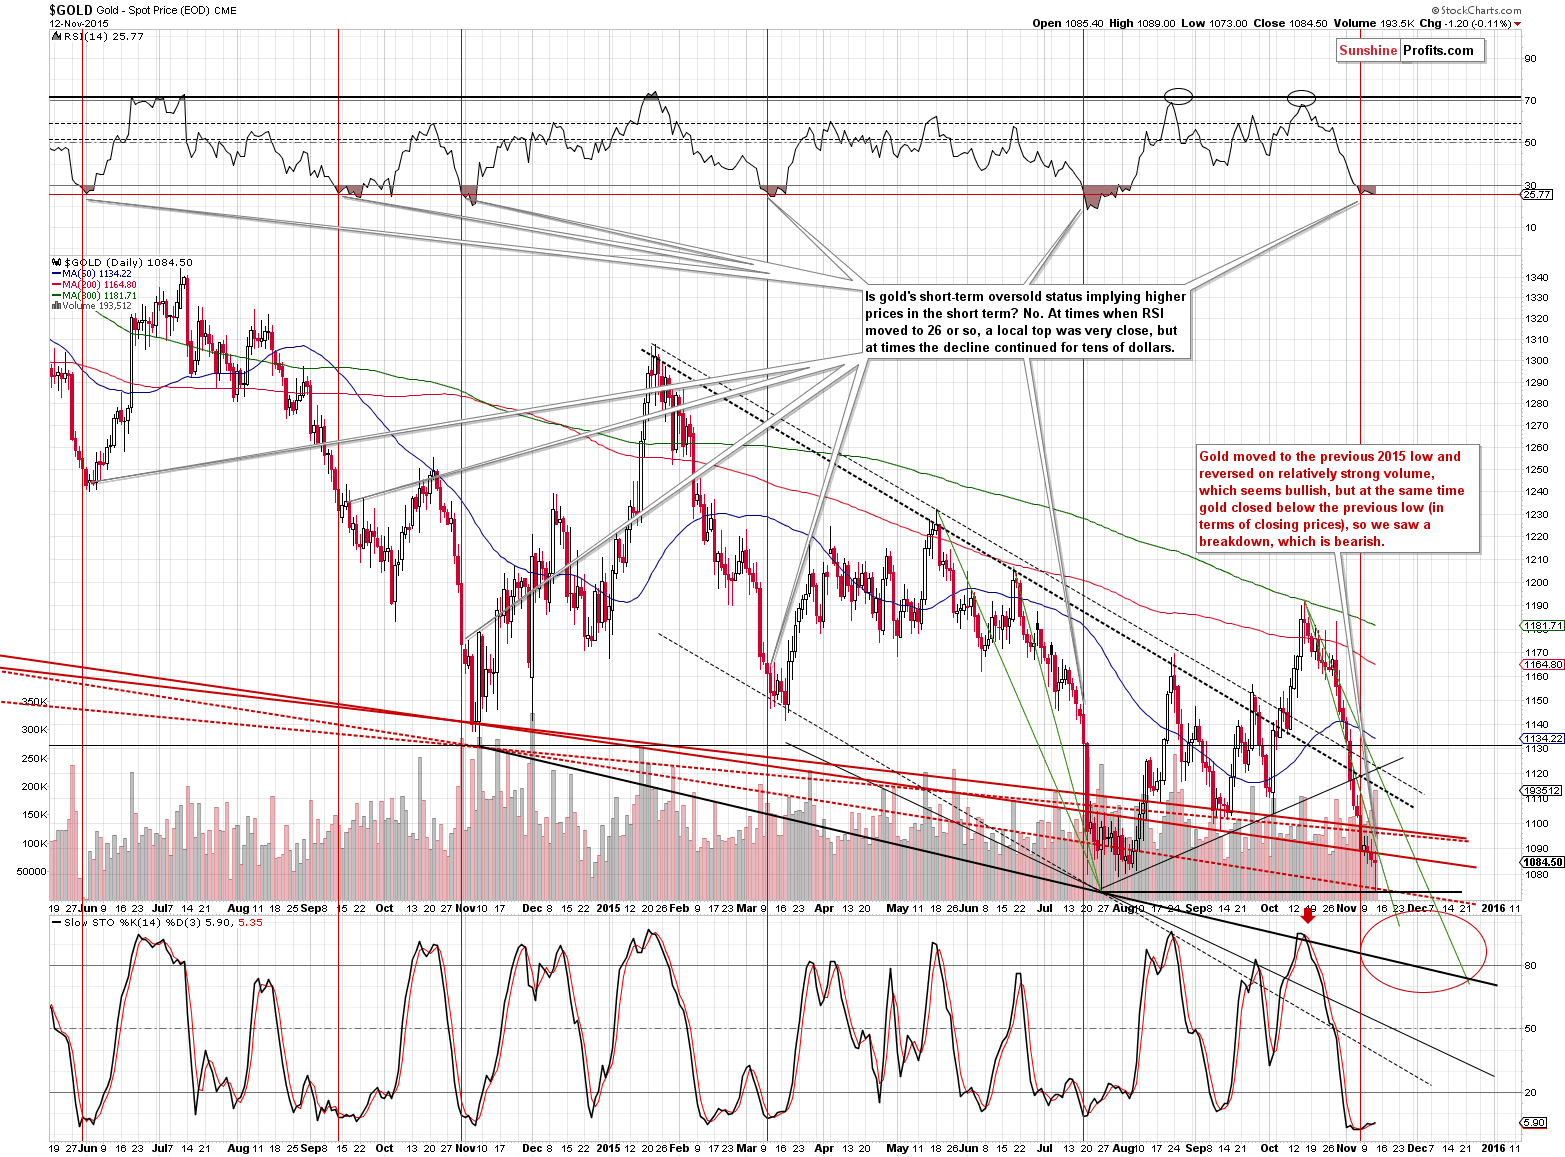
As we wrote in the introduction, the situation in the gold market is critical – we could be either on a verge of a breakdown or we could see a turnaround shortly. The above chart doesn’t really say which scenario is more probable. It shows that yesterday’s session was really important because the volume was significant.
The RSI and Stochastic indicators don’t say much either – they are indicating oversold levels on a short-term basis, but that’s something that can be seen before medium-term breakdowns. Since we can see these signs both before short-term rallies and before medium-term breakdowns, these signals don’t tell us much at this time. The buy signals from the daily version of the Stochastic indicator have not been particularly reliable anyway.
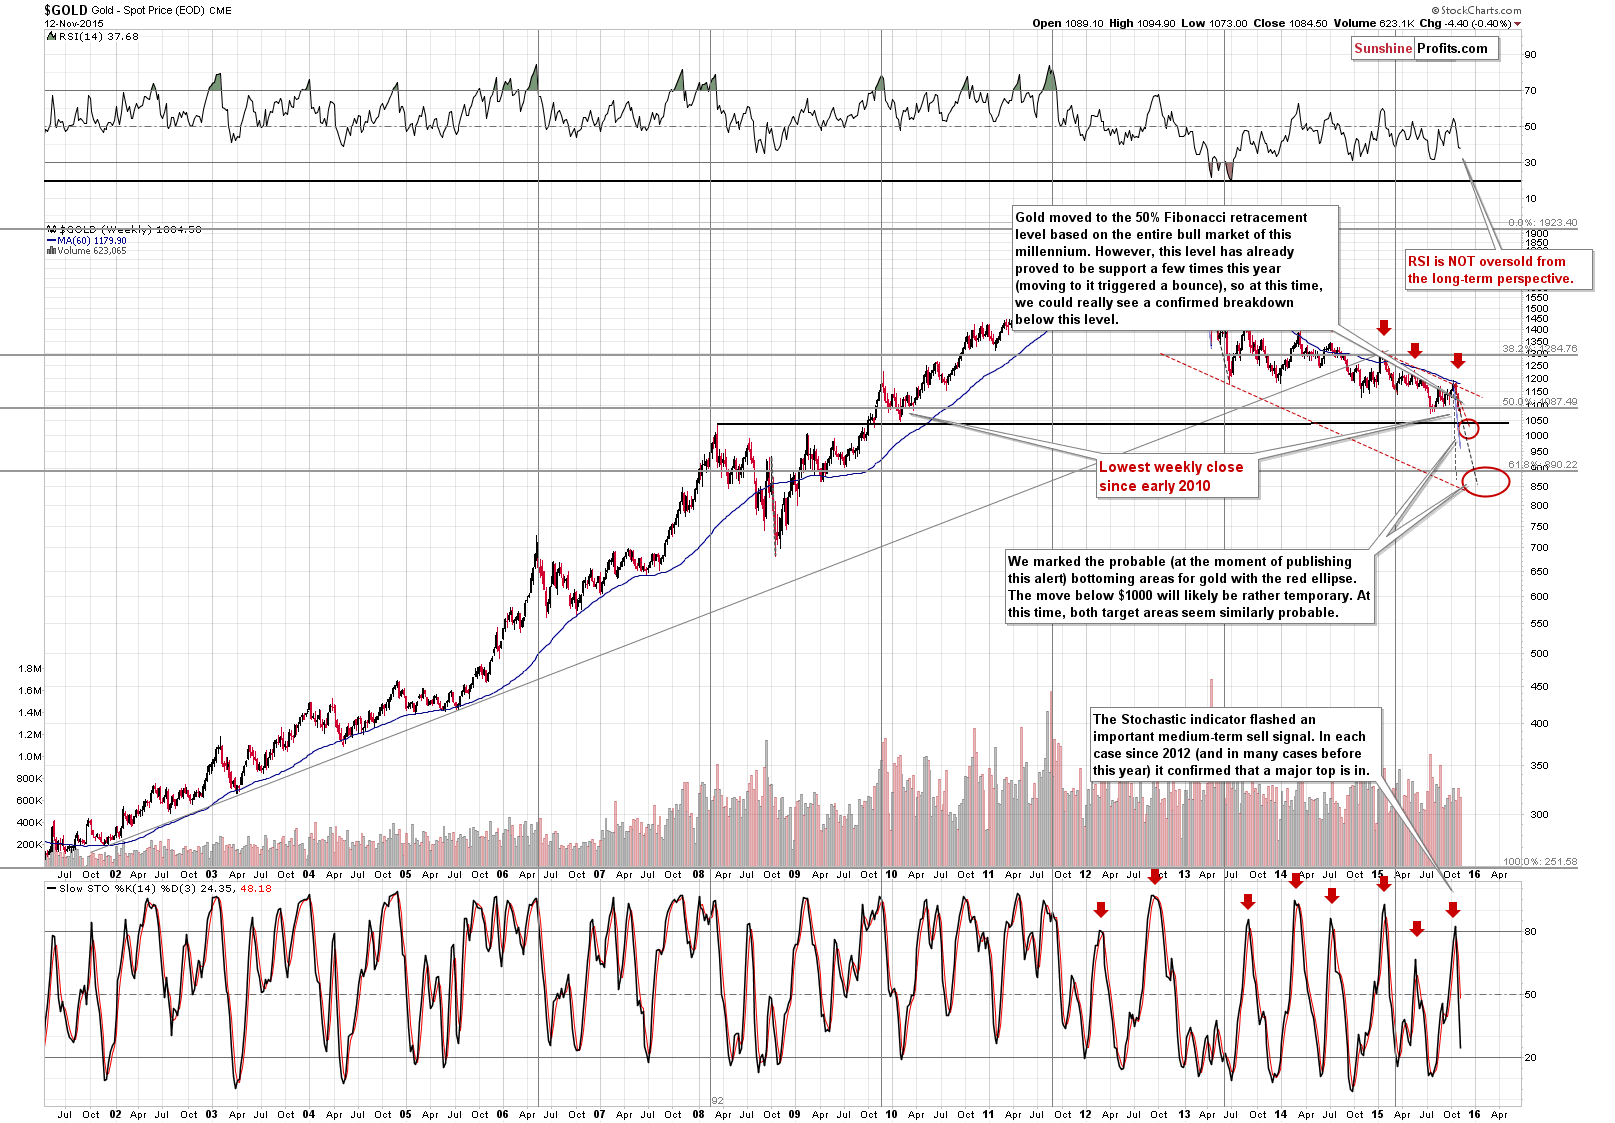
From the long-term perspective, we see that the RSI is not indicating an oversold condition and that the major sell signal from the weekly Stochastic indicator (which proved to be very reliable in the past years) remains in place. The short-term picture, however, remains rather blurry based on the above charts even though the medium-term trend remains clearly down.
Fortunately, no market moves on its own, so we can check related markets and ratios for clues.
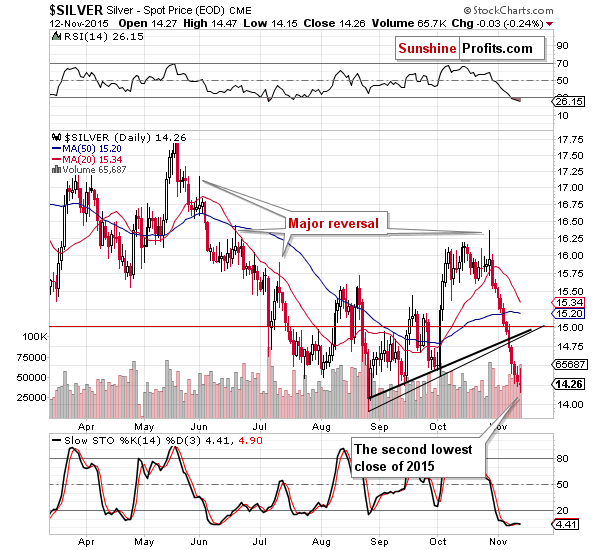
Silver closed at the second lowest level of this year and it will take just a little more for silver to break down. From the short-term perspective, not much changed and our yesterday’s comments remain up-to-date:
(…) we can say that the RSI being below 30 doesn’t necessarily imply a big rally. We saw good examples of this in mid-June and in early-July. We could see a corrective rally, but it’s not clear if it’s going to be anything more than just a 20-cent move.
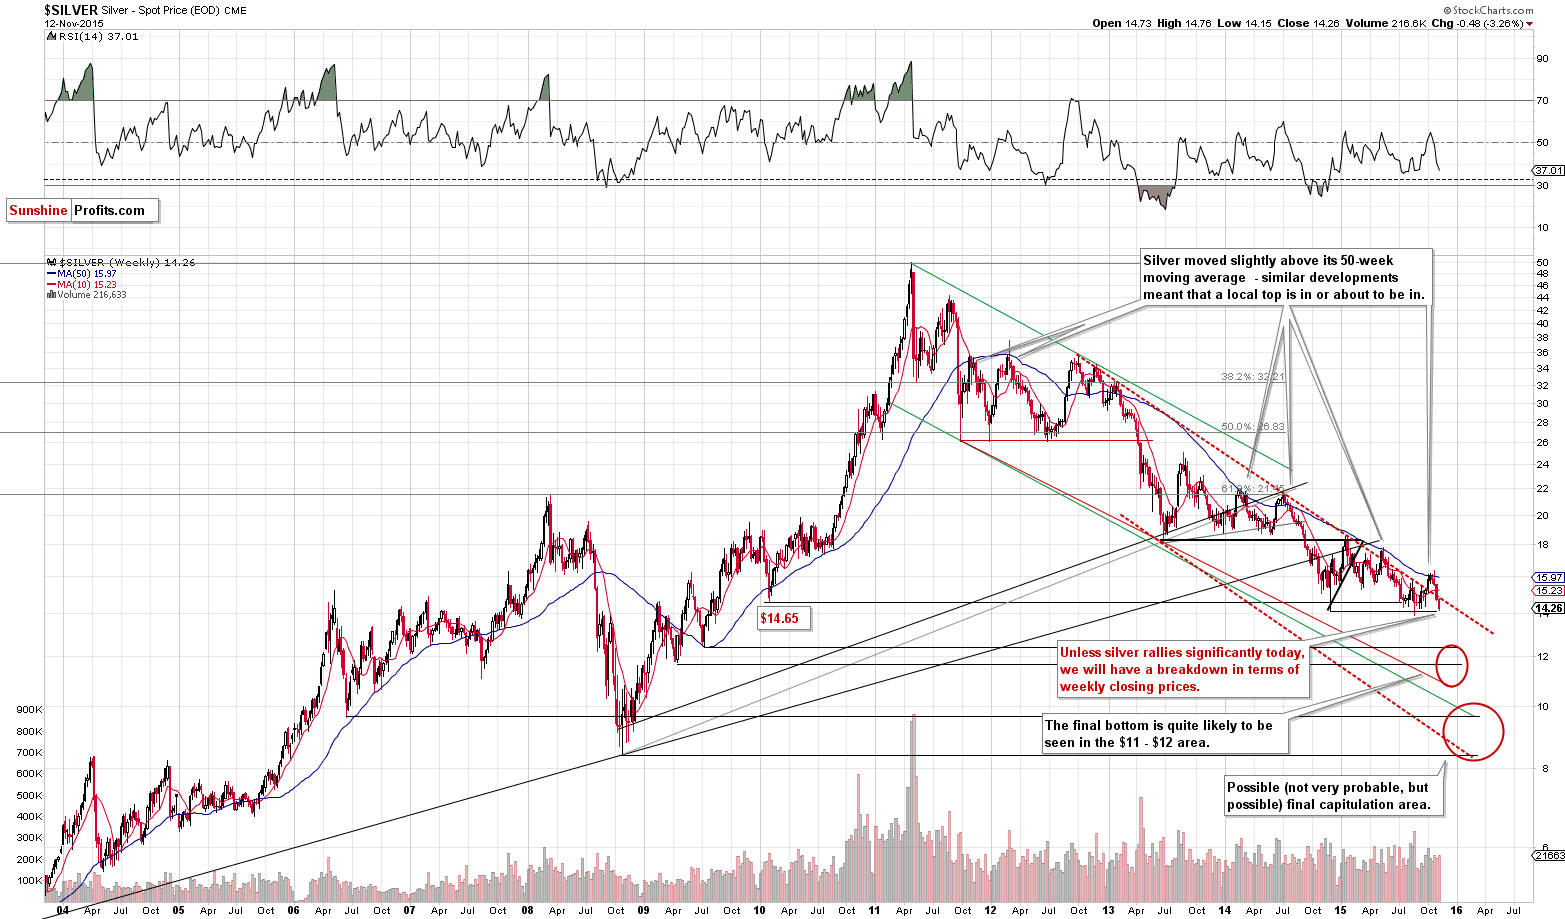
The long-term picture, however, is likely about to feature a major bearish sign – the breakdown in terms of weekly closing prices. The week is not over, but silver is already visibly below the previous weekly low ($14.55). All it takes for silver to flash this major sell signal is to do nothing. Unless silver rallies visibly, we will see a major breakdown not only below the previous 2015 low, but also a visible breakdown below the 2010 low.
What about the mining stocks?
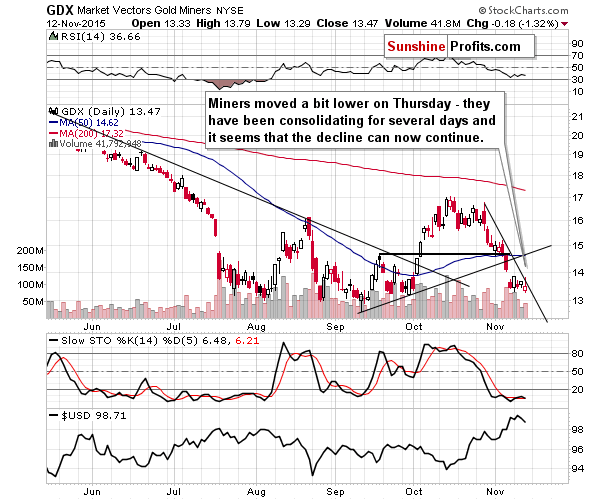
Miners have been moving back and forth in the last few days and they reached their short-term resistance line yesterday (and declined shortly thereafter). We have not seen a breakdown here yet, but that’s not to say that we won’t see one shortly.
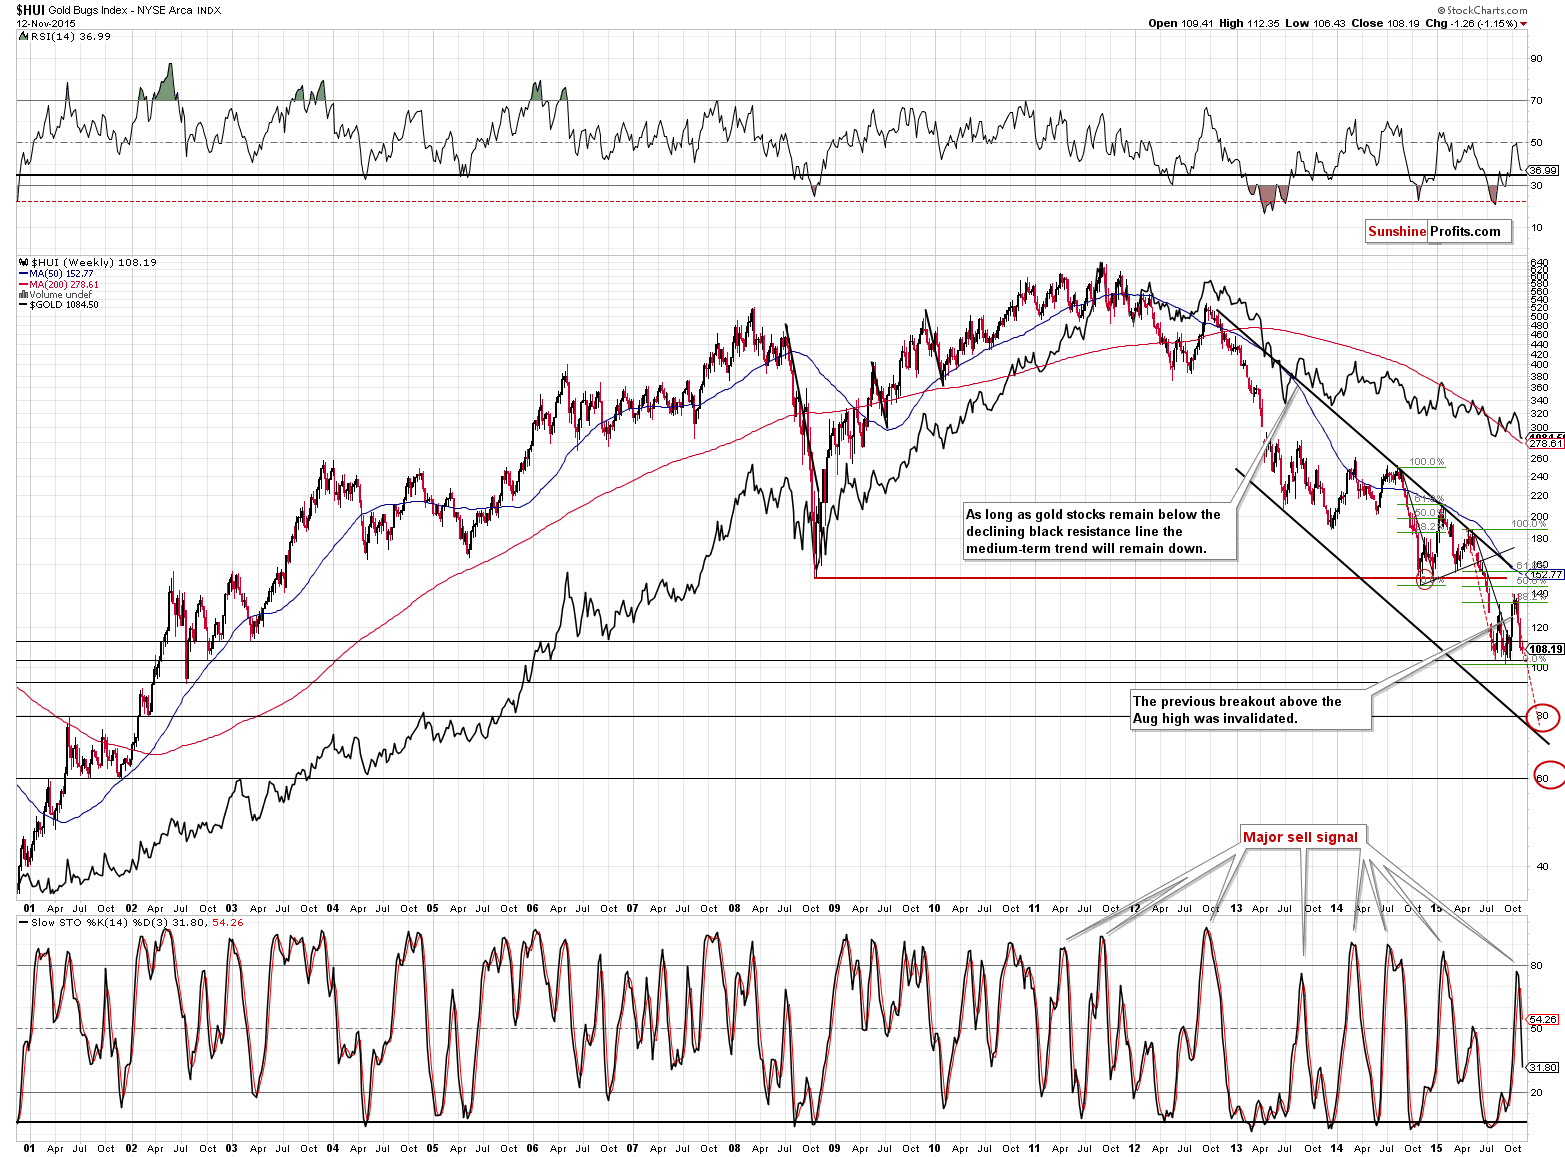
As you can see on the above long-term HUI Index chart, the outlook remains bearish. Gold stocks already corrected 2 times after moving to the 100 level (so the natural post-plunge bounce scenario does no longer apply here) and miners are after a major sell signal from the weekly Stochastic indicator (which has been extremely reliable for years).
The medium-term trend remains down but the above charts don’t tell us much about the very short-term outlook – it’s bearish, but we don’t have a significant bearish confirmation.
So, what’s the thing that can tell us which short-term scenario is more likely? The key context detail – the move in the USD Index.
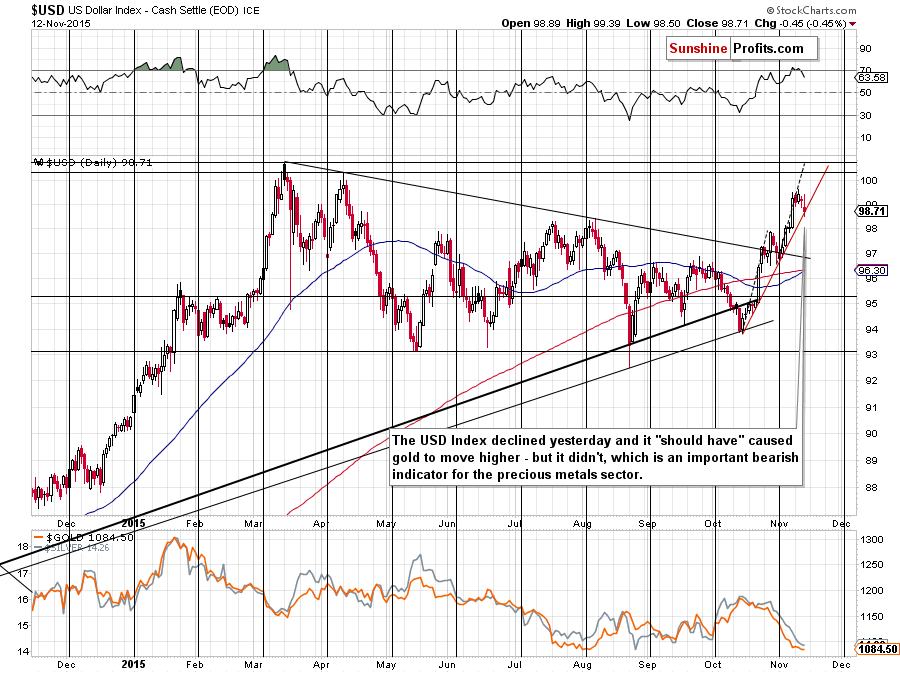
The USD Index moved down yesterday, which is very important at the current juncture in the precious metals market.
When a given market does something against the expectations it’s a strong signal that it will continue to move in the direction opposite to the initially expected. The USD declined, which is a bullish sign for the precious metals market. Gold had a good reason to rally regardless of the price that it had reached. And yet gold didn’t manage to rally despite reaching its 2015 low, which is another major trigger for an upswing. The relatively small comeback move in the final part of yesterday’s session is a very weak reaction to what happened in the USD Index.
Since gold had a very good reason (actually 2 very good reasons) to rally and it still managed to close below the previous low (in terms of daily closing prices) then it is a strong indication that it is a decline in the precious metals market that we should be expecting, not a rally.
Moreover, platinum has already broken below its previous lows of this year, which is also a bearish indication.
Additionally, gold is not making headlines despite a move to its previous lows. To be precise, it is making headlines, but they are not emphasized enough to be really significant and the levels that are being reached – are.
Before summarizing, we would like to draw your attention to the fact that at this time all of our positions have significant profits – by “all” we don’t mean just profits in gold, silver and mining stocks, but profits in all of our alerts. We have significantly profitable positions in Oil Trading Alerts, Stock Trading Alerts, Forex Trading Alerts, and Bitcoin Trading Alerts. They are all available at preferred terms until Monday, so if you want to take a look, it might be a good time to do so now.
Summing up, even though we think the next big move will be to the downside, we also think (based on yesterday’s reversal in gold) that we would prefer to close the short positions and quickly re-enter them if a rally (above $1,103) materialized. Before yesterday’s session we aimed to wait out the corrective upswing, but based on what happened yesterday, it seems that if the corrective upswing actually materializes, it will be more volatile than we had previously thought (yet, just as temporary), so it seems that being prepared to exit (and take profits off the table – we opened this short position when gold was at about $1,150) on a bigger bounce is more justified from the risk/reward perspective than staying short with the speculative capital (again, only IF a rally above $1,103 in gold is seen). Consequently, we are moving our stop-loss levels lower, while at the same time remaining bearish for the precious metals sector (and being prepared to take advantage of lower precious metals’ and miners’ prices). We are making no adjustments regarding the long-term investment capital – we’re staying out of the precious metals market with it.
As always, we will keep you – our subscribers – updated.
To summarize:
Trading capital (our opinion): Short position (full) position in gold, silver and mining stocks is justified from the risk/reward perspective with the following stop-loss orders and initial (! – this means that reaching them doesn’t automatically close the position) target prices:
- Gold: initial target price: $1,050; stop-loss: $1,103, initial target price for the DGLD ETN: $98.37; stop loss for the DGLD ETN $85.51
- Silver: initial target price: $12.60; stop-loss: $14.73, initial target price for the DSLV ETN: $96.67; stop loss for DSLV ETN $61.00
- Mining stocks (price levels for the GDX ETF): initial target price: $11.57; stop-loss: $14.23, initial target price for the DUST ETF: $26.61; stop loss for the DUST ETF $17.55
In case one wants to bet on junior mining stocks' prices (we do not suggest doing so – we think senior mining stocks are more predictable in the case of short-term trades – if one wants to do it anyway, we provide the details), here are the stop-loss details and initial target prices:
- GDXJ ETF: initial target price: $16.27; stop-loss: $20.03
- JDST ETF: initial target price: $46.47; stop-loss: $29.71
Long-term capital (our opinion): No positions
Insurance capital (our opinion): Full position
Plus, you might want to read why our stop-loss orders are usually relatively far from the current price.
Please note that a full position doesn’t mean using all of the capital for a given trade. You will find details on our thoughts on gold portfolio structuring in the Key Insights section on our website.
As a reminder – “initial target price” means exactly that – an “initial” one, it’s not a price level at which we suggest closing positions. If this becomes the case (like it did in the previous trade) we will refer to these levels as levels of exit orders (exactly as we’ve done previously). Stop-loss levels, however, are naturally not “initial”, but something that, in our opinion, might be entered as an order.
Since it is impossible to synchronize target prices and stop-loss levels for all the ETFs and ETNs with the main markets that we provide these levels for (gold, silver and mining stocks – the GDX ETF), the stop-loss levels and target prices for other ETNs and ETF (among other: UGLD, DGLD, USLV, DSLV, NUGT, DUST, JNUG, JDST) are provided as supplementary, and not as “final”. This means that if a stop-loss or a target level is reached for any of the “additional instruments” (DGLD for instance), but not for the “main instrument” (gold in this case), we will view positions in both gold and DGLD as still open and the stop-loss for DGLD would have to be moved lower. On the other hand, if gold moves to a stop-loss level but DGLD doesn’t, then we will view both positions (in gold and DGLD) as closed. In other words, since it’s not possible to be 100% certain that each related instrument moves to a given level when the underlying instrument does, we can’t provide levels that would be binding. The levels that we do provide are our best estimate of the levels that will correspond to the levels in the underlying assets, but it will be the underlying assets that one will need to focus on regarding the sings pointing to closing a given position or keeping it open. We might adjust the levels in the “additional instruments” without adjusting the levels in the “main instruments”, which will simply mean that we have improved our estimation of these levels, not that we changed our outlook on the markets. We are already working on a tool that would update these levels on a daily basis for the most popular ETFs, ETNs and individual mining stocks.
Our preferred ways to invest in and to trade gold along with the reasoning can be found in the how to buy gold section. Additionally, our preferred ETFs and ETNs can be found in our Gold & Silver ETF Ranking.
As always, we'll keep you - our subscribers - updated should our views on the market change. We will continue to send out Gold & Silver Trading Alerts on each trading day and we will send additional Alerts whenever appropriate.
The trading position presented above is the netted version of positions based on subjective signals (opinion) from your Editor, and the Tools and Indicators.
As a reminder, Gold & Silver Trading Alerts are posted before or on each trading day (we usually post them before the opening bell, but we don't promise doing that each day). If there's anything urgent, we will send you an additional small alert before posting the main one.
=====
Latest Free Trading Alerts:
A coalition of leftist parties who are against austerity has effectively ousted Portugal’s center-right government just few days after it took power. What does it imply for the gold market?
Will Portuguese Socialists Support Gold?
Credit spread may be an important factor for the gold market. Would you like to know why? We invite you to read our today’s article and learn what is the relationship between credit spreads and the price of gold.
Do Credit Spreads Move the Gold Price?
=====
Hand-picked precious-metals-related links:
Bargain hunters send US demand for bars, coins up 207%
Barrick Gold beats debt-busting target
Gold and platinum at multiyear lows
=====
In other news:
Six Strange Things That Have Been Happening in Financial Markets
World risks ‘persistently’ weak growth: IMF
Record oil stockpiles an 'unprecedented buffer': IEA
Cramer: Why this decline in oil is so frightening
Sweden checks trains for migrants in first border controls in 20 years
=====
Thank you.
Sincerely,
Przemyslaw Radomski, CFA
Founder, Editor-in-chief
Gold & Silver Trading Alerts
Forex Trading Alerts
Oil Investment Updates
Oil Trading Alerts

