

Briefly: In our opinion, no speculative positions in gold, silver and mining stocks are justified from the risk/reward point of view.
Yesterday was once again a rather boring day if one watched gold and silver only (their back-and-forth movement continues), but it was far from boring if one looked at the performance of mining stocks. They rallied quite visibly and finally outperformed gold. Gold is moving visibly higher also today. Is a bigger rally just around the corner?
Let’s take a closer look, starting with gold (charts courtesy of http://stockcharts.com).
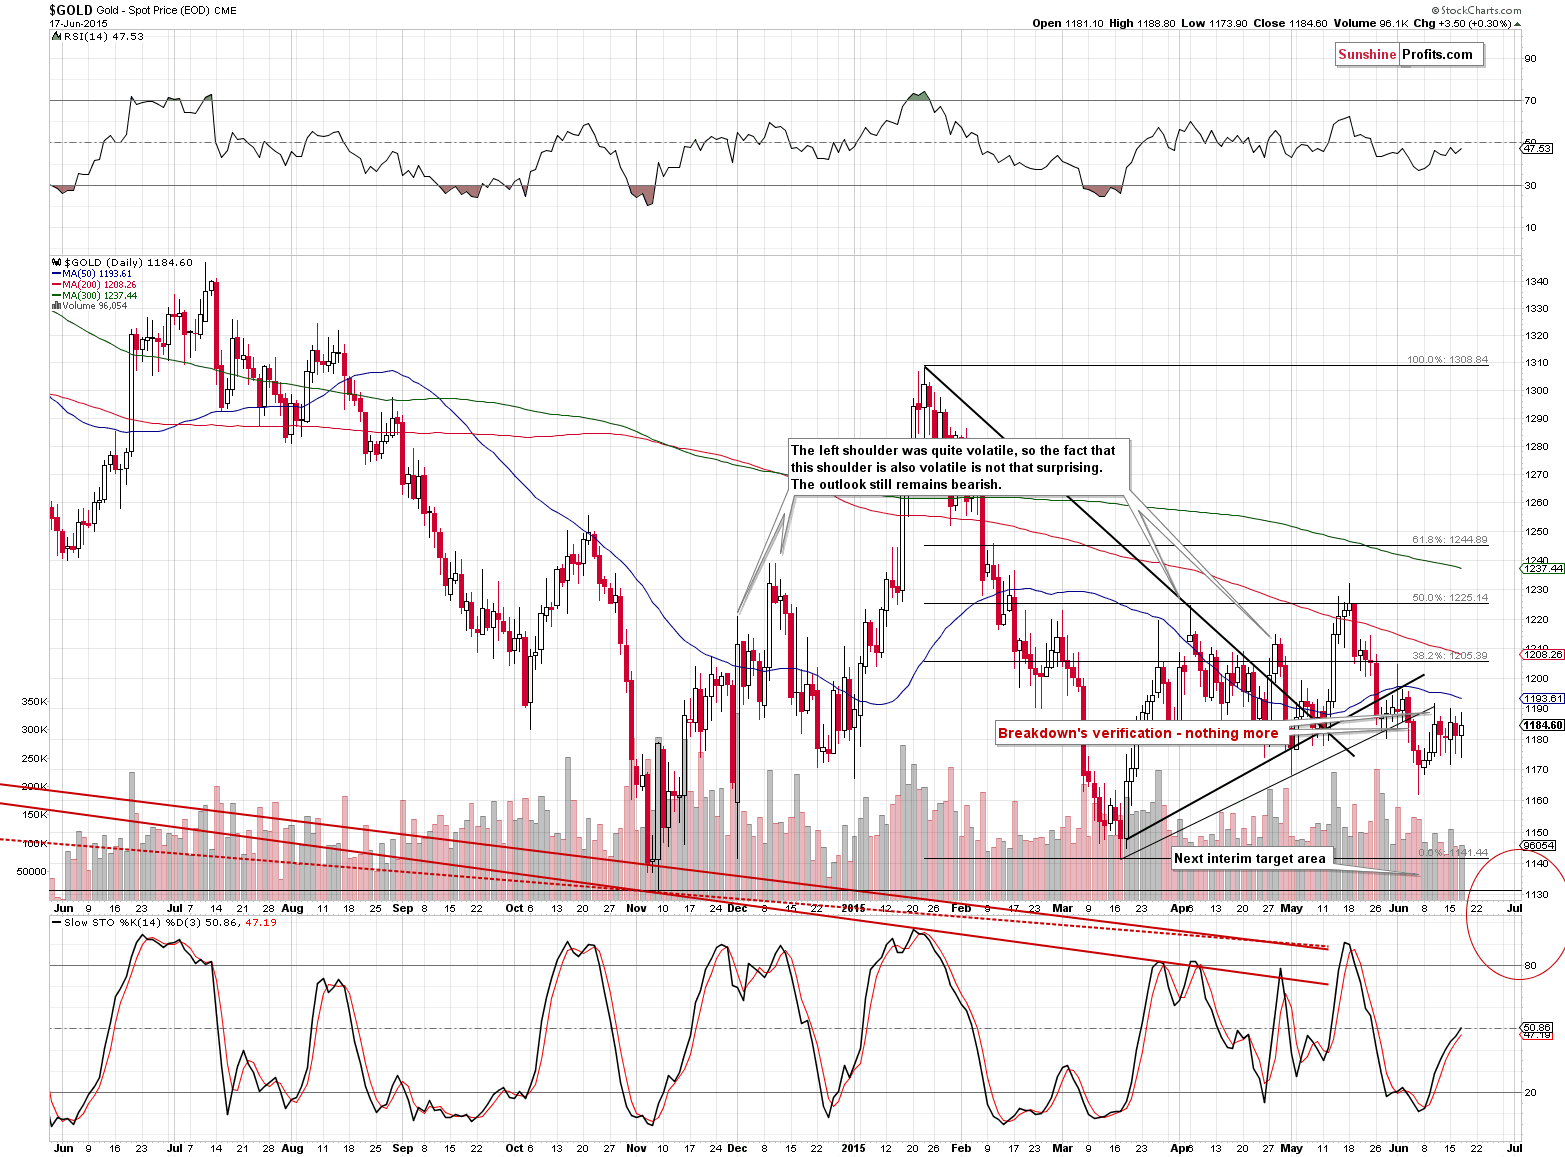
Gold didn’t to much yesterday, but at the moment of writing these words it’s at about $1,197. That’s a move above the 50-day moving average and more or less to the lower of the rising resistance lines. The short-term outlook improved based on today’s action but not significantly. If gold does indeed rally, we don’t think it would move above the May high (and if it does, we don’t think it would stay above this high for more than a few days).
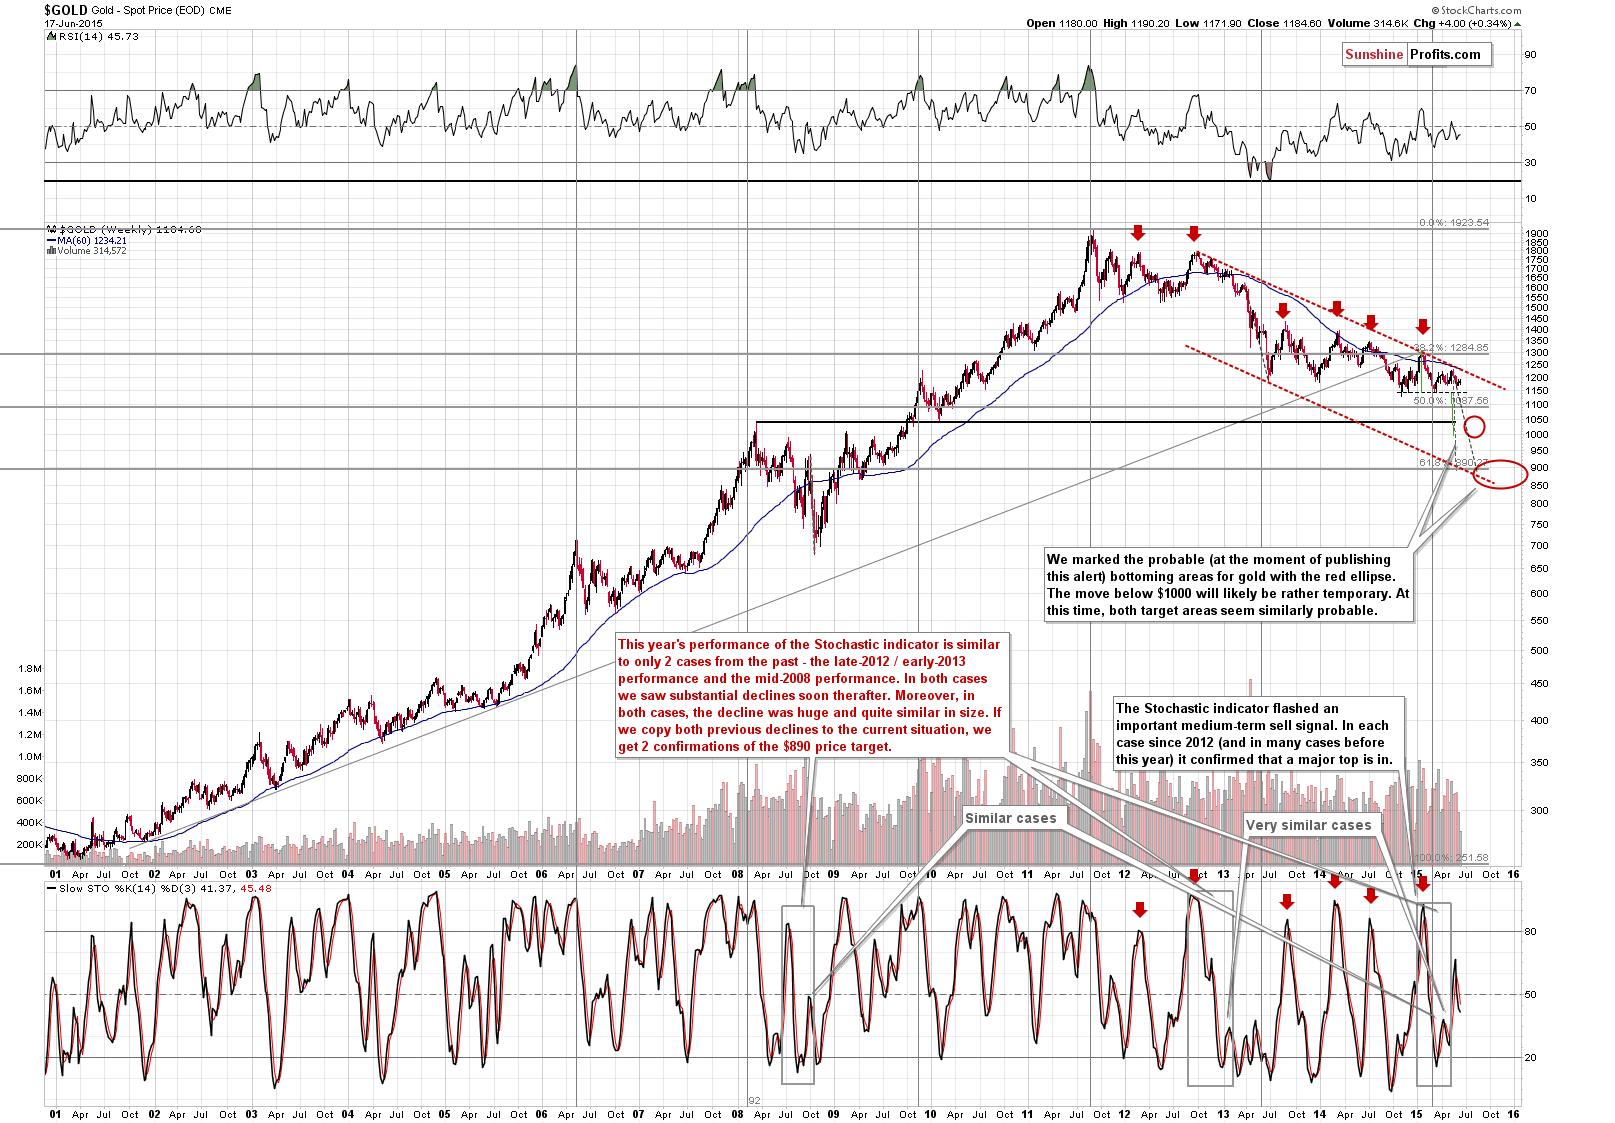
The long-term outlook is more important than medium-term outlook, which is more important than the short-term outlook. The above long-term chart tells us that the main medium-term trend didn’t change and it remains down. Furthermore, the upper border of the declining trend channel is at about $1,225, which makes it unlikely for gold to move much higher (being at $1,197 right now).
The implications of the very negative action in the Stochastic indicator remain in place, however, they are of a more medium- than short-term nature.
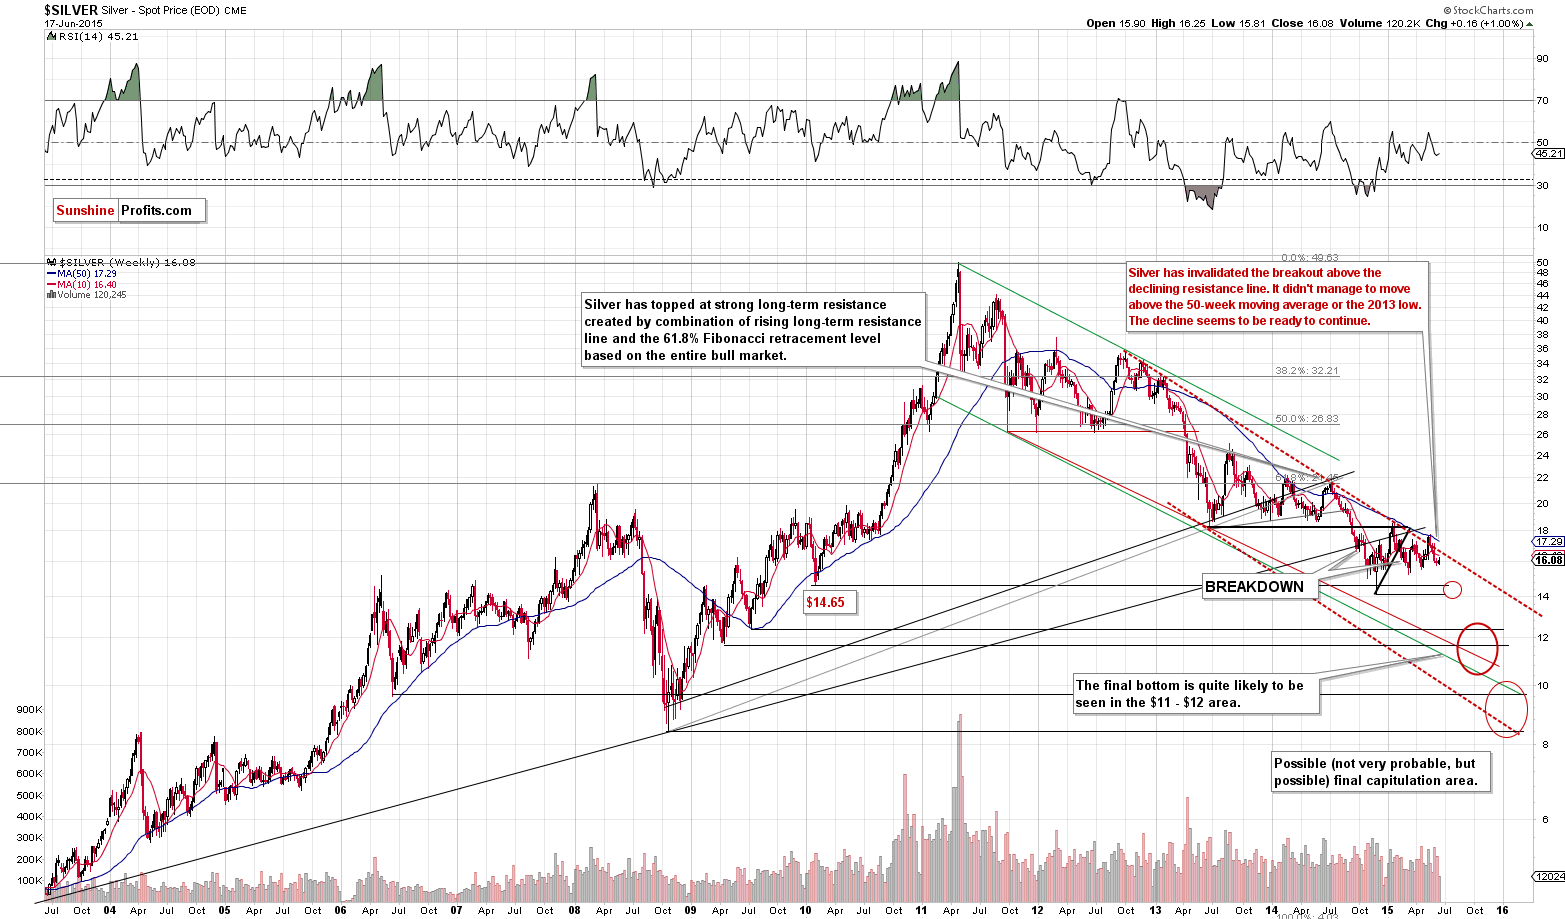
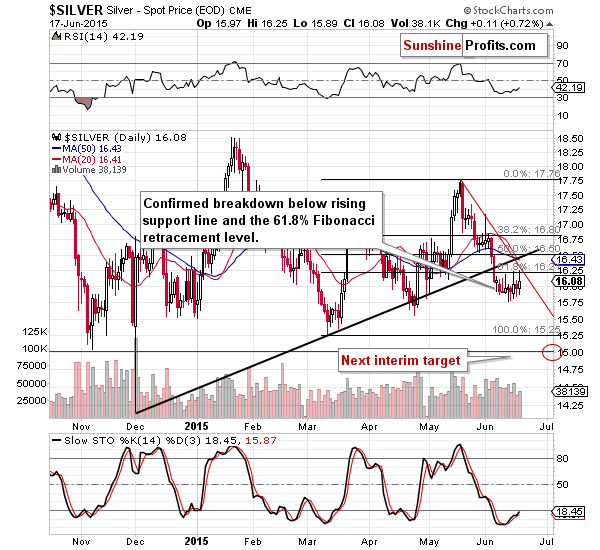
As far as silver is concerned, nothing changed from the long- and short-term perspectives. The main trend is down as you can see on the long-term chart and on the short-term chart you can see that silver remains below the rising and declining resistance lines as well as its 50-day moving average.
The critical thing here to keep in mind is silver’s “fakeout reputation”. By that we mean that silver tends to “break out” which serves as a major sell signal instead of a buy one. The majority of breakouts in silver, especially the sharp and “exciting” ones is invalidated and followed by declines. We would not be surprised to see something like that in the following days – if it happens, please keep the above in mind.
The overall implications of the above 2 charts are that silver is likely to move much lower in the following months, but the situation – though bearish – is not as clear as far as the short term is concerned.
Having said that, let’s move on to the part of the precious metals sector where the most significant action happened yesterday – mining stocks.
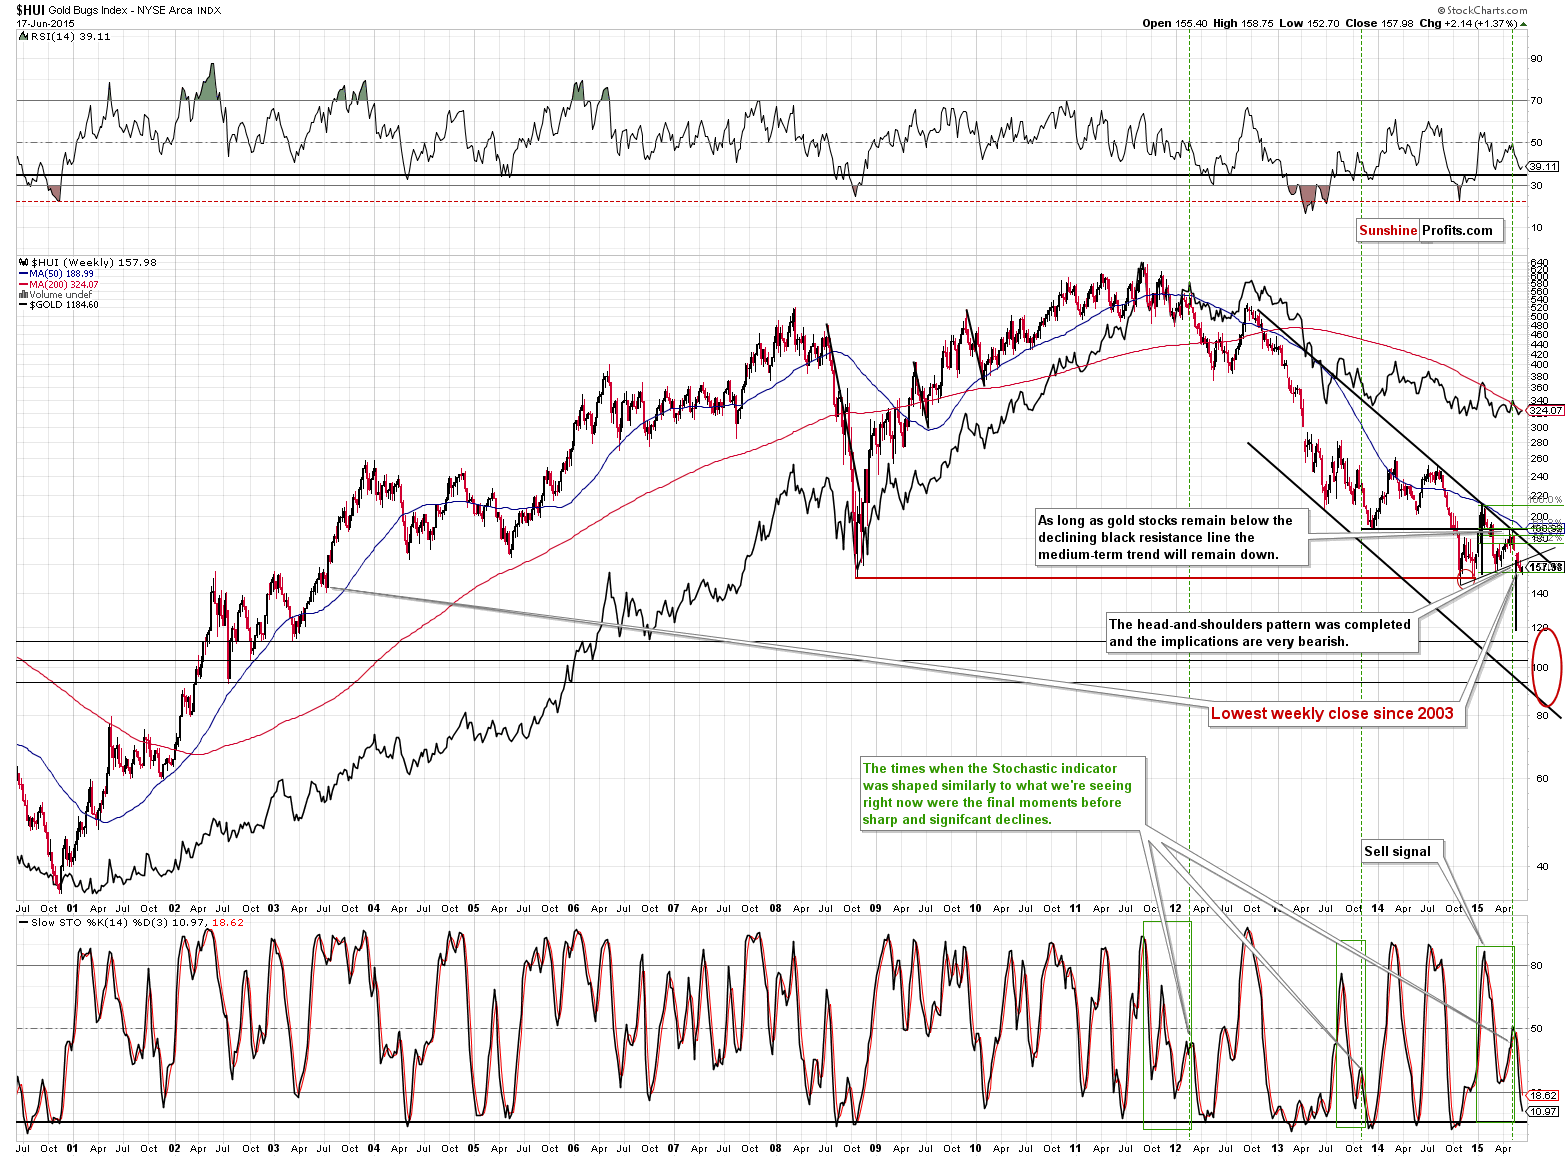
First of all, from the long-term perspective, yesterday’s rally didn’t change anything. The trend remains down and miners have just verified the breakdown below the neck level of the bearish head-and-shoulders pattern and are likely to move much lower in the coming weeks.
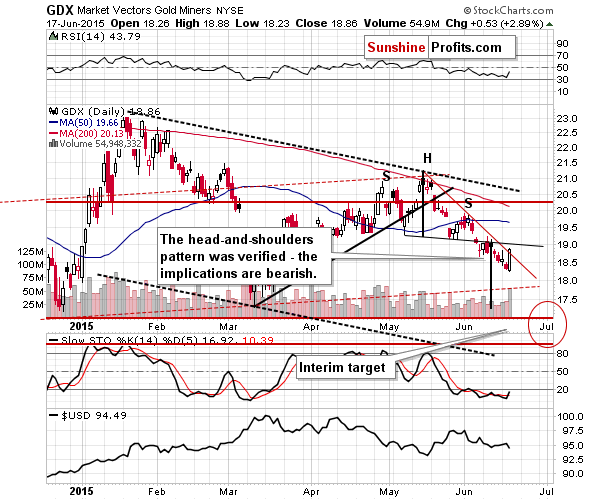
From the short-term point of view, we see that miners moved visibly higher (almost 3%) and that the move was accompanied by significant volume. Moreover, miners ended the session a bit above the declining resistance line (there was a small breakout). Since gold is moving higher today, it’s very likely that miners will also move higher and the breakout will be much more visible. The implications are bullish for the short term, but rather nonexistent for the medium term.
In most cases visible rallies on big volume that happened after a downswing meant that a bigger (not necessarily very big) rally would follow.
The implications of the above chart are bullish, but only for the short term. If miners indeed rally, we don’t expect them to rally much above the 175 level (if they manage to get there, that is) in the HUI Index as that’s where the declining long-term resistance line currently is.
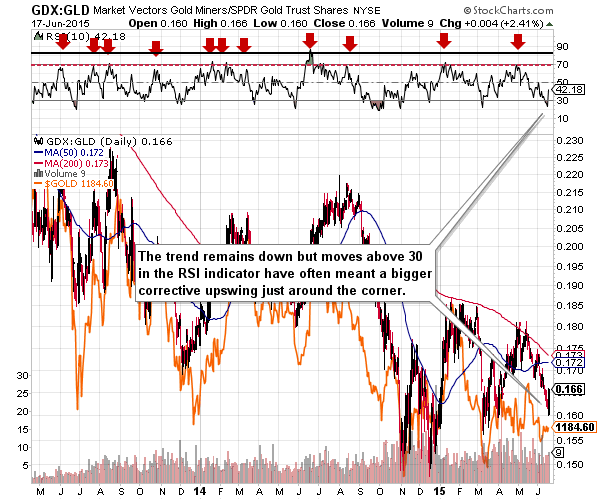
Earlier today we wrote that mining stocks had finally outperformed gold and the above chart illustrates it. The important thing here is that miners outperformed gold after a long period of underperformance. The RSI indicator in the upper part of the chart describes it. The decline in the ratio was significant enough to push the RSI below the 30 level. When the ratio managed to move back above it in the past cases it usually served as a bullish signal. Consequently, the implications of yesterday’s outperformance are bullish – for the short term.
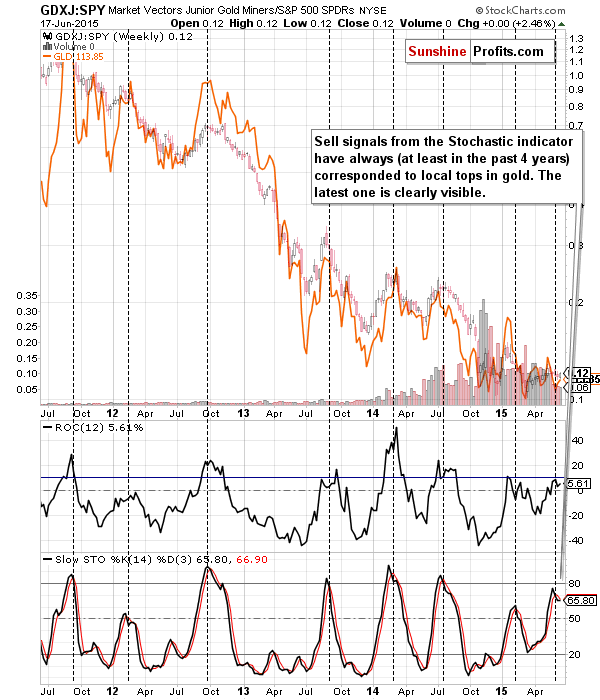
Speaking of ratios, let’s not forget the very effective ratio of juniors to the general stock market. The ratio has strong bearish medium-term implications and our previous comments on it remain up-to-date:
The above chart features junior mining stocks’ performance relative to the performance of the general stock market. This ratio moves quite in tune with gold, as when we take out the link between juniors and other stocks, the main driver of their prices is the underlying metal (either gold or another metal that moves in tune with gold anyway). The bottom line is that since this ratio moves in line with gold (but slightly differently) it can be used as a confirmation of gold’s moves.
The way that we can use the above knowledge is to apply the Stochastic indicator to the ratio. In each (!) case when the Stochastic indicator flashed a sell signal it was either at or close to a major top. If gold was moving higher before this signal it suggested that the top is about to be formed and if gold was moving lower before the signal, it confirmed that the top was indeed formed. We have just seen this little-known but very accurate signal and the implications are very bearish.
Summing up, the medium-term outlook for the precious metals sector remains unchanged an bearish, but – based on yesterday’s and today’s pre-market price action – it seems that we could see some more strength in the short term. In light of the latter, it seems that it’s best from the risk/reward perspective to close the current short positions (we had written about opening them before the Apr. 7 session, based on the Apr 6 closing prices: gold at $1214.50, silver at $16.96, the HUI at 173.27; significantly higher above the current values) and to re-enter them at higher prices (thus ultimately increasing the overall profits from the entire medium-term decline).
We will keep you – our subscribers – updated.
To summarize:
Trading capital (our opinion): No positions
Long-term capital (our opinion): No positions
Insurance capital (our opinion): Full position
Please note that a full position doesn’t mean using all of the capital for a given trade. You will find details on our thoughts on gold portfolio structuring in the Key Insights section on our website.
As a reminder – “initial target price” means exactly that – an “initial” one, it’s not a price level at which we suggest closing positions. If this becomes the case (like it did in the previous trade) we will refer to these levels as levels of exit orders (exactly as we’ve done previously). Stop-loss levels, however, are naturally not “initial”, but something that, in our opinion, might be entered as an order.
Since it is impossible to synchronize target prices and stop-loss levels for all the ETFs and ETNs with the main markets that we provide these levels for (gold, silver and mining stocks – the GDX ETF), the stop-loss levels and target prices for other ETNs and ETF (among other: UGLD, DGLD, USLV, DSLV, NUGT, DUST, JNUG, JDST) are provided as supplementary, and not as “final”. This means that if a stop-loss or a target level is reached for any of the “additional instruments” (DGLD for instance), but not for the “main instrument” (gold in this case), we will view positions in both gold and DGLD as still open and the stop-loss for DGLD would have to be moved lower. On the other hand, if gold moves to a stop-loss level but DGLD doesn’t, then we will view both positions (in gold and DGLD) as closed. In other words, since it’s not possible to be 100% certain that each related instrument moves to a given level when the underlying instrument does, we can’t provide levels that would be binding. The levels that we do provide are our best estimate of the levels that will correspond to the levels in the underlying assets, but it will be the underlying assets that one will need to focus on regarding the sings pointing to closing a given position or keeping it open. We might adjust the levels in the “additional instruments” without adjusting the levels in the “main instruments”, which will simply mean that we have improved our estimation of these levels, not that we changed our outlook on the markets. We are already working on a tool that would update these levels on a daily basis for the most popular ETFs, ETNs and individual mining stocks.
Our preferred ways to invest in and to trade gold along with the reasoning can be found in the how to buy gold section. Additionally, our preferred ETFs and ETNs can be found in our Gold & Silver ETF Ranking.
As always, we'll keep you - our subscribers - updated should our views on the market change. We will continue to send out Gold & Silver Trading Alerts on each trading day and we will send additional Alerts whenever appropriate.
The trading position presented above is the netted version of positions based on subjective signals (opinion) from your Editor, and the Tools and Indicators.
As a reminder, Gold & Silver Trading Alerts are posted before or on each trading day (we usually post them before the opening bell, but we don't promise doing that each day). If there's anything urgent, we will send you an additional small alert before posting the main one.
=====
Latest Free Trading Alerts:
On Tuesday, crude oil gained 0.72% ahead of API supply data. Additionally, concerns related to Tropical Storm Bill supported the price of the commodity, which resulted in a daily close above $60. Will we see another test of the major resistance zone later in the day?
Oil Trading Alert: Crude Oil above $60
Today, the Federal Reserve will announce its latest monetary-policy decision. What should investors expect from the June FOMC meeting?
What to Expect from the June FOMC Meeting?
=====
Hand-picked precious-metals-related links:
Bank of China joins LBMA gold price setters
The Push-Pull Dynamic in Gold & Silver
=====
In other news:
Fed up with Fed talk? Investors suffer from 'macro fatigue'
Three Unlearned Lessons of the Financial Crisis of 2008
China stocks dive, other markets down after Fed forecast cut
U.S. foreclosure activity up in May as bank repossessions rise
=====
Thank you.
Sincerely,
Przemyslaw Radomski, CFA
Founder, Editor-in-chief
Gold & Silver Trading Alerts
Forex Trading Alerts
Oil Investment Updates
Oil Trading Alerts

