

The yield curve is another overlooked, but potentially important factor in the gold market. It is a curve, which shows yields for similar bonds but with different maturities. The Treasury yield curve usually compares the three-month, two-year, five-year and 30-year U.S. Treasury debt, which create the term structure of (risk-free) interest rates. This useful economic indicator shows the relation between different interest rates. Normally, yields rise as maturity gets longer due to the risks associated with time, meaning that the slope of the yield curve is positive. However, sometimes the yield curve inverts and long-term yields fall below short-term yields. Inversion of the yield curve is quite a good predictor of recession. Credit crunch makes entrepreneurs scramble for resources to complete investment projects, bidding up the short term interest rates, while long-term creditors on the other hand accept lower yields, because they expect slowdown in the future.
The slope of the yield curve may also change over time. We say that the yield curve becomes steeper if longer term interest rates increase relatively to shorter term interest rates, and becomes flatter if longer term interest rates decrease relative to shorter term interest rates. Some analysts believe that such changes may be important for the gold market. Why? First, the yield curve can steepen because the Fed eases its monetary stance, which pushes short term interest rates down, while the long term interest rates remain unchanged (since the Fed’s control over the longer term interest rates is much weaker). Lower interest rates should then make gold more attractive in comparison to U.S. Treasury bills and other short term securities. Second, rising inflation expectations could push long term interest rates up, which is potentially bullish factor for gold (at least if investors buy it for hedging against inflation, which is not always the case).
Intuitively, this makes sense. However, the more detailed examination does not prove it. Let’s look at the chart below, which shows the price of gold and the Treasury yield curve, represented by the spread between 10-year and 3-month Treasury bonds.
Chart 1: Spread between 10-Year Treasury Constant Maturity and 3-Month Treasury Constant Maturity (green line, left scale, in percent) and the price of gold (yellow line, right scale, London P.M. Gold Fixing)
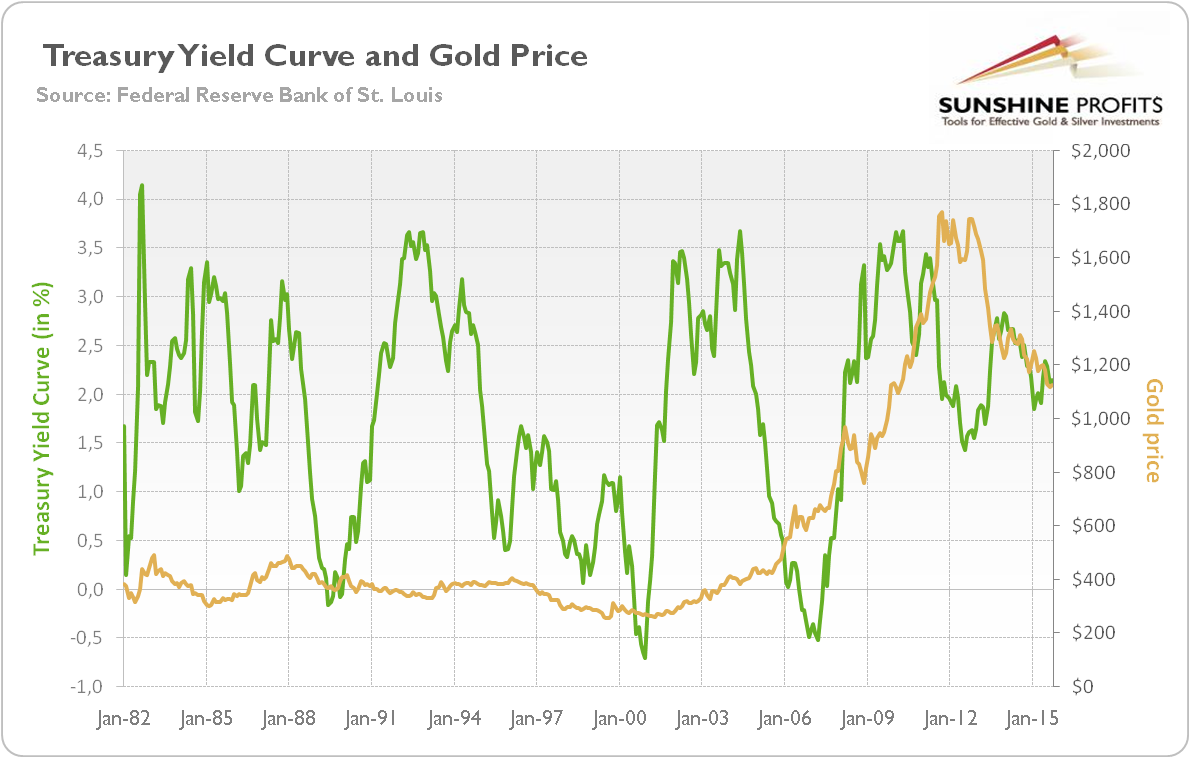
Although sometimes steepening (or flattening) of the yield curve was accompanied with rising (or declining) gold prices, there were also periods of negative correlation, or when gold moved independently to the changes in the slope of Treasury yield curve (1980s and 1990s). Therefore, there is no clear relationship between the Treasury yield curve and the price of gold.
The reason may be that the shiny metal is noncyclical, while the shape of yield curve is clearly cyclical. As one can see in the chart, the yield curve steepens at the beginning of the boom, as the Fed loosens monetary policy and short-term interest rates decrease. When the U.S. central bank reverses its stance, it raises the short-term interest rates. Thus, a tighter monetary policy manifests itself through flattening or even inversion of the yield curve, as credit crunch develops and entrepreneurs scramble for funds. Actually, the spread became negative (which means that the yield curve inverted) about one year before the last three recessions.
Therefore, one can argue that flattening of the yield curve should be bullish for gold, as a flatter yield curve indicates economic weakness, which should be beneficial for the safe-haven assets as gold. However, when the Fed tightens its stance, the interest rates often rise (even if not proportionately across all maturities), while confidence in the U.S. economy rises, which is negative for the gold market. This is why there is no clear relationship between the Treasury yield curve and the price of gold. Investors should remember that many factors drive asset prices in the financial markets, and gold is no exception.
The key takeaway is that the shape of Treasury yield curve is a useful indicator of economic conditions, hence helpful for gold investors, too. However, there is no clear relationship between the price of gold and the slope of the Treasury yield curve. Thus, although the yield curve can give us valuable insights into the future of the gold market, it is just one of the fundamental factors, which affect the price of the shiny metal. Gold investors should include them all in their analyses.
If you enjoyed the above analysis and would you like to know more about the most important factors influencing the price of gold, we invite you to read the November Market Overview report. If you’re interested in the detailed price analysis and price projections with targets, we invite you to sign up for our Gold & Silver Trading Alerts. If you’re not ready to subscribe at this time, we invite you to sign up for our gold newsletter and stay up-to-date with our latest free articles. It's free and you can unsubscribe anytime.
Thank you.
Arkadiusz Sieron
Sunshine Profits‘ Gold News Monitor and Market Overview Editor
Gold News Monitor
Gold Trading Alerts
Gold Market Overview
