
Earlier today, the Labor Department reported that the U.S. economy added 252,000 jobs in December, beating expectations for an increase of 240,000. The report also showed that the U.S. unemployment rate dropped to 5.6% last month from 5.8% in November. These upbeat data supported the USD Index, which still remains above the 2005 high. How did these numbers affect the picture of major currency pairs?
In our opinion the following forex trading positions are justified - summary:
- EUR/USD: none
- GBP/USD: none
- USD/JPY: none
- USD/CAD: none
- USD/CHF: none
- AUD/USD: long (stop loss: 0.7940; initial upside target: 0.8230)
EUR/USD
Quoting our Forex Trading Alert posted on Wednesday:
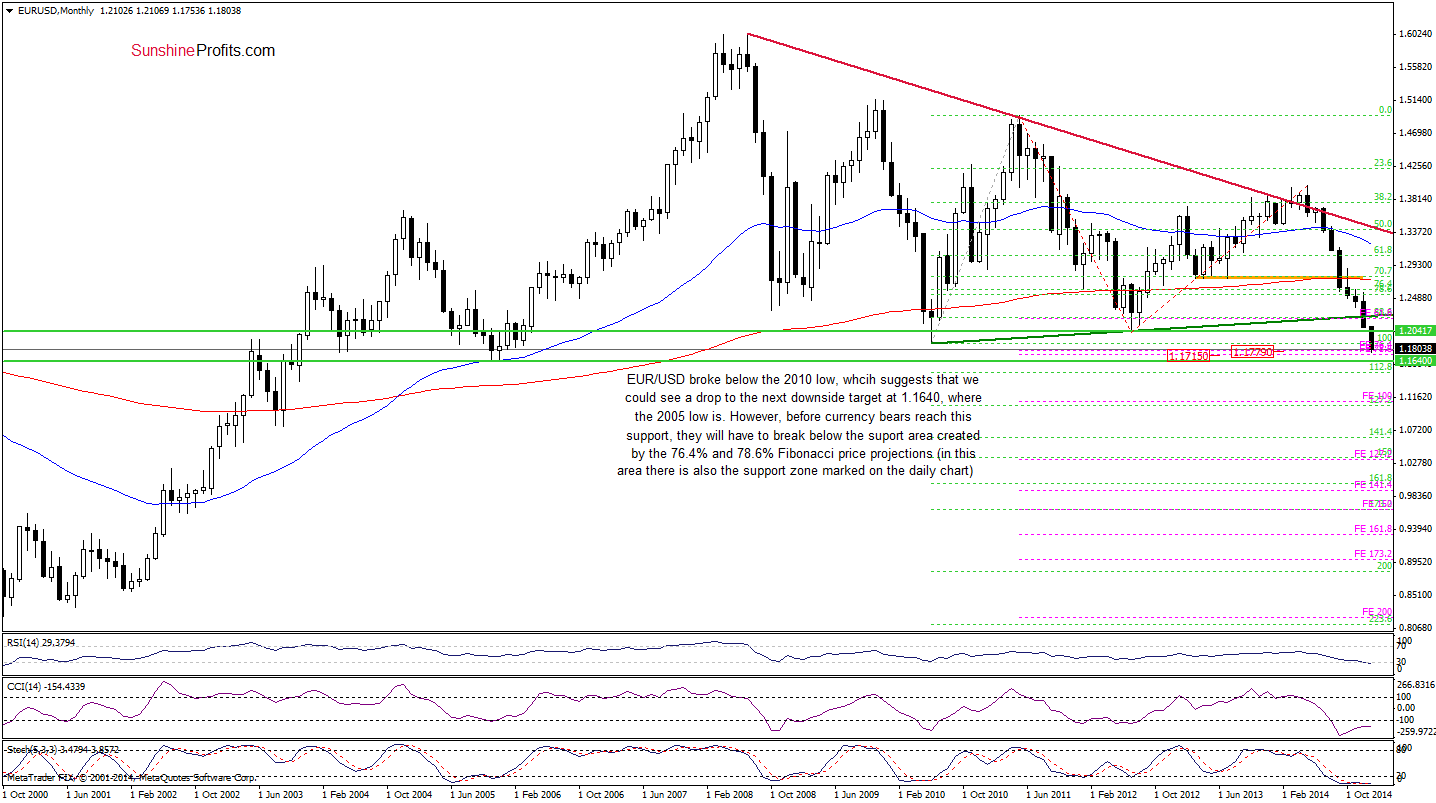
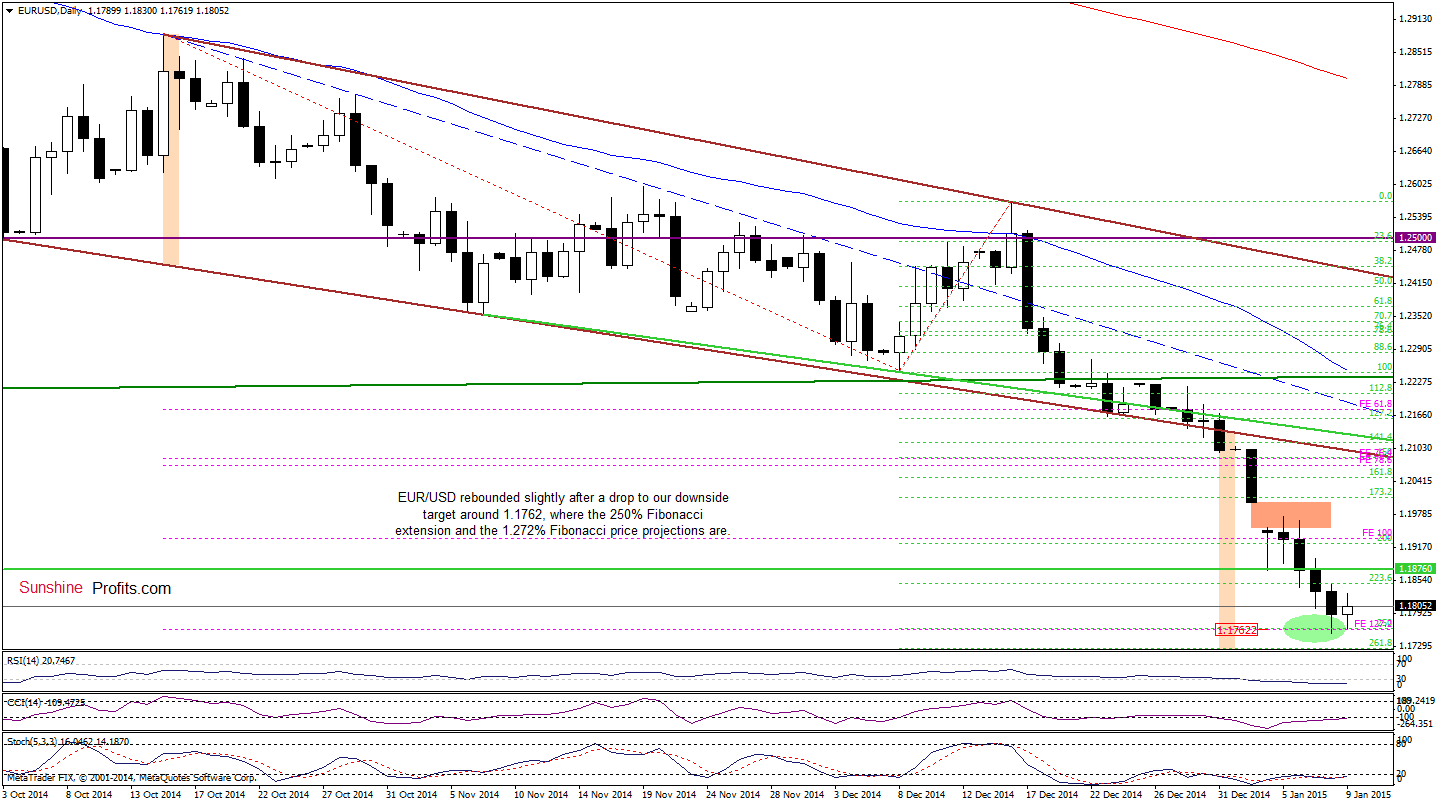
(…) we think that the exchange rate will move lower once again and the downside target would be around 1.1762, where the 250% Fibonacci extension and the 127.2% Fibonacci price projection is. At this point, it’s worth noting that this level is in a support area around 1.1715-1.1779 (marked on the weekly chart and created by the 76.4% and 78.6% Fibonacci price projections), which suggests that we could see a rebound from here in the coming week.
Looking at the chart, we see that the situation developed in tune with the above-mentioned scenario as EUR/USD reached our downside target. As you see on the daily chart, the support area encouraged currency bulls to act, which resulted in a rebound earlier today. Although this is a positive signal, which will likely trigger further improvement, we think that as long as the exchange rate is trading below the 2010 low, opening long positions is not justified from the risk/reward perspective. Nevertheless, if we see an invalidation of the breakdown below this important level, we’ll consider opening long positions.
Very short-term outlook: bullish
Short-term outlook: mixed
MT outlook: mixed
LT outlook: mixed
Trading position (short-term): In our opinion, no positions are justified from the risk/reward perspective at the moment. We will keep you informed should anything change, or should we see a confirmation/invalidation of the above.
GBP/USD
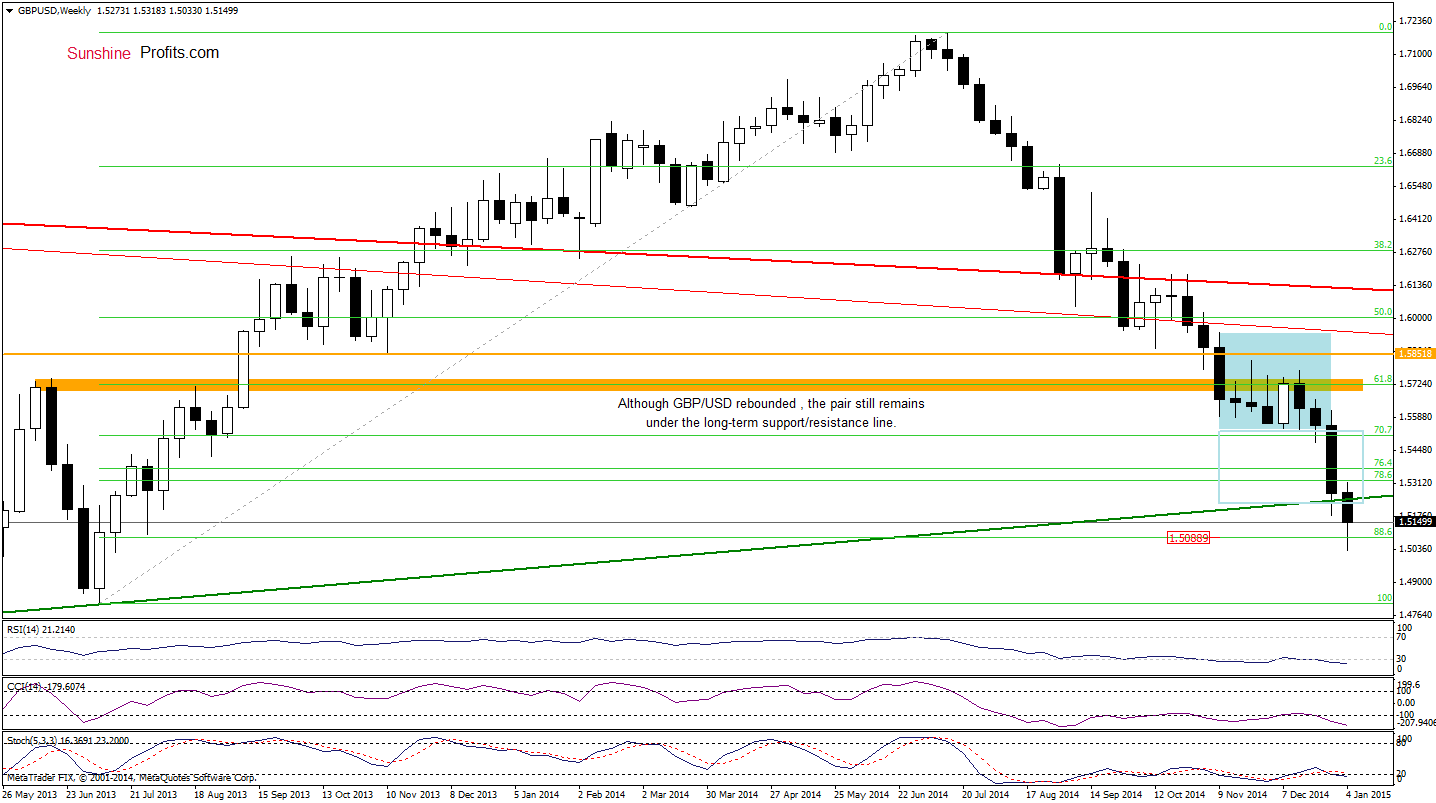
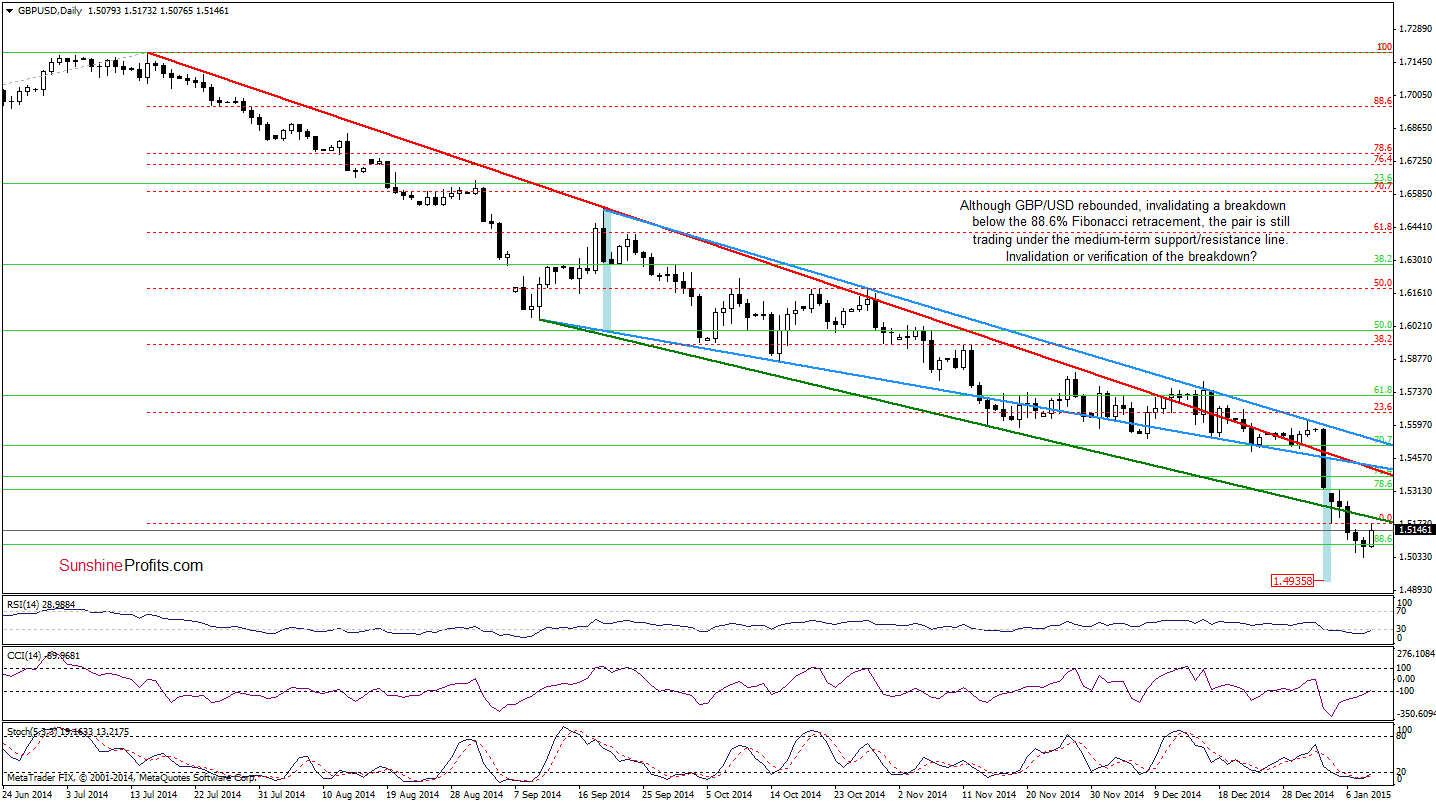
As you see on the charts, GBP/USD reversed and rebound, invalidating the breakdown below the 88.6% Fibonacci retracement. Although this is a bullish signal, we should keep in mind that the exchange rate is still trading under the previously-broken long- and medium-term green support/resistance lines. Therefore, as long as there is no invalidation of the breakdown below them, a sizable upward move is not likely to be seen. Nevertheless, the current position of the daily indicators (the CCI generated a buy signal, while the RSI and Stochastic Oscillator are very close to doing it) suggests that currency bulls will try to push the pair higher in the coming week. If they wins, we’ll consider opening long positions. Until this time, waiting on the sidelines and waiting for a profitable opportunity is the best choice at the moment.
Very short-term outlook: mixed
Short-term outlook: mixed
MT outlook: mixed
LT outlook: mixed
Trading position (short-term): In our opinion, no positions are justified from the risk/reward perspective at the moment. We will keep you informed should anything change, or should we see a confirmation/invalidation of the above.
USD/JPY
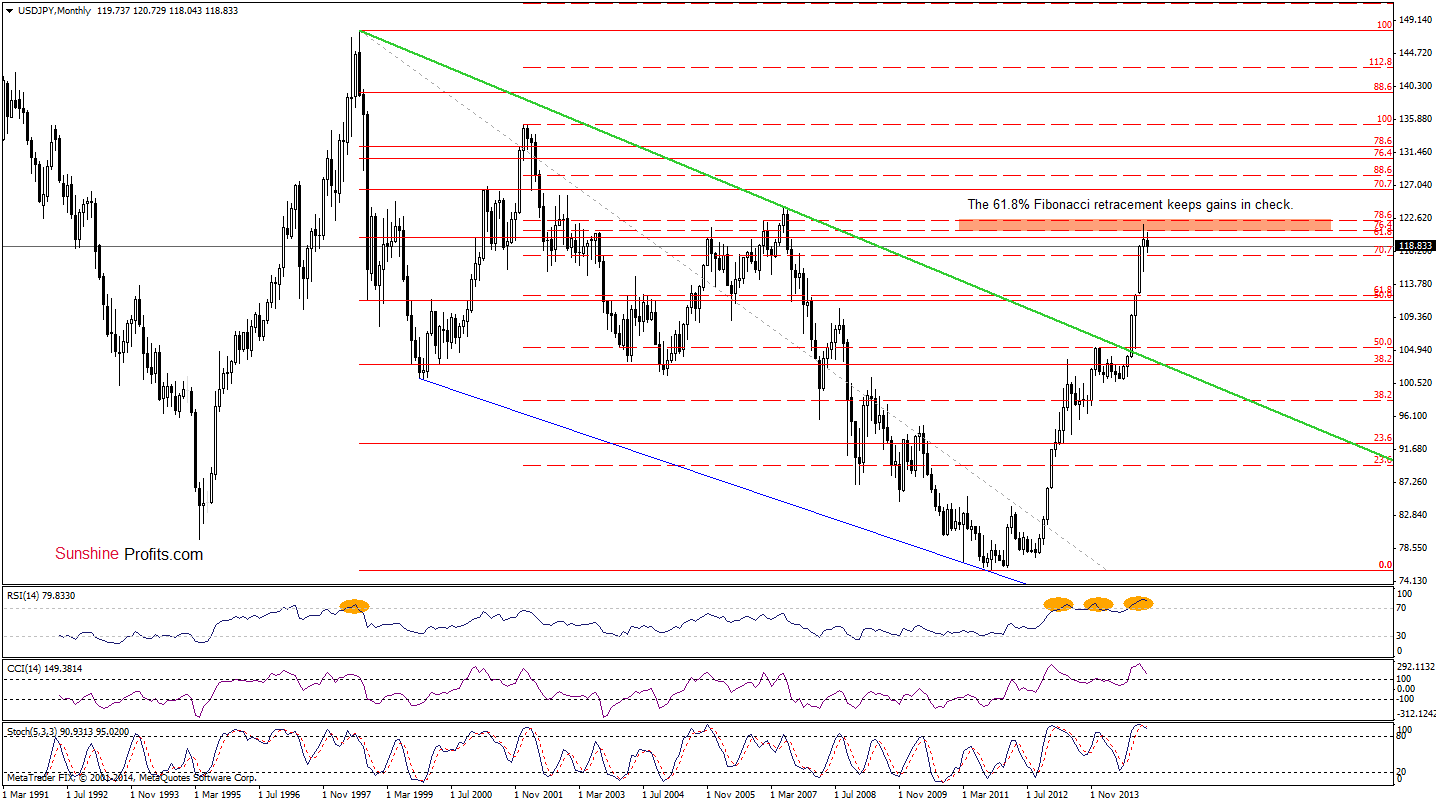
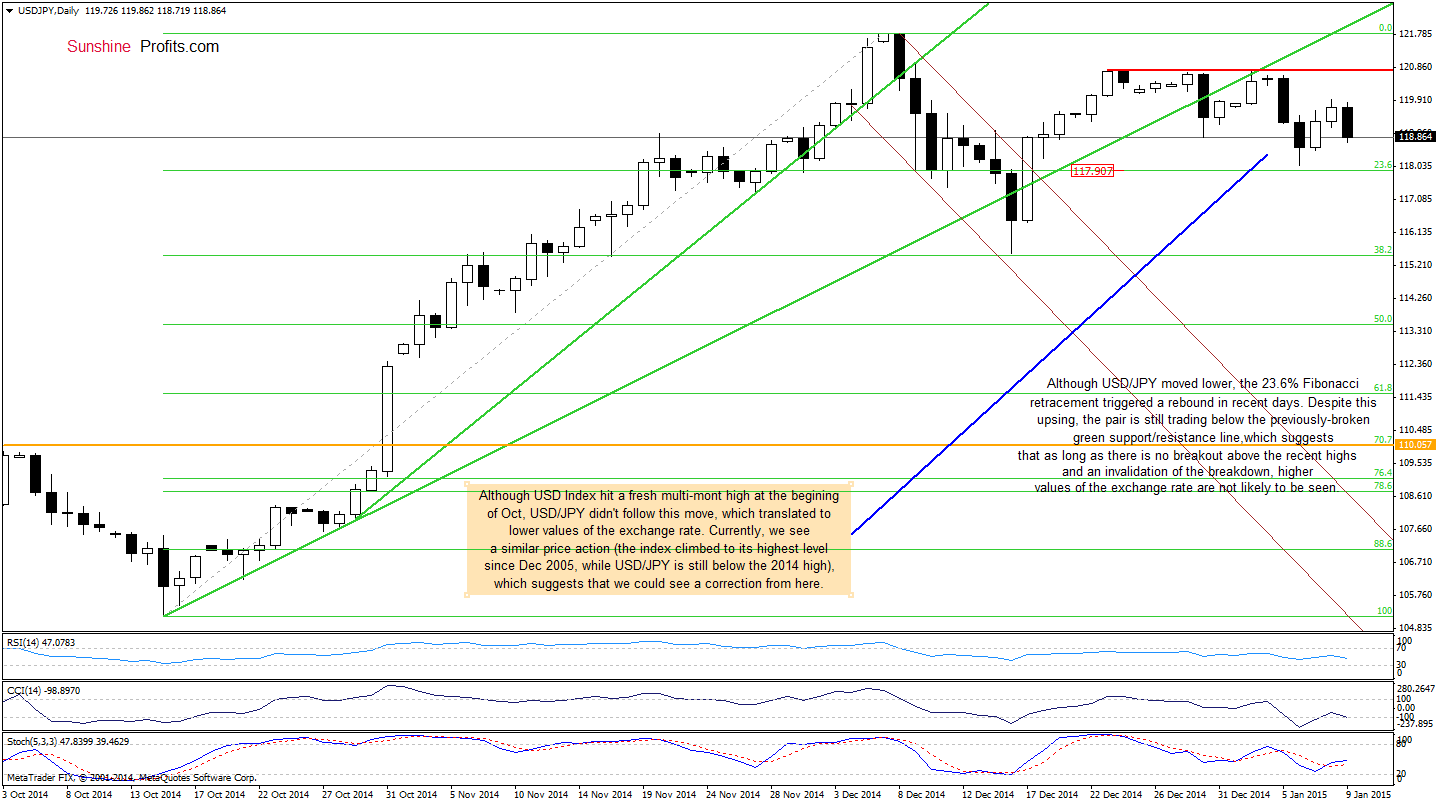
Looking at the above charts, we see that although USD/JPY moved lower, the proximity to the 23.6% Fibonacci retracement triggered a rebound in the recent days. Despite this upswing, the pair is still trading below the previously-broken green support/resistance line and the recent highs. This suggests that as long as there is no breakout above these levels, higher values of the exchange rate are not likely to be seen. Therefore, another test of the 23.6% Fibonacci retracement should not surprise us.
Before, we move to USD/CAD, please keep in mind what we wrote in our previous commentary on this currency pair:
(…) Firstly, the pair is still trading under the 61.8% Fibonacci retracement (based on the entire 1998-2011 declines), which successfully supports the resistance area marked on the daily chart. Secondly, although the USD Index hit fresh multi-year highs in the recent days, USD/JPY didn’t follow this move and still remains under the 2014 high. We saw similar price action at the beginning of Oct (marked with orange). Back then, such lack of a new high translated to lower values of the exchange rate. Therefore, we think that we could see a correction from here in the coming days (especially if the pair drops under 118.85).
Very short-term outlook: mixed with bearish bias
Short-term outlook: mixed with bearish bias
MT outlook: mixed
LT outlook: bullish
Trading position (short-term; our opinion): No positions are justified from the risk/reward perspective at the moment. We will keep you informed should anything change, or should we see a confirmation/invalidation of the above.
USD/CAD
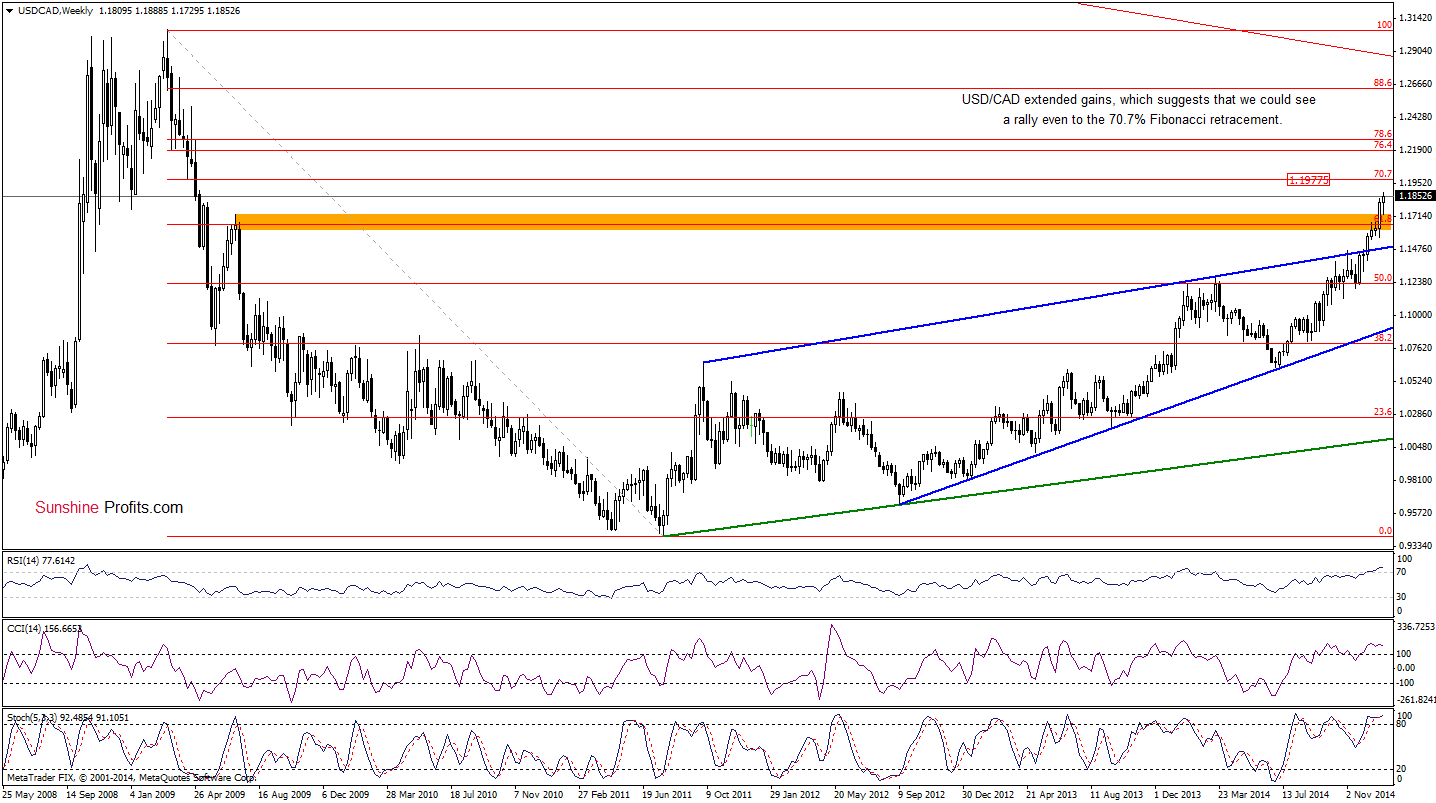
The situation in the medium term has improved slightly as USD/CAD broke above the last week’s high, which suggests further improvement – even to the 70.7% Fibonacci retracement (around 1.1977) in the coming week.
Are there any short-term resistances that could hinder the realization of the above scenario? Let’s examine the daily chart and find out.
Quoting our last commentary on this currency pair:
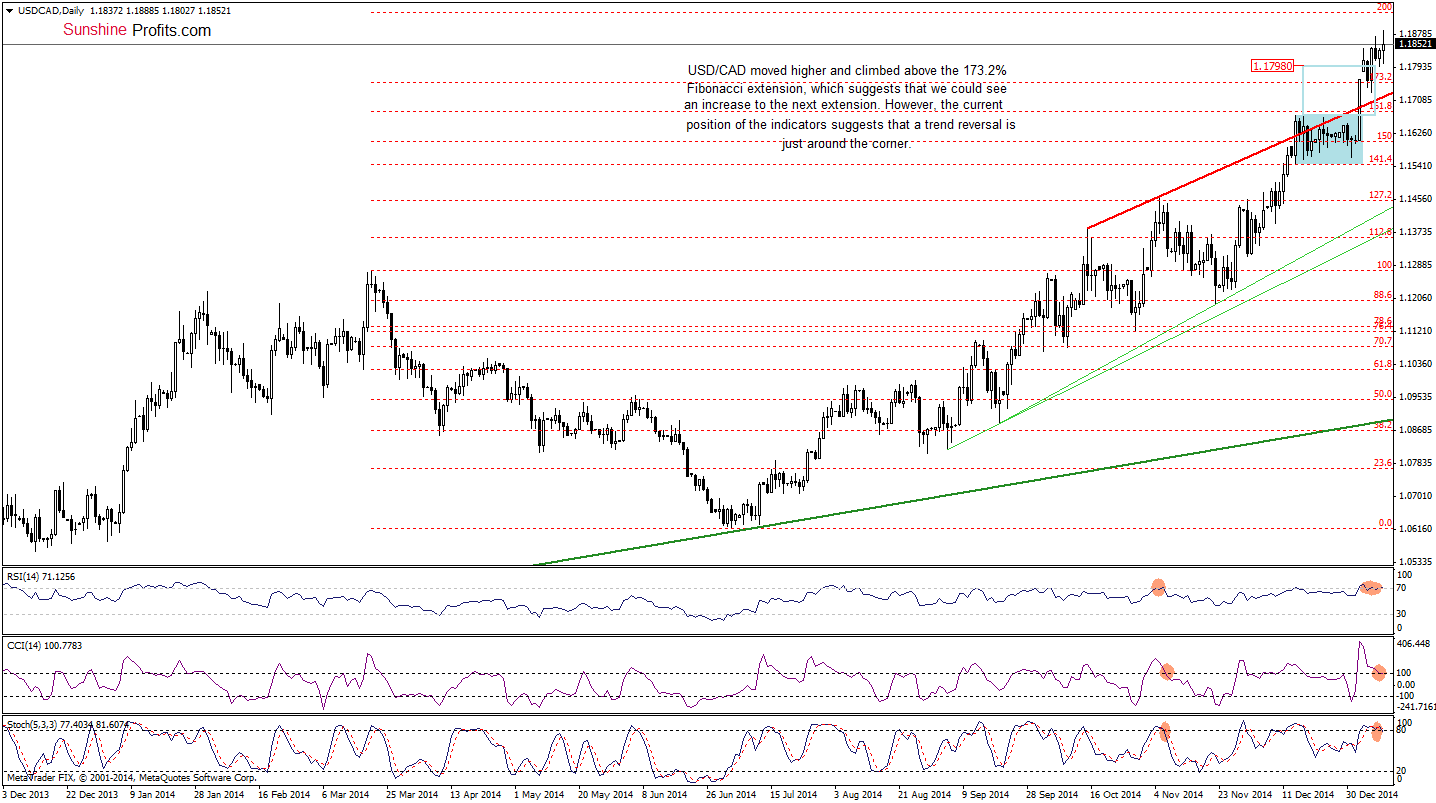
(…) USD/CAD moved sharply higher, breaking not only above the Dec highs, but also above the upper line of the consolidation (marked with blue). (…) the red resistance line, which suggests further improvement and an increase to at least 1.1756, where the 173.2% Fibonacci extension is. However, taking into account the breakout from the consolidation, USD/CAD could increase even to around 1.1800, where the size of the upward move will correspond to the height of the consolidation.
Looking at the daily chart, we see that currency bulls not only realized the above-mentioned scenario, but also managed to push the pair higher. This is a positive signal, which suggests that USD/CAD could move even to around 1.1928, where the 200% Fibonacci extension is. Nevertheless, the current position of the indicators (they are very close to generate sell signals) suggests that a trend reversal is just around the corner.
Very short-term outlook: bullish
Short-term outlook: mixed with bullish bias
MT outlook: mixed
LT outlook: mixed
Trading position (short-term; our opinion): No positions are justified from the risk/reward perspective at the moment. We will keep you informed should anything change, or should we see a confirmation/invalidation of the above.
USD/CHF
On Wednesday, we wrote the following:
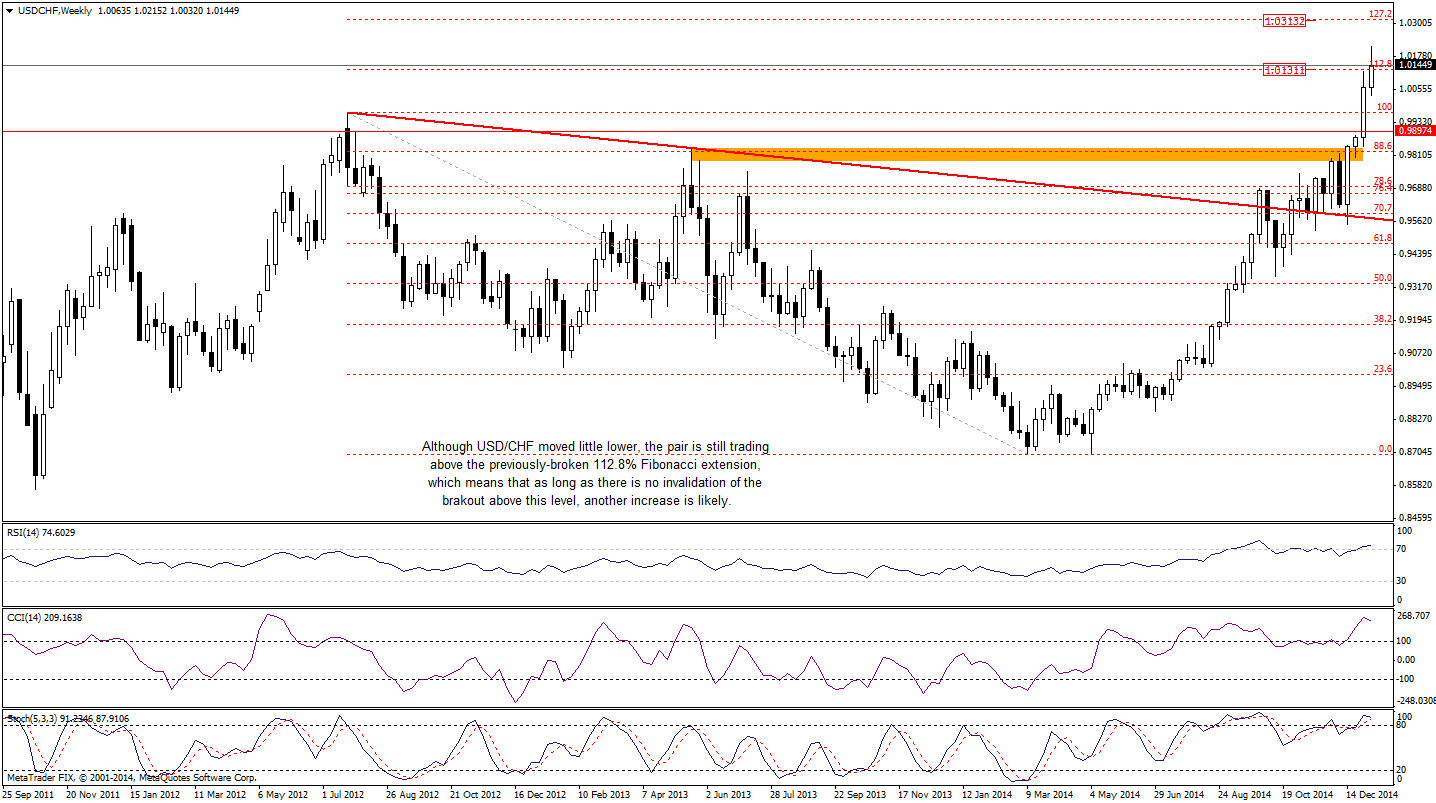
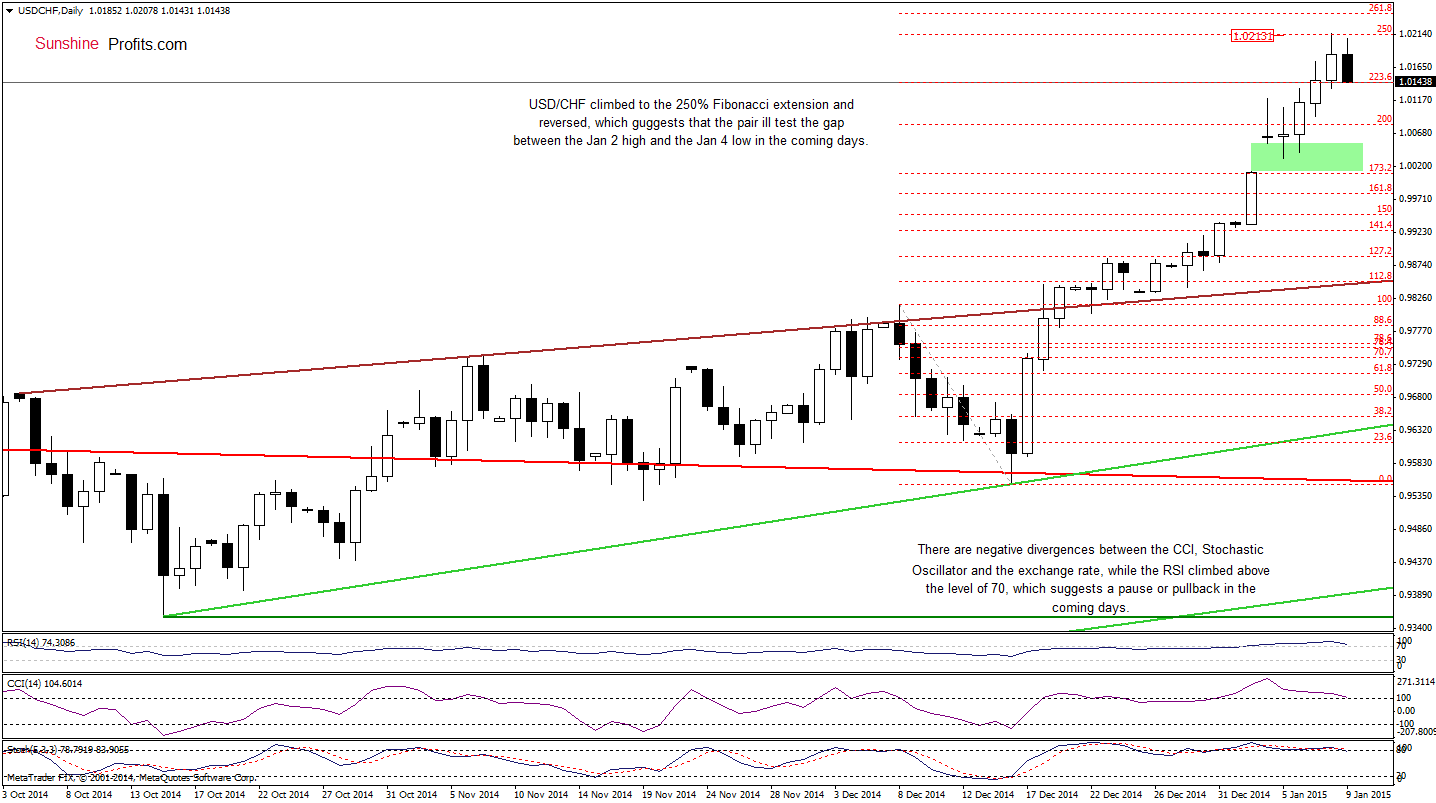
(…) the pair also climbed to the 223.6% Fibonacci extension, which suggests that a breakout above these levels will trigger an increase to around 1.0213 (the 250% Fibonacci extension) or even to 1.0313, where the 127.2% Fibonacci extension (based on the entire 2012-2014 declines and marked on the weekly chart) is. Despite this positive outlook, we should keep in mind that there are negative divergences between the CCI, Stochastic Oscillator and the exchange rate, while the daily RSI climbed above the level of 70, which suggests that a pause or even a correction in the coming week should not surprise us.
As you see on the daily chart, the situation developed in tune with the above-mentioned scenario as USD/CHF climbed to our first upside target and reversed. Although today’s pullback is quite shallow, the current position of the indicators suggest that the exchange rate will test the nearest support – the gap between the Jan 2 high and the Jan 4 low in the coming days. This scenario will be even more likely of the pair invalidates the breakout above the 112.8% Fibonacci extension (marked on the weekly chart).
Very short-term outlook: mixed with bearish bias
Short-term outlook: mixed
MT outlook: mixed
LT outlook: bearish
Trading position (short-term; our opinion): No positions are justified from the risk/reward perspective at the moment. We will keep you informed should anything change, or should we see a confirmation/invalidation of the above.
AUD/USD
Yesterday, we wrote the following:
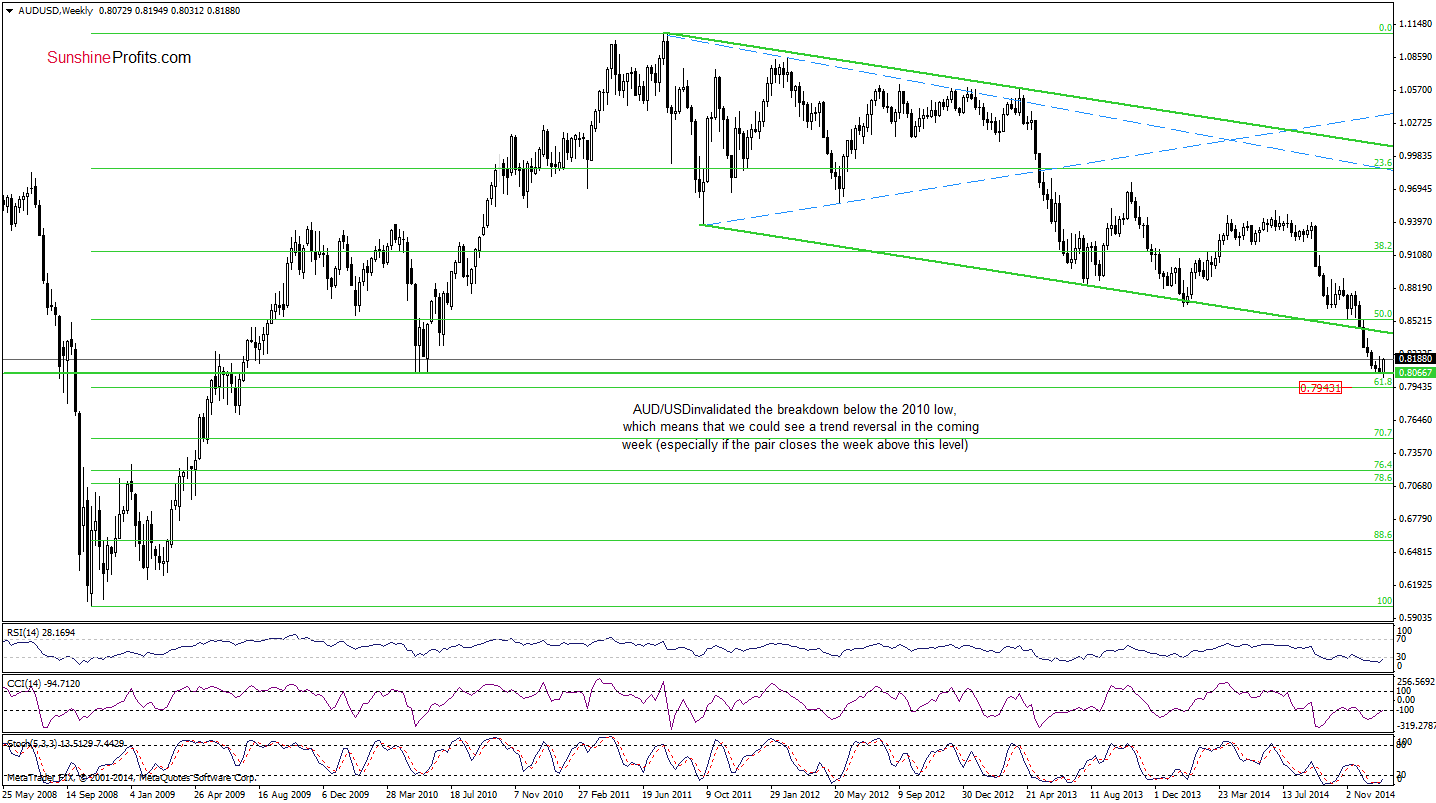
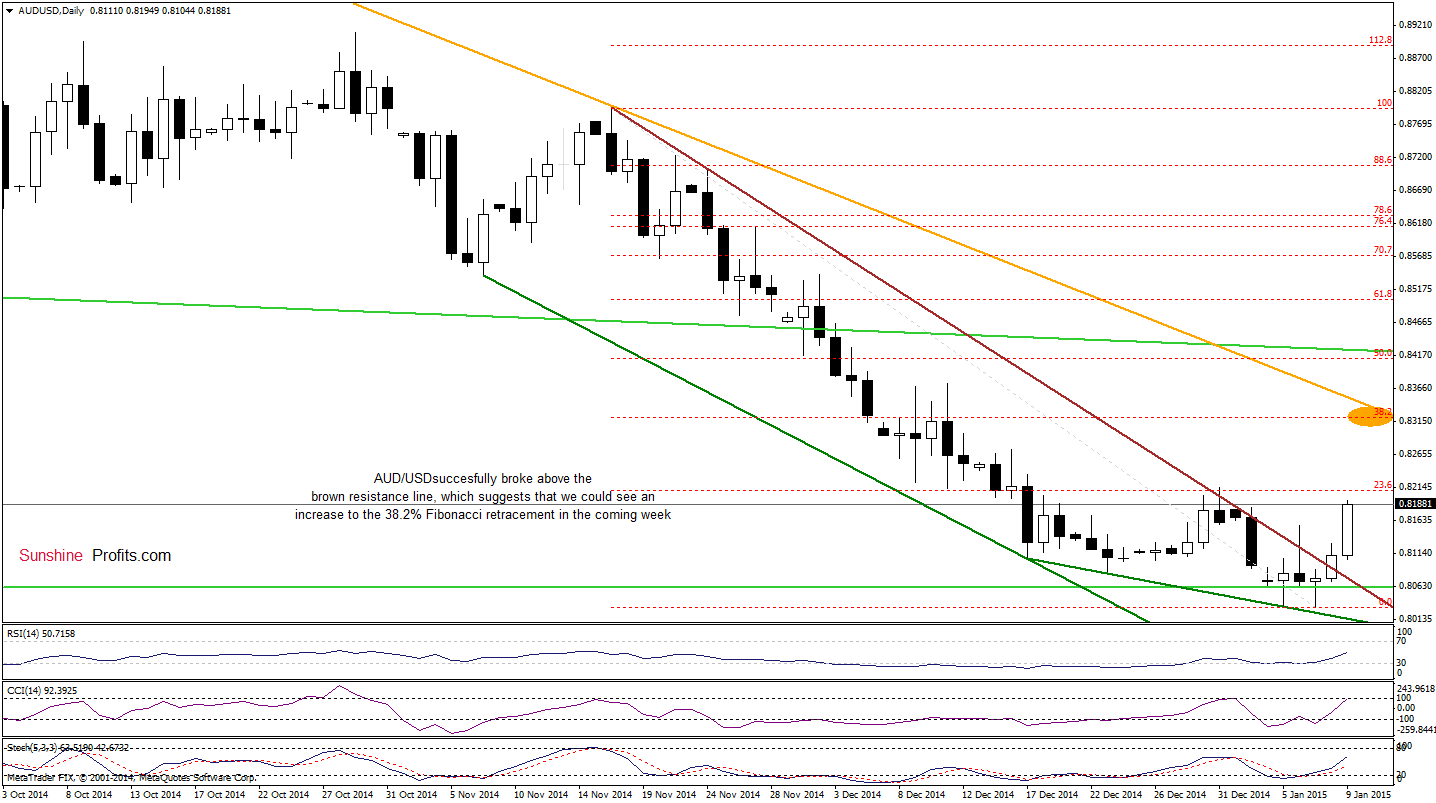
(…) the exchange rate reversed and invalidated the breakdown under the 2010 low (similarly to what we saw on Monday), which triggered further improvement and an increase above the brown resistance line (the upper line of the declining trend channel ) earlier today. Although this is a bullish signal that suggests further improvement, we should keep in mind that saw similar price action on Tuesday and also on Dec 31. Therefore, we think that this breakout will be more reliable if we see a daily close above the major resistance line. In this case, we’ll consider opening long positions.
On the daily chart, we see that currency bulls not only managed to close yesterday’s session above the major resistance line, but also pushed the pair higher, which suggests that a breakout above the recent high and the 23.6% Fibonacci retracement will trigger a rally to (at least) the 38.2% Fibonacci retracement and the orange declining resistance line in the coming week.
Very short-term outlook: bullish
Short-term outlook: mixed with bullish bias
MT outlook: mixed
LT outlook: mixed
Trading position (short-term; our opinion): Long positions with a stop-loss order at 0.7940 and an initial upside target at 0.8230 are justified from the risk/reward perspecive at the moment. We will keep you informed should anything change, or should we see a confirmation/invalidation of the above.
Thank you.
Nadia Simmons
Forex & Oil Trading Strategist
Przemyslaw Radomski, CFA
Founder, Editor-in-chief
Gold & Silver Trading Alerts
Forex Trading Alerts
Oil Investment Updates
Oil Trading Alerts

