
Earlier today, the common currency moved lower after the Ifo Institute for Economic Research showed that its German business climate index fell to a nine-month low of 108.0 this month, while analysts had expected a drop to 109.4 in July. Later in the day, the euro extended losses against the greenback after data showed that U.S. durable goods orders rose 0.7% last month (beating expectations for a 0.5% gain), while core durable goods orders (without transportation items) increased by 0.8% in the previous month, also beating expectations for a 0.6% gain. Because of these circumstances, EUR/USD dropped to its lowest level since November. What impact did these bullish numbers have on other currency pairs? Did they change their short-term outlook?
In our opinion the following forex trading positions are justified - summary:
- EUR/USD: short (stop-loss order: 1.3670)
- GBP/USD: none
- USD/JPY: none
- USD/CAD: none
- USD/CHF: none
- AUD/USD: none
EUR/USD
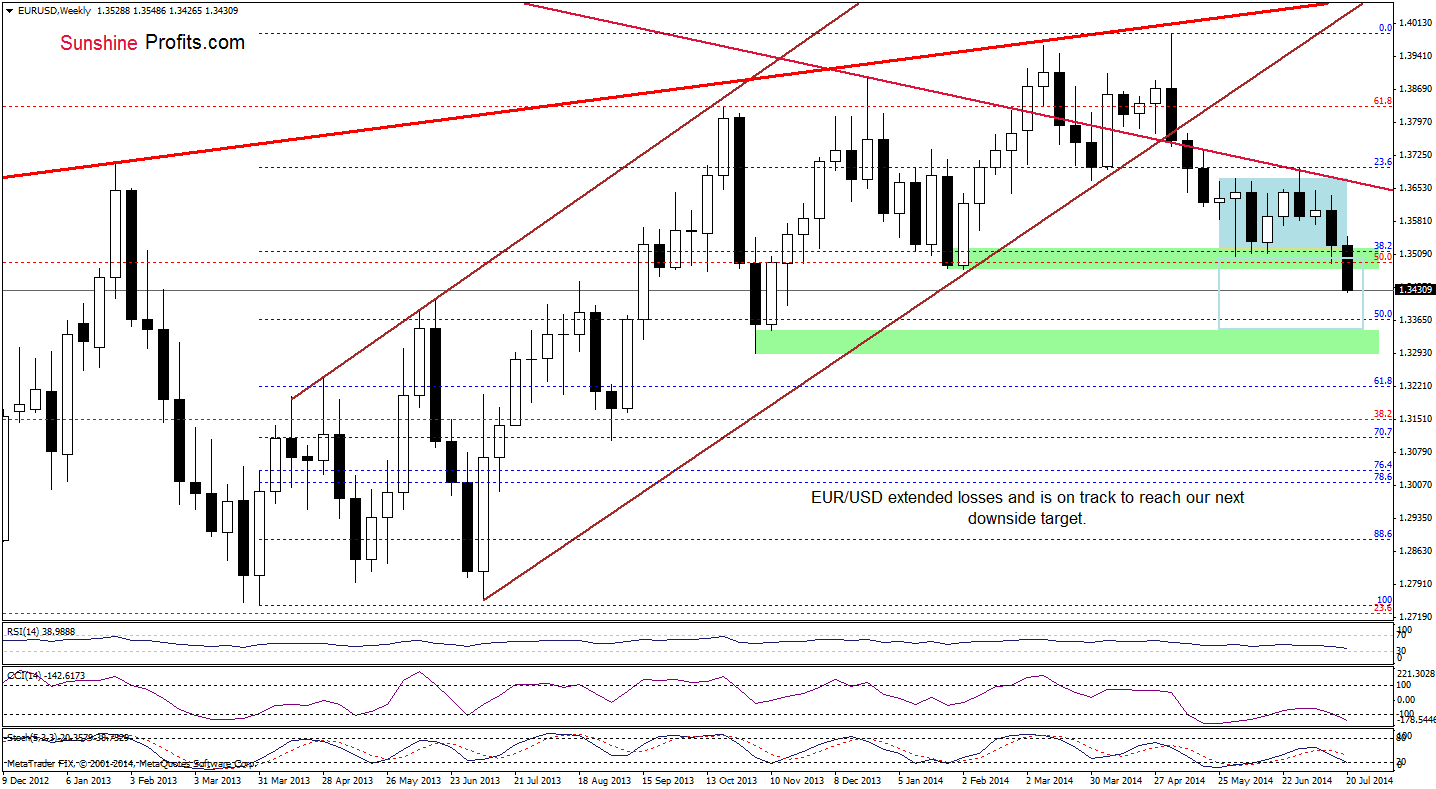
The situation in the medium-term has deteriorated as EUR/USD extended losses below the lower border of the consolidation and the February lows, which means that what we wrote on Wednesday is still up-to-date:
(…) we may see a drop even to around 1.3320, where the size of the downswing will correspond to the height of the consolidation.
Please keep in mind that before currency bears will be able to realize the above-mentioned scenario, they will have to break below the 50% Fibonacci retracement level (around 1.3367), which serves as the nearest medium-term support at the moment.
Once we know the medium-term outlook, let’s check the daily chart.
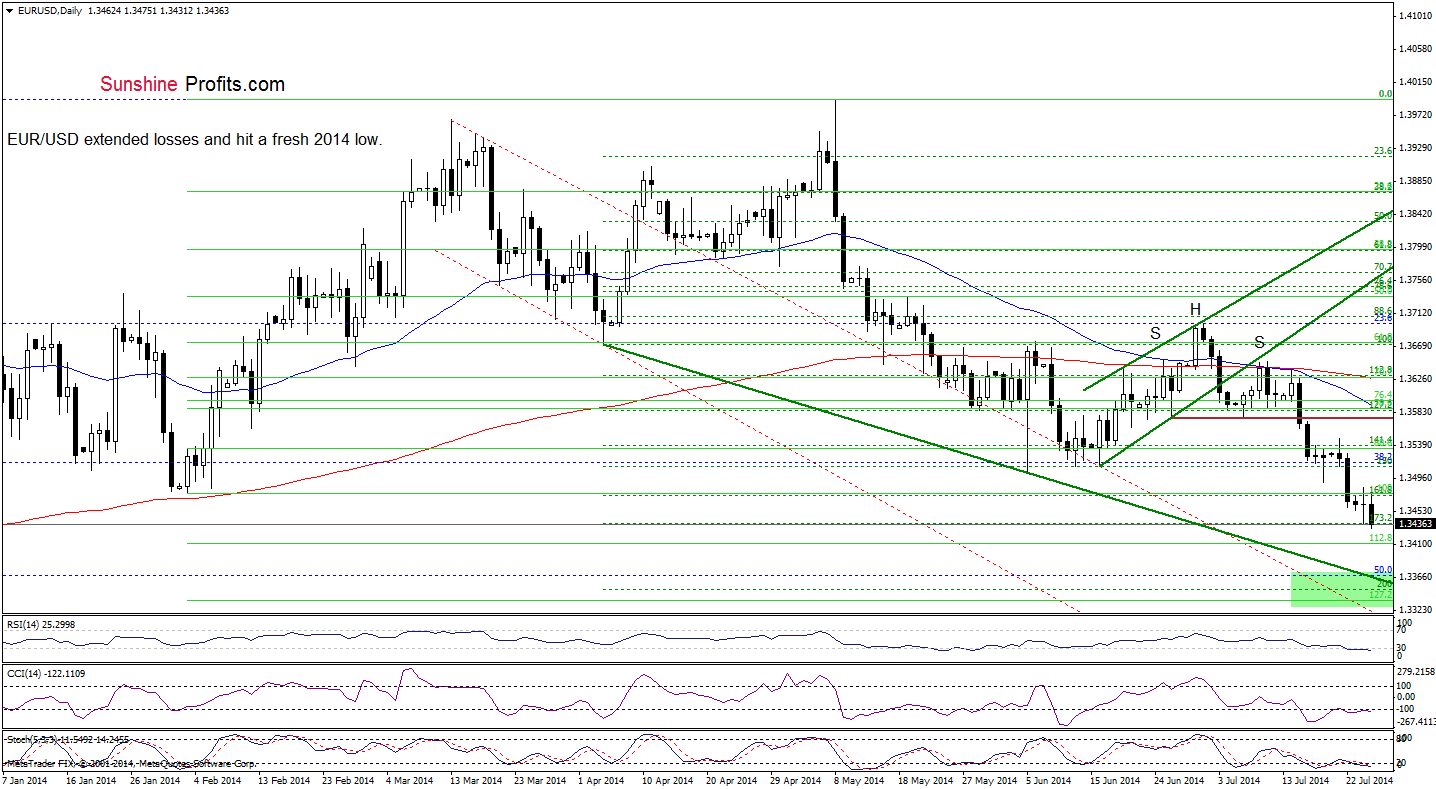
In our Forex Trading Alert posted on July 22, we wrote:
(…) as long as there are no buy signals and EUR/USD remains below the recent lows, another move lower is more likely than not. If this is the case, the nearest support will be around 1.3436 (the 173.2% Fibonacci extension based on the April-May rally), and if it is broken, the pair will likely drop to 1.3411, where the 112.8% Fibonacci extension (based on the entire Feb-May rally) is.
Yesterday, EUR/USD reached the first of our downside targets and rebounded slightly, but as we emphasized in our last commentary, the size of the upswing was too small to change the very short-term outlook. As it turned out earlier today, the pair extended losses and droped below the 173.2% Fibonacci extension, which suggests that our next downside target will be reached in the coming day (or days). If it holds, we’ll see a rebound to the February lows, but if it’s broken, the pair will drop to around 1.3335-1.3368, where the very strong support zone (created by the 50% Fibonacci retracement, the 200% Fibonacci extension based on the Apr-May increase, the 127.2% Fibonacci extension based on the entire Feb-Ma rally and the medium-term green support line) is.
Nevertheless, we should keep an eye on the current EUR/USD moves as the position of the indicators suggests that a pause or corrective upswing is just around the corner (on the short-term basis).
Very short-term outlook: bearish
Short-term outlook: bearish
MT outlook: bearish
LT outlook: bearish
Trading position (short-term): Small short positions (using half of the capital that one would normally use). Stop-loss order: 1.3670. The probability for the continuation of the decline is not extremely high, which is why we are not doubling the short position at the moment. We’ll do it, when the breakdown is confirmed. We will keep you informed should anything change, or should we see a confirmation/invalidation of the above.
GBP/USD
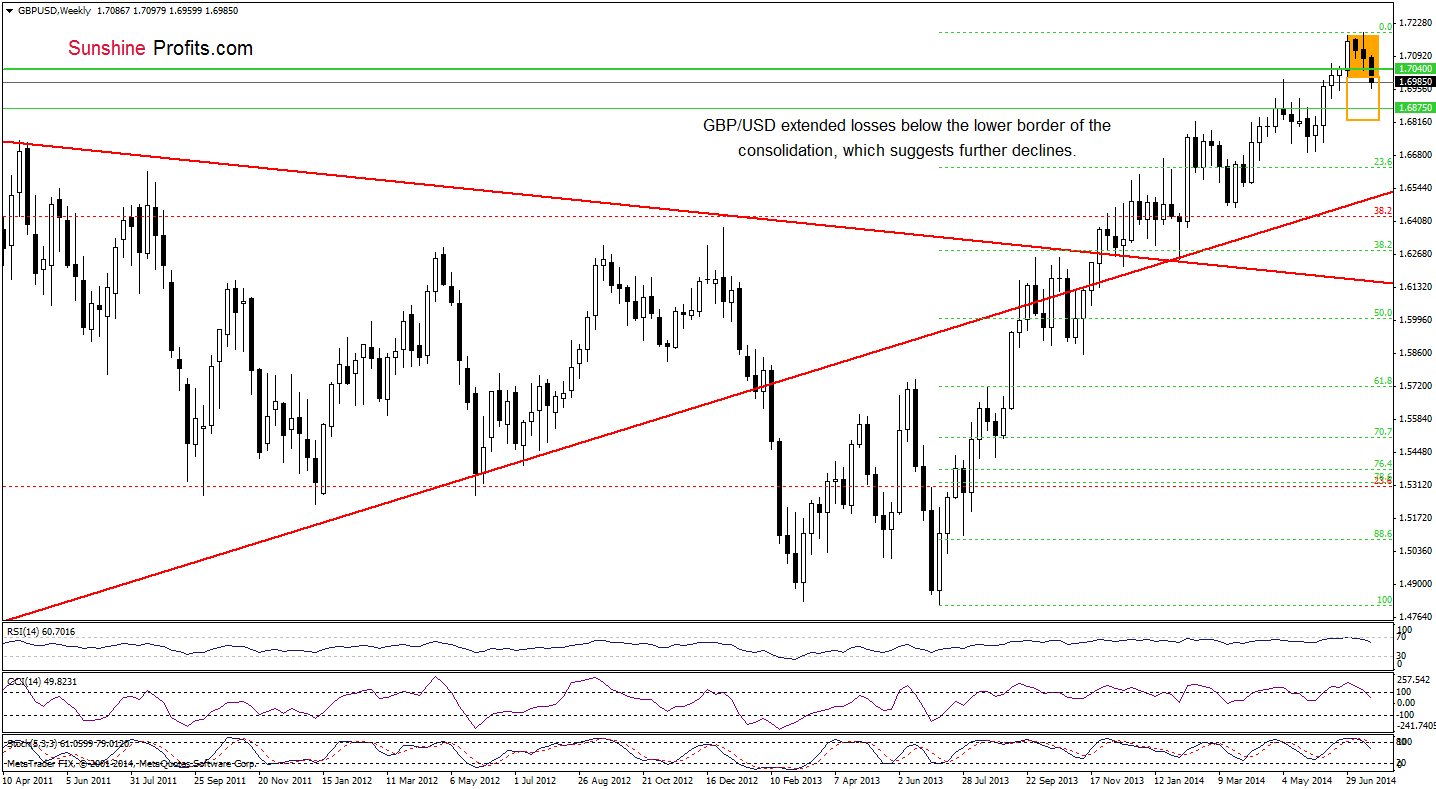
The medium-term situation didn’t changed much since our last commentary was posted, therefore, what we wrote yesterday is still valid:
(…) GBP/USD declined below the consolidation range. With this downswing, the exchange rate also dropped below the key support line created by the 2009 high, which is a bearish signal that suggests further deterioration. If the pair doesn’t invalidate the breakdown, we’ll see a drop to at least 1.6875, where the next horizontal support line (based on the Nov 2009 high) is. If it’s broken the next downside target will be the support zone created by the May and June lows (around 1.6692-1.6766).
What can we infer from the daily chart?
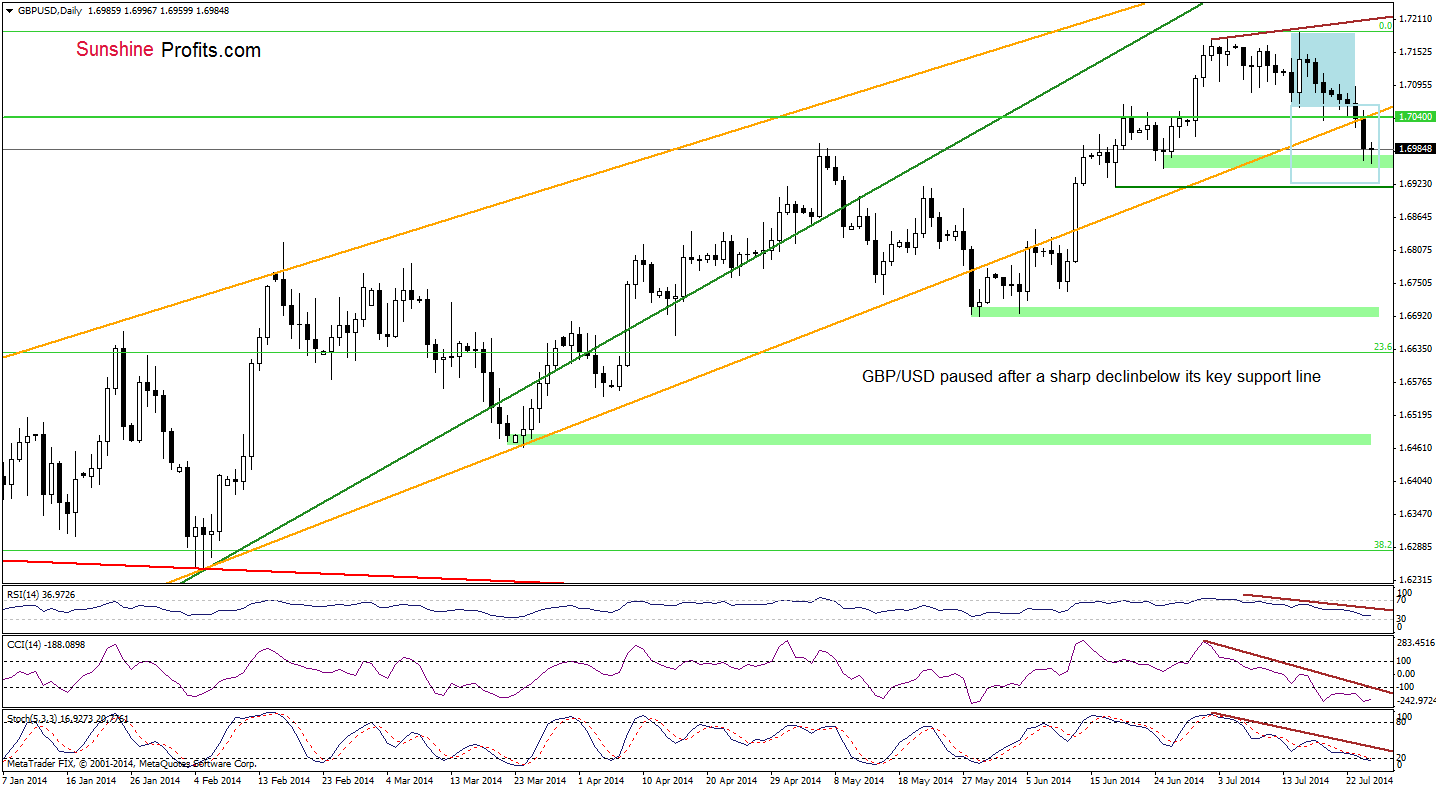
On Monday, we wrote the following:
(...) we are convinced that as long as there is no breakout/breakdown we won’t see another bigger move. So, where the pair head next? (…) In our opinion, the next move will be to the downside. (..) if the pair breaks below the lower border of the consolidation, the nearest downside target will be the 2009 high, and the next - the medium-term orange line. Please note that only if the pair breaks below these lines, we’ll see a correction to around June 18 low, where the size of a pullback will correspond to the height of the formation.
Yesterday, the pair broke below the medium-term orange line, which triggered a sharp decline that took the exchange rate to the support level created by the June 25 low. Although we may see a small rebound from here, we think that as long as GBP/USD remains below the key resistance line another attempt to reach the downside target is more likely than not.
Very short-term outlook: bearish
Short-term outlook: mixed with bearish bias
MT outlook: bearish
LT outlook: mixed
Trading position (short-term): In our opinion, no positions are justified from the risk/reward perspective. We will keep you informed should anything change, or should we see a confirmation/invalidation of the above.
USD/JPY
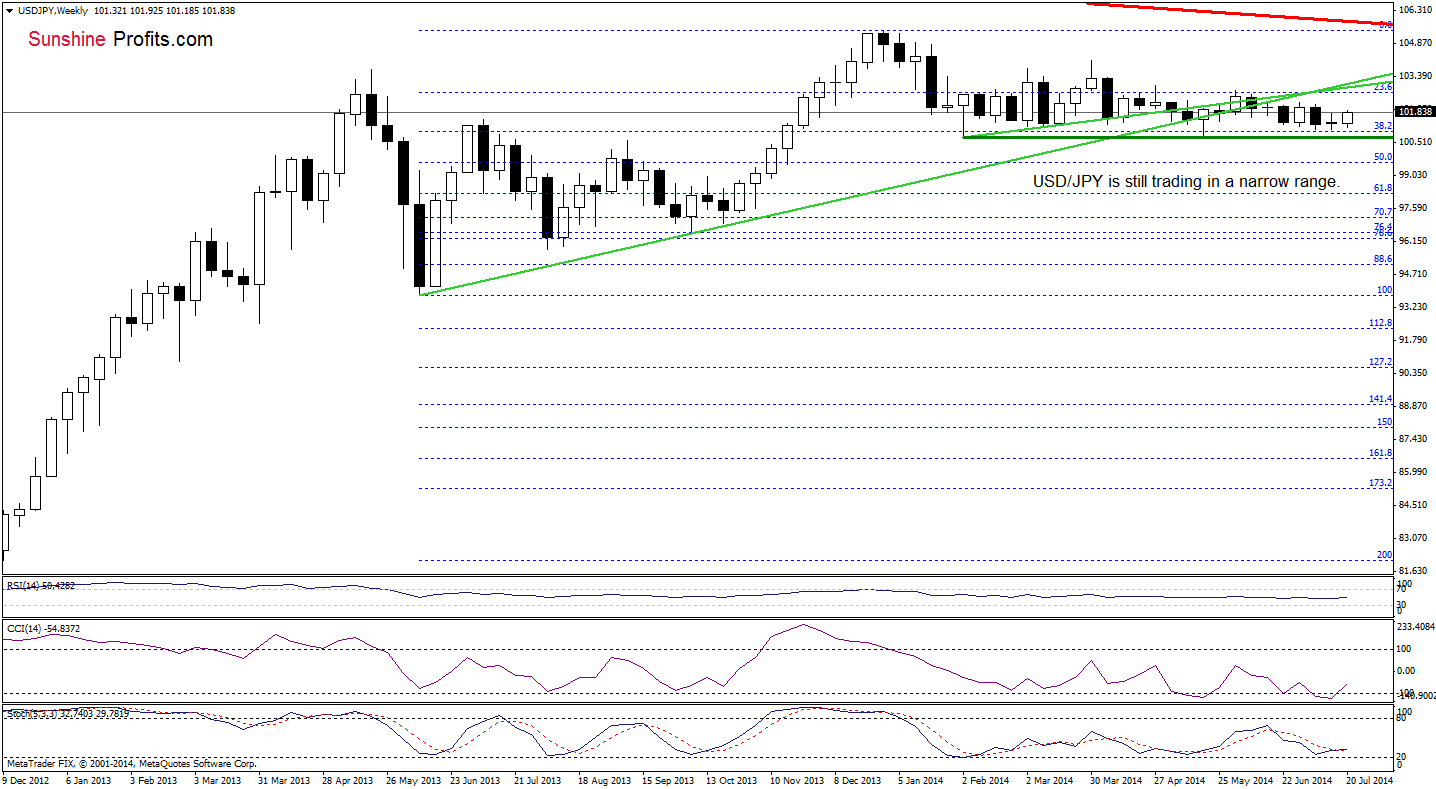
The medium-term picture remains unchanged as USD/JPY still remains between the medium-term support/resistance and the May low of 100.81. In our opinion, as long as there is no breakout above the nearest resistance (or breakdown below the major support) another sizable move is not likely to be seen.
Having say that, let’s find out what can we infer from the very short-term picture.
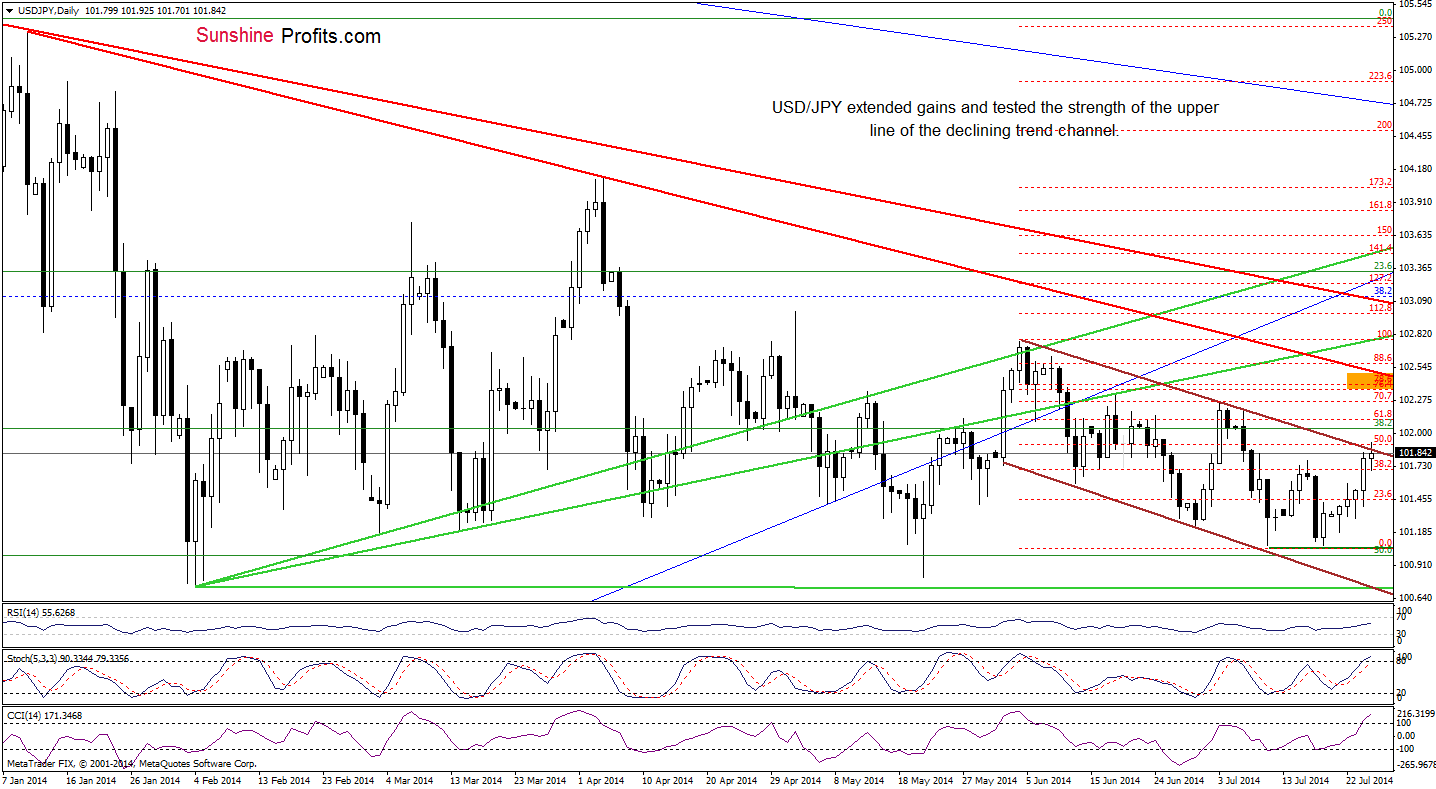
Looking at the above chart, we see that USD/JPY extended rally and reached the upper line of the declining trend channel, which is currently reinforced by the 50% Fibonacci retracement based in the entire June-July decline. On one hand, if this resistance area is broken, it will be a strong positive signal, which will push the pair to around recent highs. However, if it stops currency bulls we’ll see a pullback from here and the initial downside target will be yesterday’s low. At this point it’s worth noting that the CCI and Stochastic Oscillator are overbought, which suggests that the bearish scenario is more likely at the moment – especially if the indicators generate sell signals in the coming days.
Very short-term outlook: mixed with bearish bias
Short-term outlook: mixed
MT outlook: mixed
LT outlook: bearish
Trading position (short-term): In our opinion no positions are justified from the risk/reward perspective at the moment. We will keep you informed should anything change, or should we see a confirmation/invalidation of the above.
USD/CAD
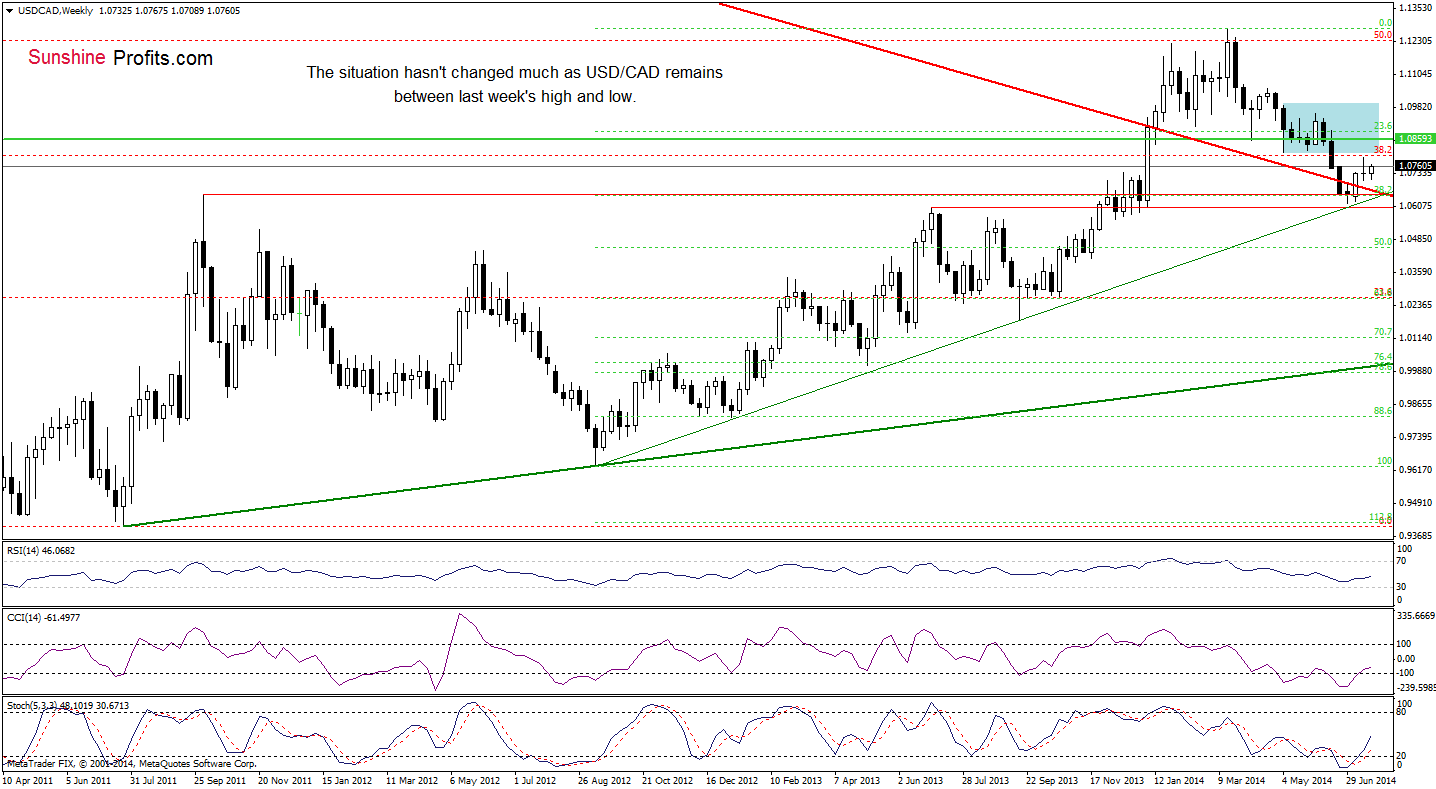
The medium-term picture hasn’t changed much this week as USD/CAD remains between last week’s low and high. Will the very short-term outlook give us clues about future moves? Let’s check the daily chart.
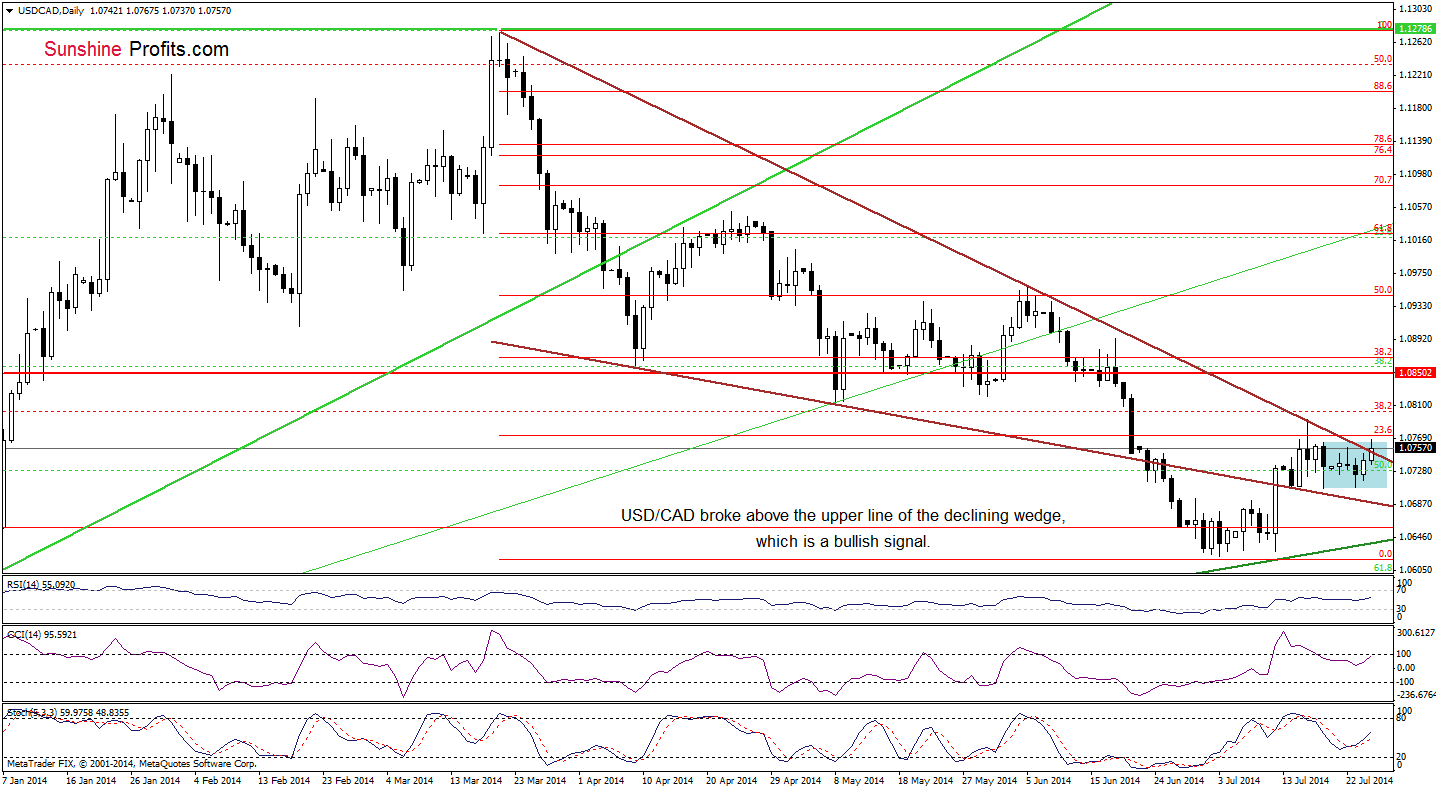
Looking at the above chart, we see that the situation in the very short term has improved as USD/CAD broke above the upper line of the declining wedge earlier today. This is a strong bullish signal, which (if is not invalidated) will likely trigger further improvement and an increase to the July high. If this resistance holds, the pair will reverse and come back to the upper line of the formation. However, if currency bulls do not give up and take their chance to push the pair higher, we’ll see an increase to the resistance zone created by the previous lows (around 1.0813-1.0821) or even to the 38.2% Fibonacci retracement based on the entire March-July decline at 1.0869. Please note that the current position of the indicators favors the bullish case at the moment.
Very short-term outlook: mixed with bullish bias
Short-term outlook: mixed
MT outlook: mixed
LT outlook: bearish
Trading position (short-term): In our opinion no positions are justified from the risk/reward perspective. We will keep you informed should anything change, or should we see a confirmation/invalidation of the above.
USD/CHF
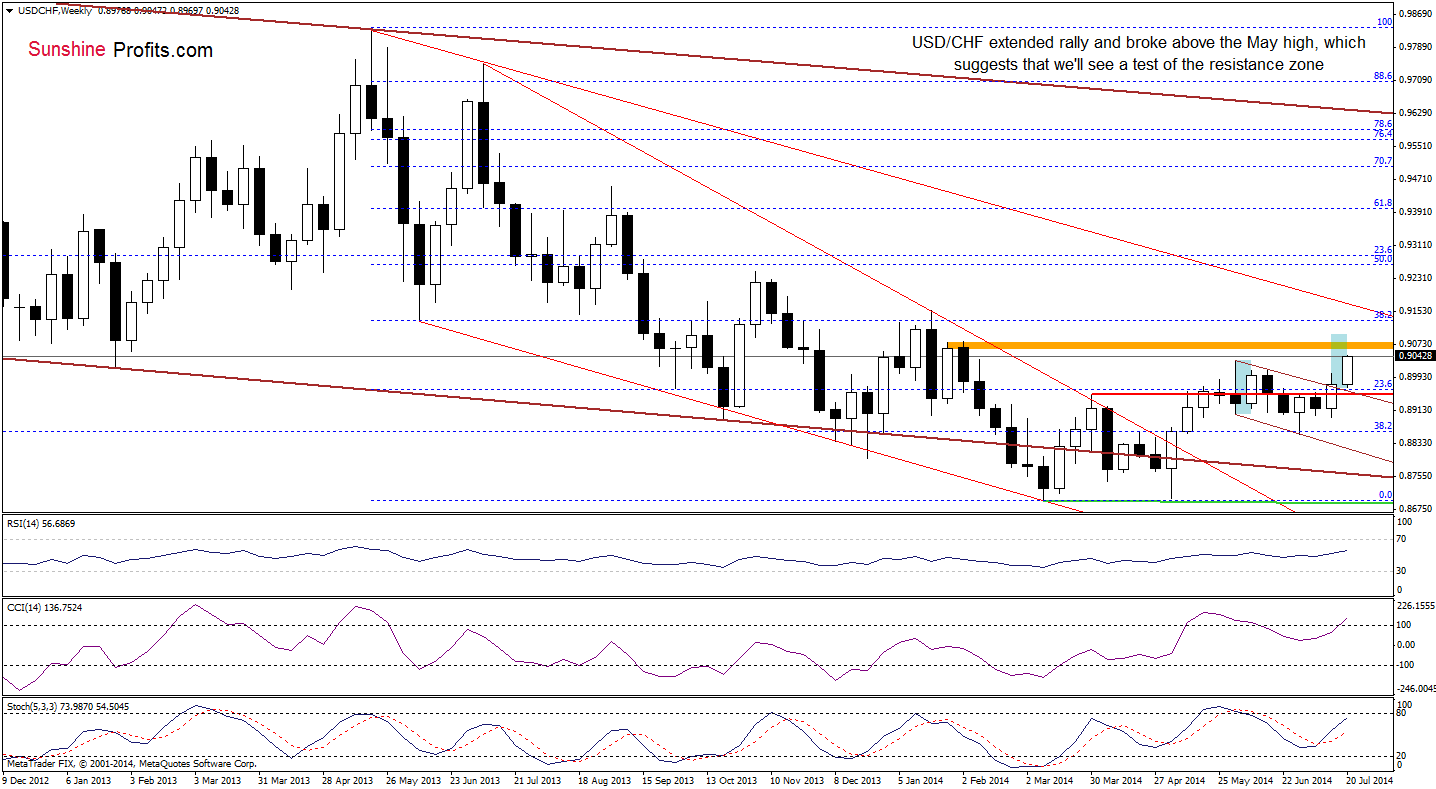
Last Friday, we wrote:
(…) USD/CHF came back above the April high and the 23.6% Fibonacci retracement. With this upswing, the pair also broke above the upper line of the declining trend channel, which suggests further improvement and an increase to at least recent highs.
As you see on the above chart, currency bulls not only realized the above-mentioned scenario, but also approached the pair to the next resistance zone (marked with orange) around 0.9080. If this area encourages forex traders to push the sell button, we’ll see a pullback and a test of the strength of the previously-broken upper line of the declining trend channel. However, taking into account the current position of the indicators (which still have space for further growths), it seems that the exchange rate will move higher and reach its next upside target (around 0.9091), which corresponds to the height of the trend channel.
Are there any short-term factors that could stop further improvement? Let’s check.
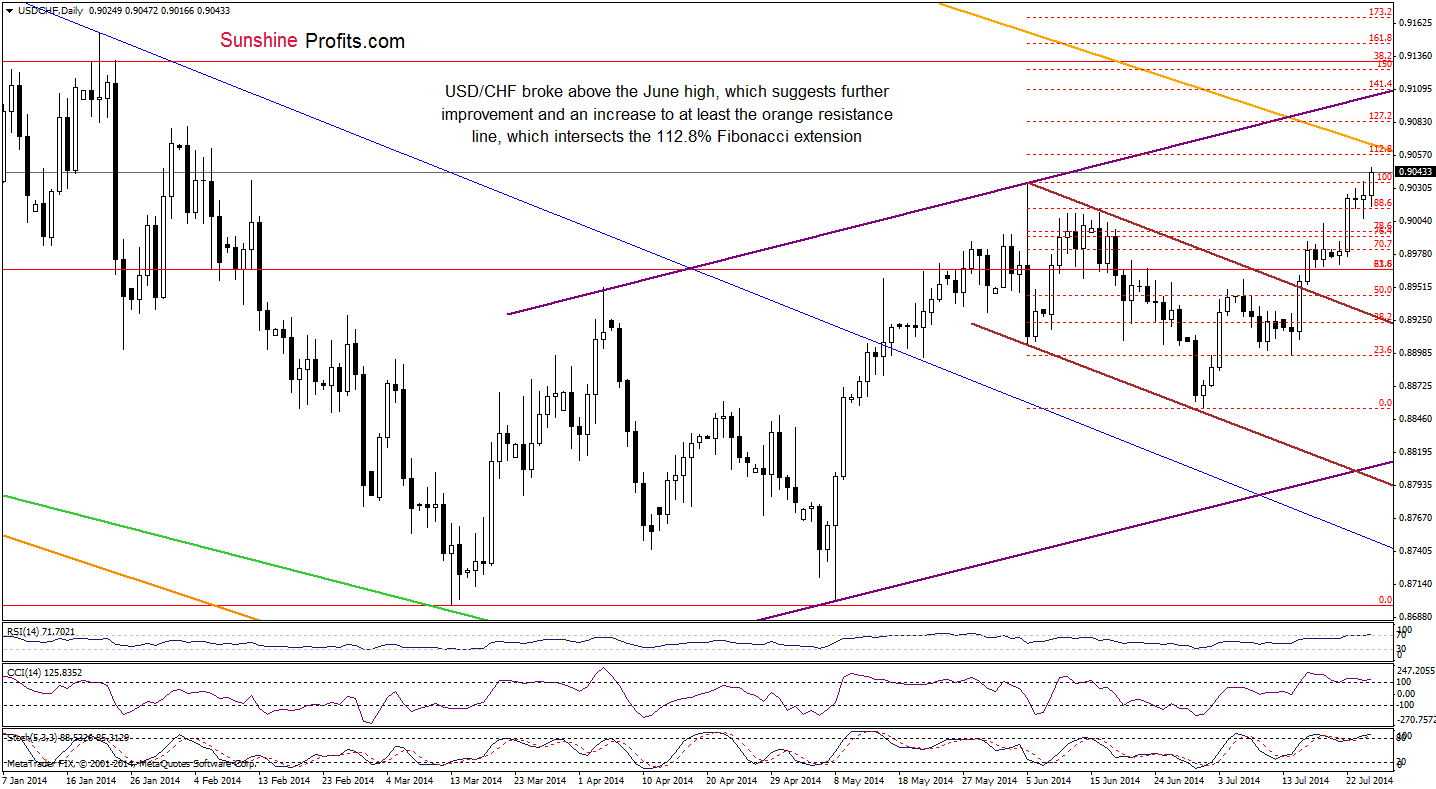
On the daily chart, we see that the pair successfully broke above the June high earlier today and it seems that there is nothing that could stop currency bulls before a test of the strength of the resistance zone created by the 112.8% Fibonacci extension and the declining resistance line (marked with orange and based on the May and July 2013 highs). Will the pair move above it? Looking at the current position of the indicators (the RSI climbed above the level of 70 and there are negative divergences between the CCI, Stochastic Oscillator and the exchange rate), the very short-term picture is not so bullish and suggests that a pause or correction is just around the corner.
Very short-term outlook: mixed
Short-term outlook: mixed
MT outlook: mixed with bullish bias
LT outlook: bearish
Trading position (short-term): In our opinion no positions are justified from the risk/reward perspective. We will keep you informed should anything change, or should we see a confirmation/invalidation of the above.
AUD/USD
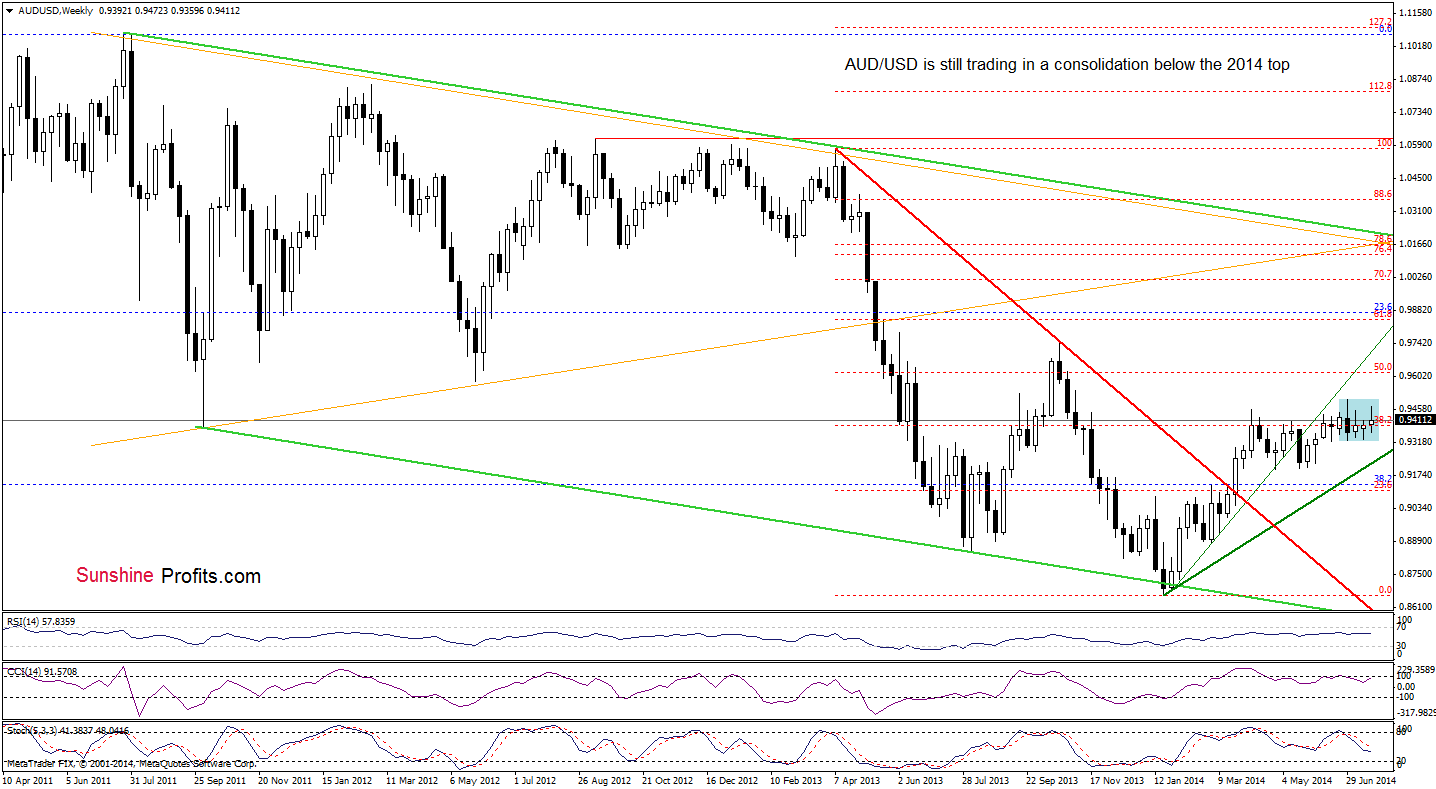
The medium-term outlook remains mixed as AUD/USD is still trading in a consolidation slightly below the 2014 high. Will the very short-term picture give us more clearly clues where the pair head next? Let’s check.
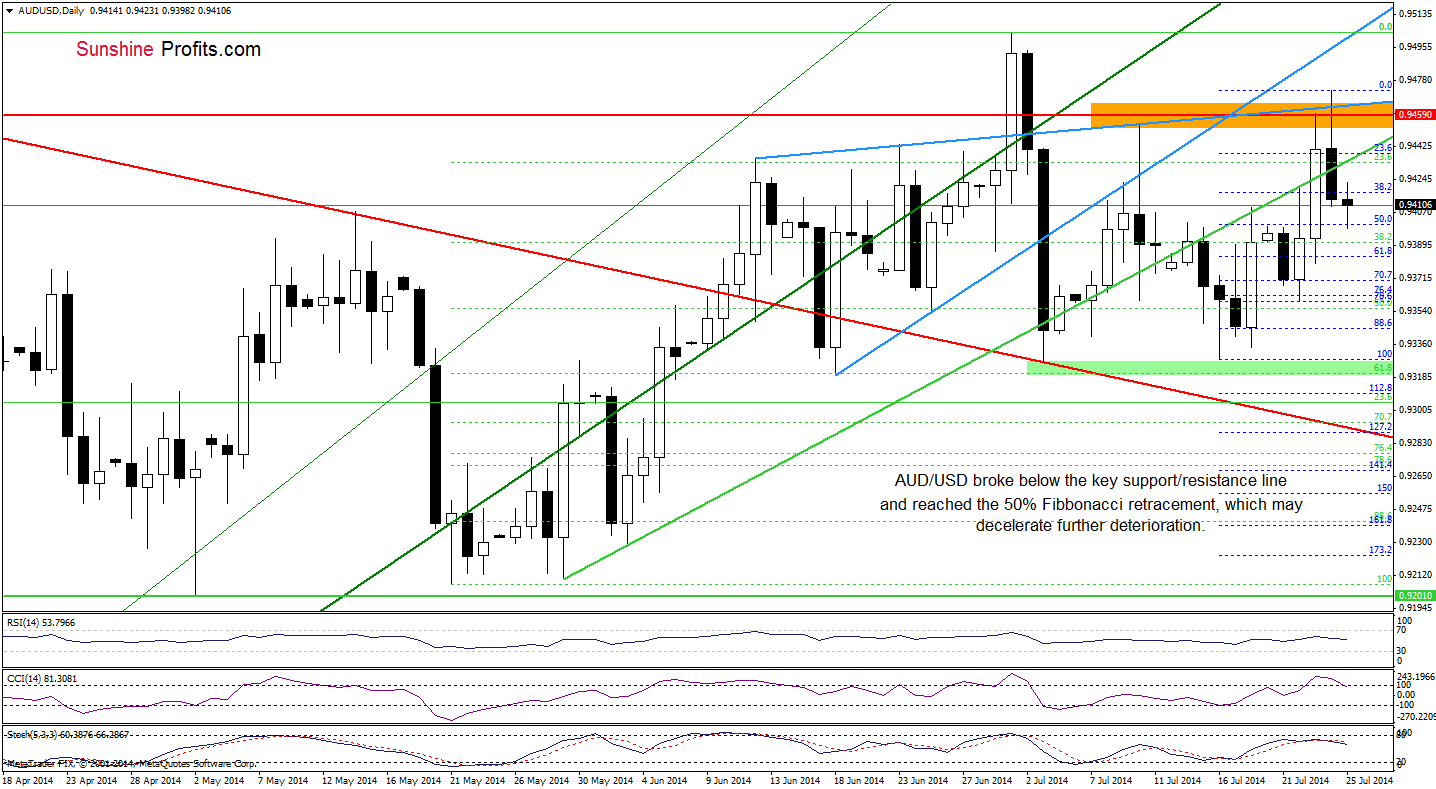
As you see on the daily chart, AUD/USD broke below the key support/resistance line yesterday, therefore our last commentary is still up-to-date:
(…) the exchange rate reached its downside target. (…) taking into account the current position of the indicators and an invalidation of the breakout, we think that the next move will be to the downside. If this is the case, the initial downside target will be around 0.9359, where the bottom of the previous correction is.
Very short-term outlook: mixed with bearish bias
Short-term outlook: mixed
MT outlook: mixed
LT outlook: bearish
Trading position (short-term): In our opinion, no positions are justified from the risk/reward perspective. We will keep you informed should anything change, or should we see a confirmation/invalidation of the above.
Thank you.
Nadia Simmons
Forex & Oil Trading Strategist
Przemyslaw Radomski, CFA
Founder, Editor-in-chief
Gold & Silver Trading Alerts
Forex Trading Alerts
Oil Investment Updates
Oil Trading Alerts

