
With the US presidential election drawing near, it is beginning to look like Mitt Romney may actually have a shot at the white House. This prompts gold investors to wonder how such an outcome might affect financial markets and especially gold. What if Mitt Romney wins? The election may impact everything from mortgage costs to the cost of financing the U.S. debt. Trillions are at stake.
The theory goes that Romney will replace Fed Chairman Ben Bernanke whose current term will expire in any case on January 2014. He has said as much. This might slow down the perpetual money printing machine, which would be a bearish signal for gold. It would add uncertainty to monetary policy and increase market volatility.
If Romney were to be elected, a front-runner for the Fed Chairman post is Glenn Hubbard, Dean of Columbia Business School and Romney's top economic adviser. Hubbard is not enamored with Bernanke's methods.
A new Fed Chairman might raise interest rates which would lead to a short-term economic contraction and increase the government's cost to service its debt. Only last month the Federal Reserve unveiled a program to keep interest rates at or near zero until 2015. If a new Fed chairman raises interest rates that would be a bearish signal for gold since it would make bonds more attractive to investors. Bernanke believes that rates should not be raised before the recovery is firmly “entrenched.” He says that removing the stimulus too early would tilt the economy back into recession. A more conservative Fed Chair appointed by Romney may think that recession is an acceptable cost for getting off the perpetual money printing train.
Both candidates talk about reducing the deficit, both want to extend tax cuts to avoid the upcoming fiscal cliff. Romney may talk about reducing spending by $5 trillion but has also called for a whopping $2 trillion increase in military spending. We better not hold our collective breaths for any debt reduction. If Romney were to actually follow through, this could be seen as a temporary negative signal for gold since it would make the dollar look more trustworthy.
Romney has stated that if elected president, he would label China a currency manipulator, which could lead to a trade war with the dollar being devalued versus the yuan. Romney believes that China's currency is being kept artificially low, to the detriment of U.S. manufacturers. “The president has a regular opportunity to label them as a currency manipulator but refuses to do so,” he said during the last debate, and repeated his pledge to do just that if he's elected.(Coincidence or not, China's yuan hit a multi-year high Wednesday against the dollar.) Any currency war, a decline in the dollar and a further discrediting of fiat currencies would be bullish for the price of gold.
Romney has talked about establishing a gold standard commission, which if put into effect, would be incredibly bullish for gold.
It is interesting to note that Romney owns gold, between $250,000 and $500,000 according to his disclosure.
We ran across a study by a precious metals analyst at HSBC, who found that the important factor for the price of gold is not the party affiliation of the U.S. president, but rather his popularity rating. Whether gold goes up or down after November 6 will not depend on whether a Democrat or a Republican is elected President. But rather, historical data shows that gold will go down in price whenever a US President is able to increase economic stability, decrease armed conflict, and avoid scandal. That makes a lot of sense (we didn't confirm that with our own calculations, though).
The analyst took the historic gold price data and tracked gold's price against the popularity of US presidents from the Vietnam War era to now and found that popularity and price are inversely correlated, meaning that the less popular the President, the higher the price of gold. When Americans are unhappy with their Commander in Chief, money flows into gold.
Here are a few quick examples. President Nixon in 1969-1974 had to face the Vietnam War, Watergate, and, ultimately, his own resignation. In that period, Gold increased from $42 an ounce on the day of his inauguration to $154 when he left office, a 267% gain.
President Carter (1977-1981) had to deal with the Iran hostage crisis and the 1979 crude oil crisis. Gold rose 322% from the first day of his term when the price was $133, to the last day, when it settled at $562. In fact, under Carter in January 1980 the Gold price reached its highest level ever in real terms at $850.
Popular presidents are bearish for gold. The price of gold declined from $562 to $406 under President Reagan (1981-1989.) During the Bill Clinton administration, a popular president by all accounts, gold hit an all-time low in real terms in the summer of 1999 of $253. After the Monica Lewinsky scandal in 1998, Clinton's popularity decreased and the price of gold increased.
The great hope that swelled in the hearts of Americans with the election in 2008 of President Obama correlated with low gold prices. That changed in April 2010, When Obama's approval ranking sank beneath 50% and the price of gold began its steady rise, which saw gold reach an all-time high of 1,895 in September 2011.
No matter who wins the election, we believe that gold and other precious metals should be a part of any investor's portfolio. The US economy is in trouble and there are no quick fixes. If spending levels are cut and the quantitative easing program derailed, the economy would contract bringing the U.S. to center stage in a Greek style tragedy. If, on the other hand, the U.S. continues its Keynesian policies, the country could face serious inflation. So it won't matter much to the price of gold if it is Obama or Romney who occupy the White House this January. Deficit spending and money printing will ultimately continue like there is no tomorrow even though gold could dip if Romney does indeed win. If Obama wins, we will likely see a quick rally in the precious metals in the short term. The long-term picture will remain bullish in either case.
To see how precious metals are behaving just before the all-important U.S. elections, let's begin this week's technical part with the analysis of the US Dollar Index. We will start with the very long-term chart (charts courtesy by http://stockcharts.com.)
USD Index
Comments made in last week's Premium Update are still up to date:
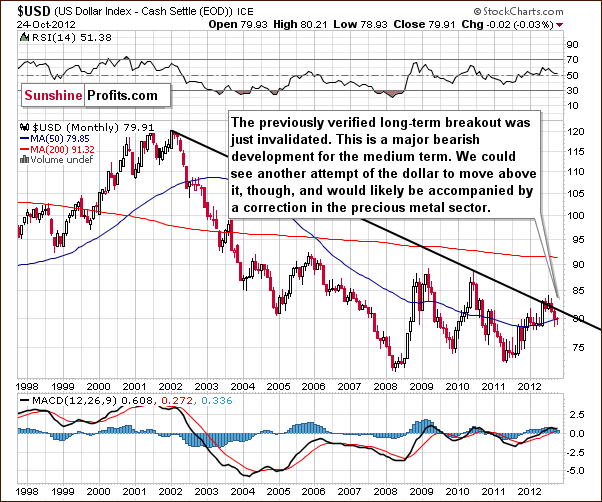
The picture remains bearish here. This chart provides no implications for the short term whatsoever as declines could continue or a new rally could begin based on what we see here. The upcoming rally would be likely small because the declining resistance line would probably stop it. However, what's small on the long-term chart can be average on the medium-term one and significant from the short-term perspective, and this is the case right now.
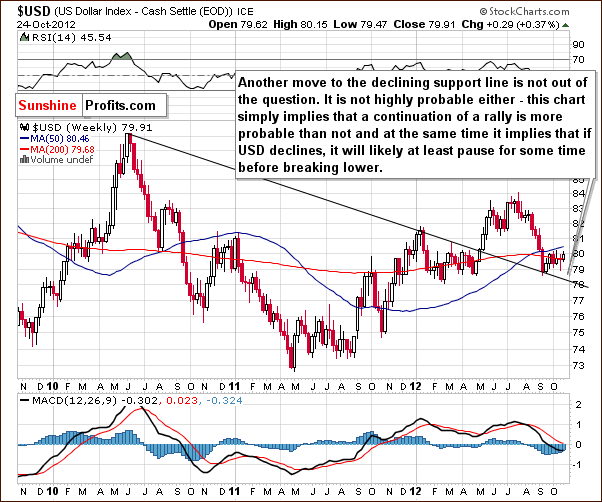
In the medium-term USD Index chart, we see the possibility of another retest of the declining support line. While lower index values are still possible here, it already seems that the consolidation period has ended and the USD Index is ready to move higher. Moves to the upside appear to be more likely than not. These implications are based on this chart alone however.
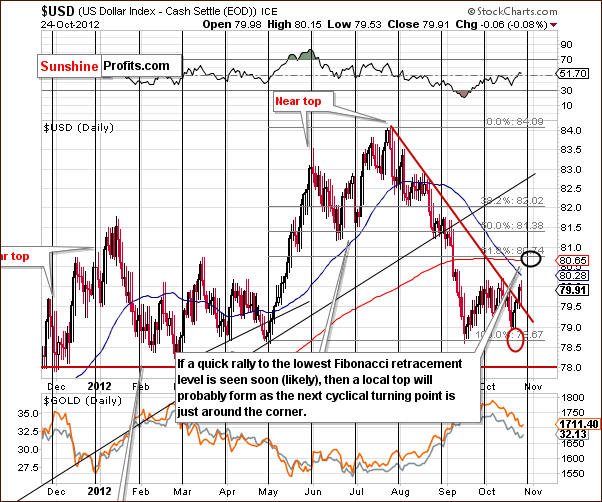
Turning now to the short-term USD Index chart, this is where we find the key details concerning the USD Index this week. We have seen a breakout here and it has been verified by three consecutive daily closes above the declining resistance line. The index now appears likely to move higher. Please keep in mind, however, that the cyclical turning point will soon be reached.
Since the USD Index has been moving higher of late, the cyclical turning point will likely coincide with a local top. It seems this will be fairly soon, likely at the end of October or early in November. There appears to be a good chance that the Index could move to the lowest Fibonacci retracement level (80.74), which is slightly above Thursday’s close. While a move a bit higher to the 50% retracement level (81.38) would not surprise us, a move above this next level is unlikely. This is because it would invalidate the very long-term declining resistance line, something which is highly unlikely...
Summing up, the very short-term picture remains bullish here but beyond that the situation is rather unclear. A local top will likely form within the next two weeks (more likely next week), but it is too early to discuss the next moves for the dollar. How soon the top is formed as well as how high the index goes before reversing are both critical pieces of information which are missing at this time. What we have now, however, seems enough to form a strategy for precious metals, because their charts provide other important pieces for this puzzle.
General Stock Market
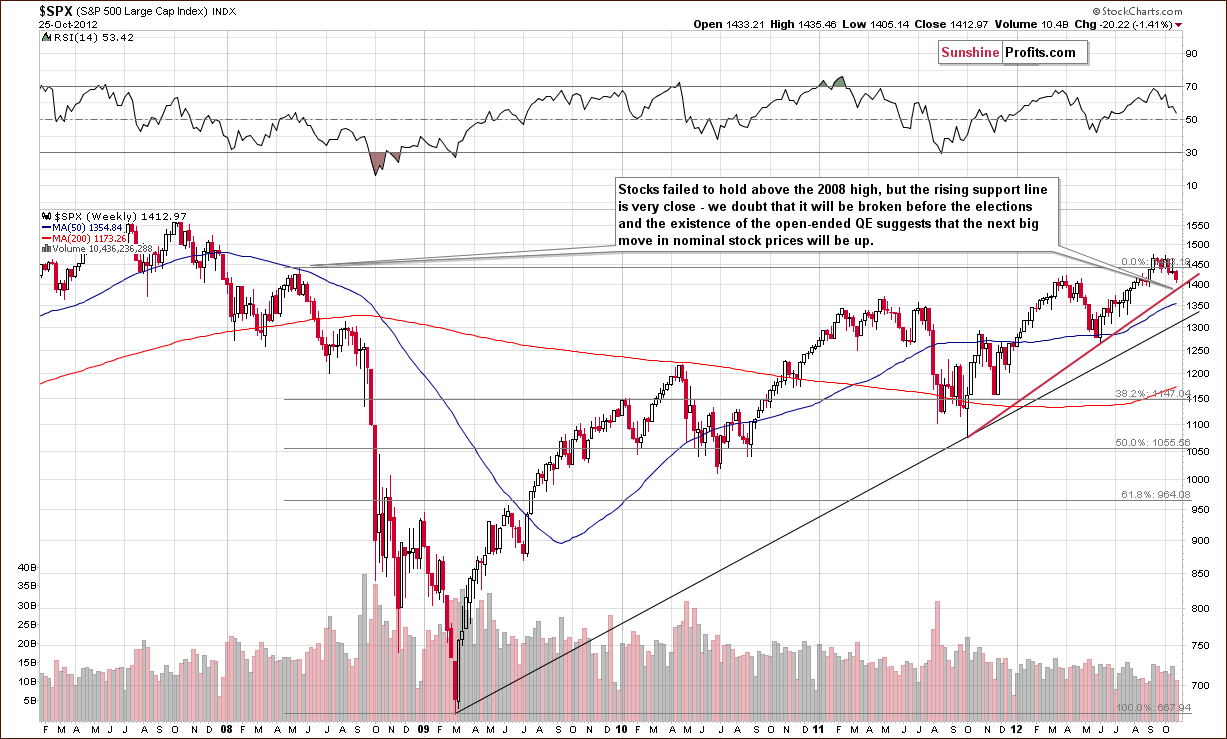
The long-term S&P 500 Index chart is our only stock chart this week because we think that it really covers the current technical picture. While stocks have failed to hold above their 2008 highs, they have not declined below the rising support line (shown in red). It was created by the 2011 and 2012 lows, which means that it is a fairly strong support line and likely to hold at least until Election Day. In short, the short-term downside potential appears very limited here and our target level is slightly below $1,400 for the S&P 500.
What happens to the stock market after the elections will to a considerable extent depend on who wins. Some technical signs could be seen right before the elections, so we will monitor the situation closely.
Correlation Matrix
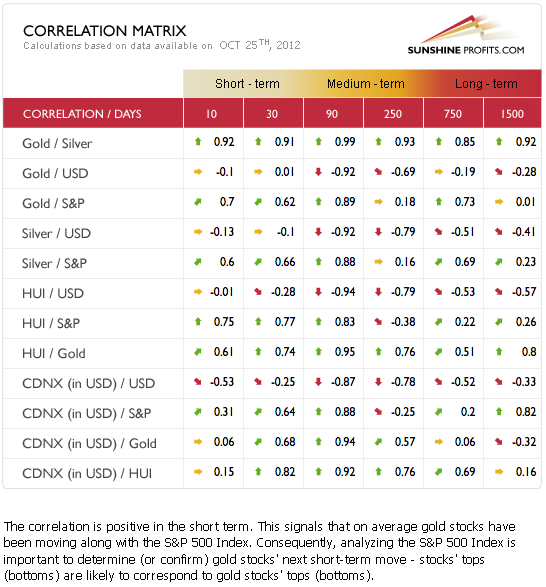
The Correlation Matrix is a tool which we have developed to analyze the impact of the currency markets and the general stock market upon the precious metals sector. It's interesting to note this week that the recent short-term correlations between the precious metals and the USD Index have been almost non-existent. The previous significant relationship is now neutral as the precious metals' prices actually declined recently without a rally in the USD Index.
This is not a sign of strength but rather a sign of weakness in the precious metals themselves. Their correlation with the general stock market is still fairly strong, so it seems that the limited downside potential in the stock market likely applies to the metals as well. We will soon see that the individual gold, silver and mining stock analyses will confirm this.
Gold
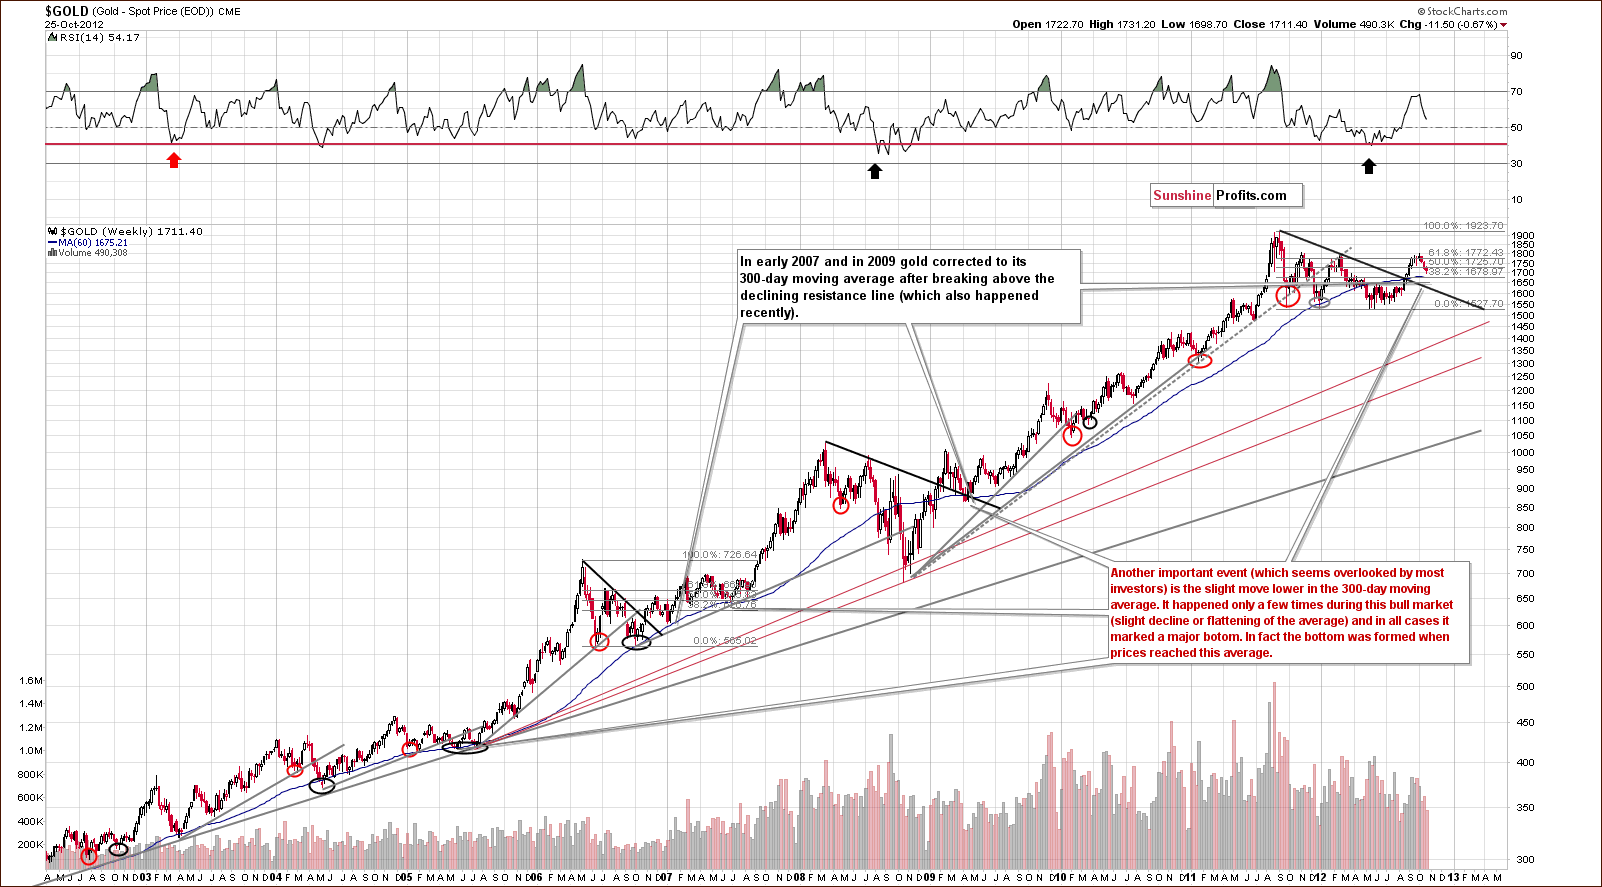
In gold's very long-term chart, we see further declines in gold's price and an additional interesting phenomenon. The 300-day moving average has declined slightly and this has only been seen a few times in this bull market. On each occasion, lower prices never followed on a medium-term basis meaning a major bottom formed. Any declines to or slightly below this average (when it declined) were short-lived.
The fact that gold's price is about to reach this line and has been declining recently is a major bullish factor. It seems that the period of declining prices will end quite soon.
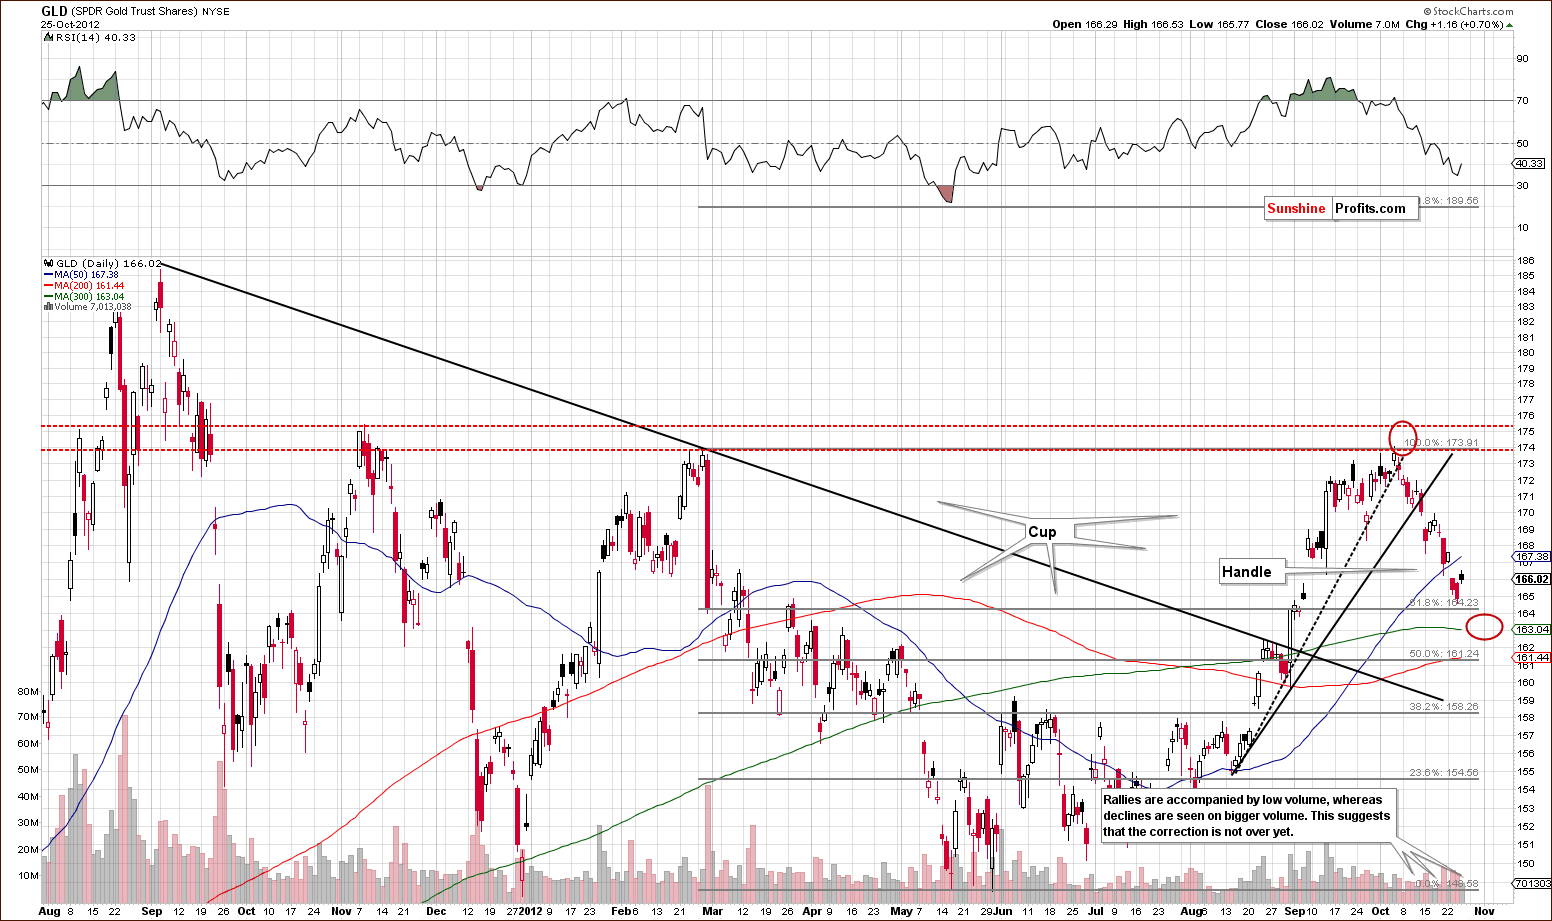
Analysis of the short term GLD ETF chart points to probable additional declines in the $30 range ($3 in case of the GLD ETF) for the yellow metal before the trend reverses. Once the bottom is formed (more than likely) close to the 300-day moving average, we could see stocks reaching their corresponding support line and the USD Index reaching the lowest of its Fibonacci retracement levels. (Both of these topics were discussed previously.)
Some negative signs have been seen in the GLD ETF as high volume has accompanied downswings in price and moves to the upside have been seen on low volume levels. The technical picture on a short-term basis is negative but it does seem a turnaround will happen possibly as early as next week. The cup-and-handle pattern indicates a continuation of the rally after the current correction is completed.
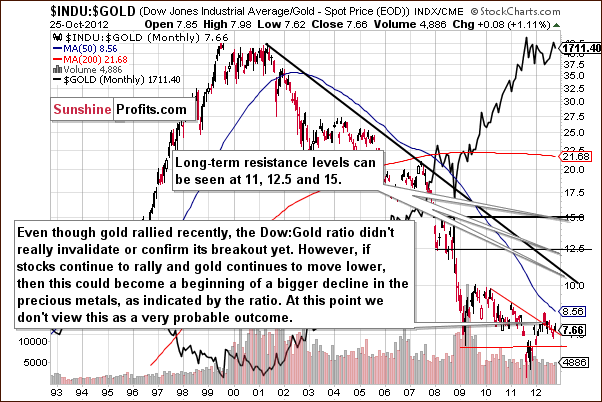
In this week's Dow to gold ratio chart, we see more of what we described in last week's Premium Update:
We once again see the ratio right at a declining support/resistance line. The move above this declining resistance line has not been confirmed or invalidated as the ratio has been moving around this line for a few months now.
If stocks rally, as their charts indicate and gold corrects significantly, the ratio will move higher. If the ratio moves higher, and this breakout is confirmed, this could very well lead to more strength in stocks relative to gold. It also could lead to bigger declines in gold. At this time, we bring this up only as a possibility, not something that is very probable. We will continue to watch this closely and report to you accordingly.
We had “concerns” but no proof of a decline or a rally. This is still the case and we continue to monitor the situation.
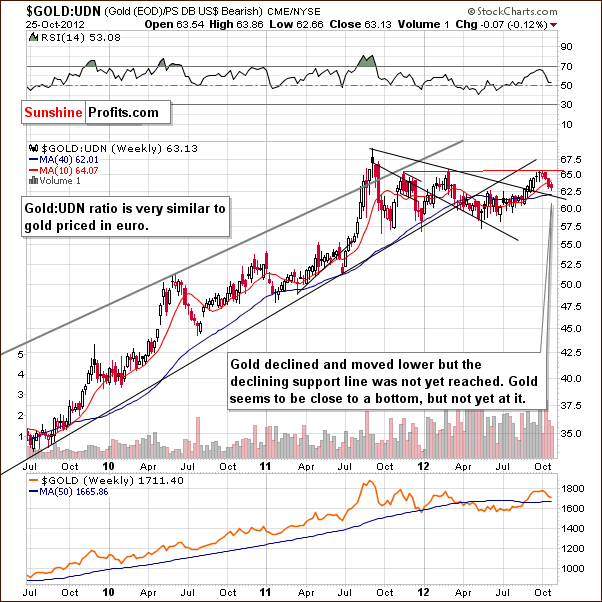
In this week's chart of gold from the non-USD perspective, we see some declines but not enough to reach the key support level. The index is less that 1% lower than it was a week ago and it seems that the declines are almost over but not just yet.
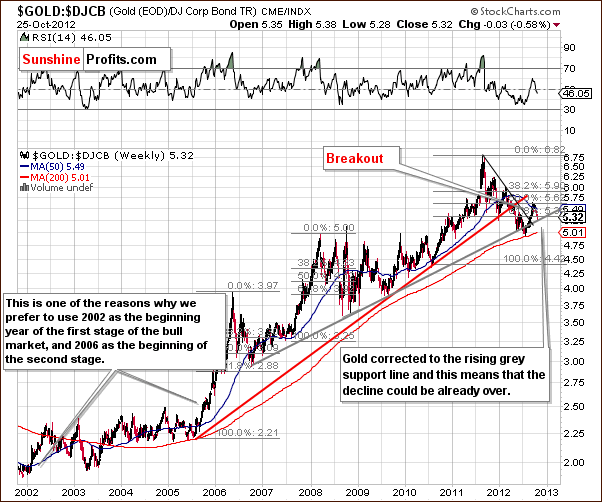
In this week's gold to bonds ratio chart, we see a move to the rising (grey) support line but this development is not that significant. The reason is that the gold charts seen earlier are more important. Consequently, another move here to the rising 200-week moving average might be needed, a retest of this support line. The fact that the ratio moved to the rising support line is bullish but only slightly. This very support line failed to hold just a few months ago.
Summing up, the declines in price appear to be almost over for the yellow metal but another $30 or so seem to be in the cards ($1,680 seems to be the most probable price target level for gold). This is confirmed by analysis of volume levels.
Silver
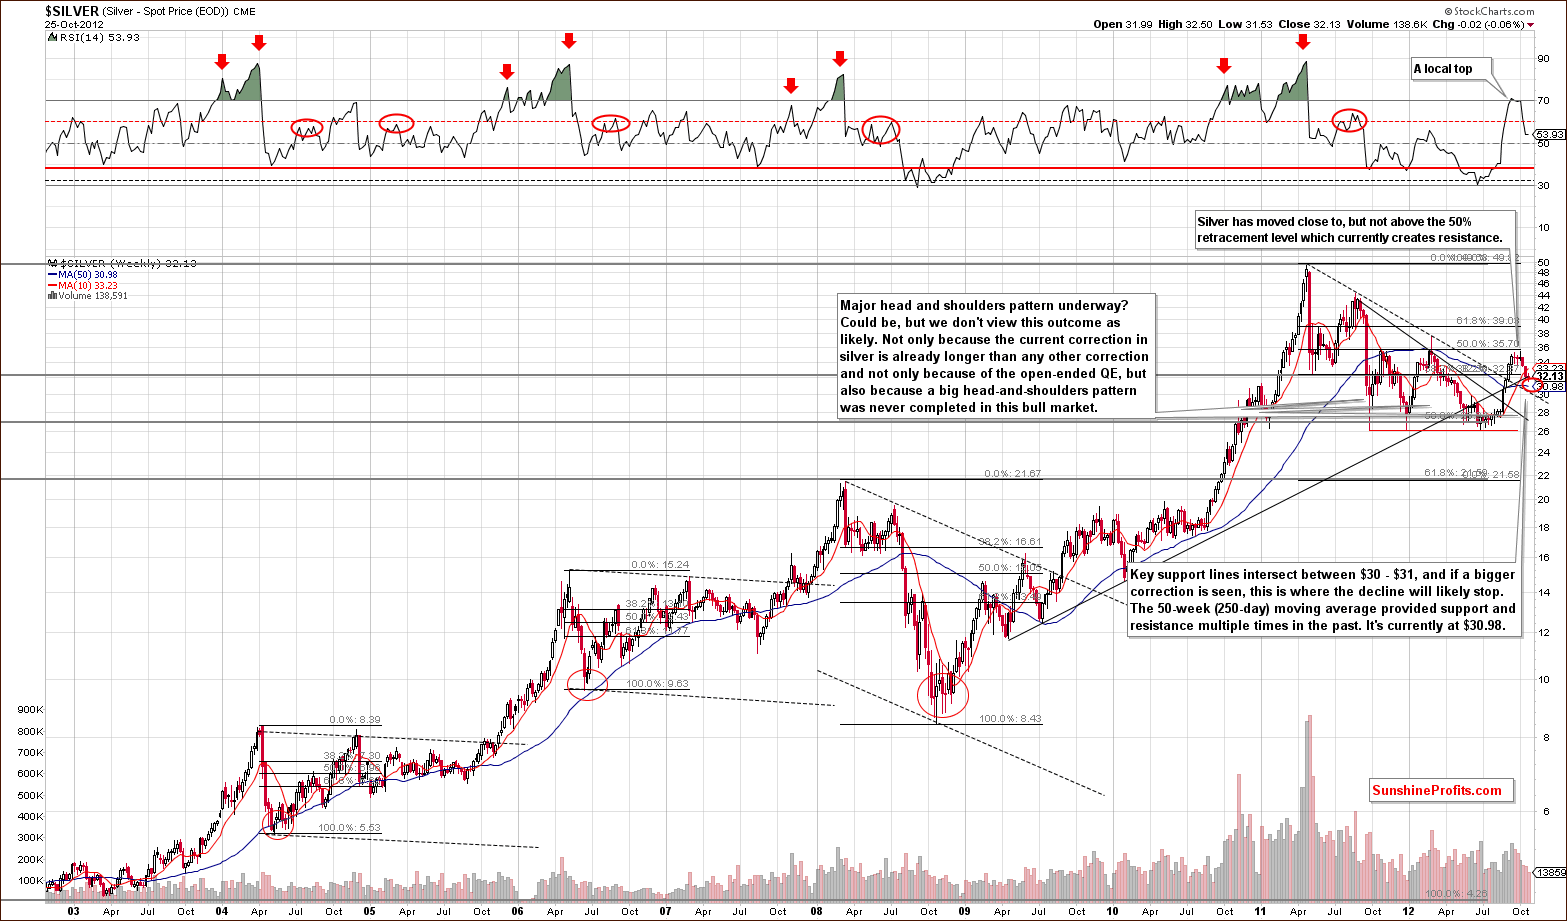
In the very long-term chart for silver this week, we see a continuation of the correction and it appears that an addition decline of $1 is likely. $31 or slightly lower seems to be where the next bottom will form. There is one more support line which we did not mention last week, the 50-week or 250-day moving average. It is the blue slope in the chart and has served as support many times in the past. Also, the two previous local tops were formed when this line was reached and provided resistance.
The 50-week moving average is now at $30.98, so it is very much in our target range for the current decline. Volume levels in the past few weeks have been lower as compared to the preceding rally, so the technical picture looks positive for the medium term. An additional $1 (or bigger) decline will likely be seen before the next bottom forms, though.
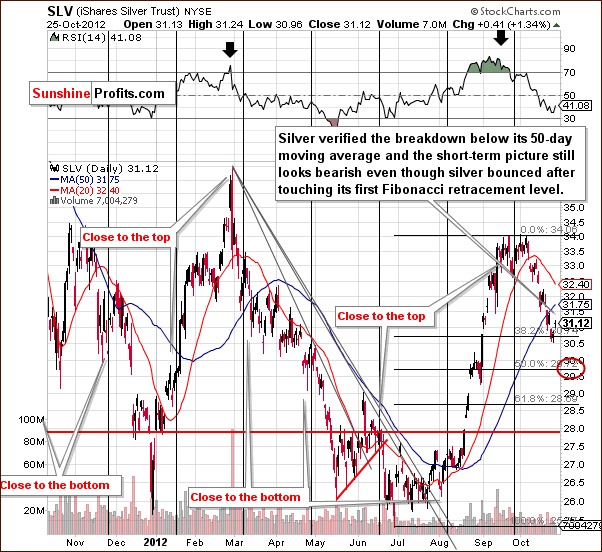
In the short-term SLV ETF chart, we see a bounce after prices touched the first Fibonacci retracement level. The move to the upside was quite small, however, and with low volume levels was not very important. It could be just a verification of a breakdown below the 50-day (blue slope) moving average. It seems that lower price levels will be seen here before declines end. This is very similar to what was seen in our analysis of gold. Silver will likely see lower prices but probably within our $30 to $31 target level range – probably between $29 and $30 in case of the SLV ETF.
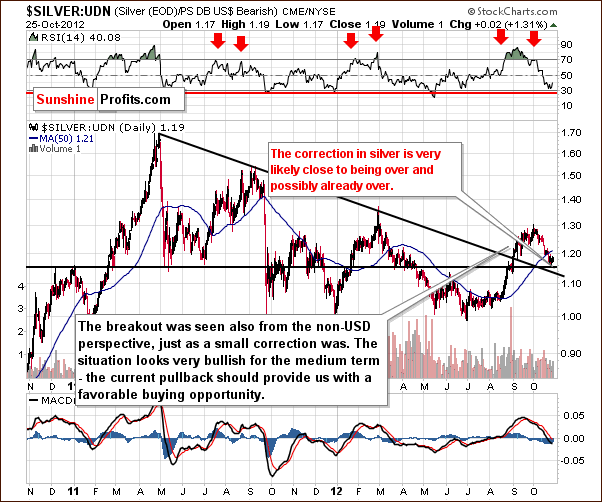
In the chart of silver's price from a non-USD perspective, indications this week are that the decline might (!) be over. The horizontal support line has been reached but the declining support line has not (on the other hand it would have been reached if we created the support line based on 2011 high and the 2012 high). This chart is not really clear and says little more than declines are over or will be over soon.
Summing up, silver appears to be approaching its local bottom. Its price will probably decline another $1 or more before beginning its next rally.
Palladium
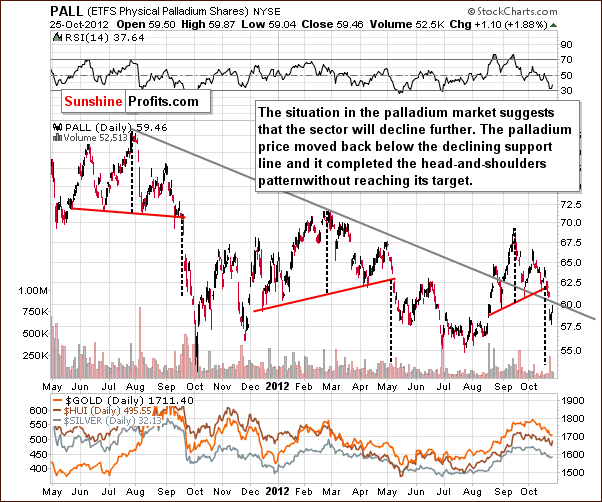
This week, we saw interesting developments on the palladium price chart, so we're including it in today's report. In this week's chart for palladium, we see further bearish indications that declines in precious metals prices are not yet over. A head-and-shoulders pattern completed here recently but palladium has not moved close to its target level yet. Target levels are based upon the size of the head in the pattern and these patterns are usually quite reliable for this metal (as opposed to what we see on the silver market where significant head-and-shoulder patterns are practically nonexistent). The implications here are bearish for the whole precious metals sector.
Gold & Silver Mining Stocks
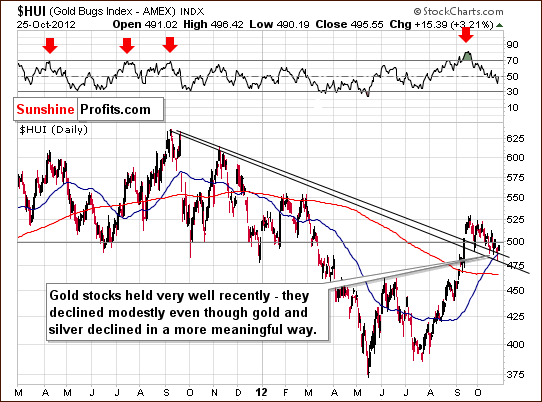
In this week's medium-term HUI Index chart we once again see that prices have held very well. Wednesday's decline was followed by a strong pullback on Thursday. The index is now slightly below 500 and above the declining support line created by prior tops. All-in-all, it seems that once this period of decline is over, gold stocks will continue to outperform the underlying metal as has been the case in recent weeks.
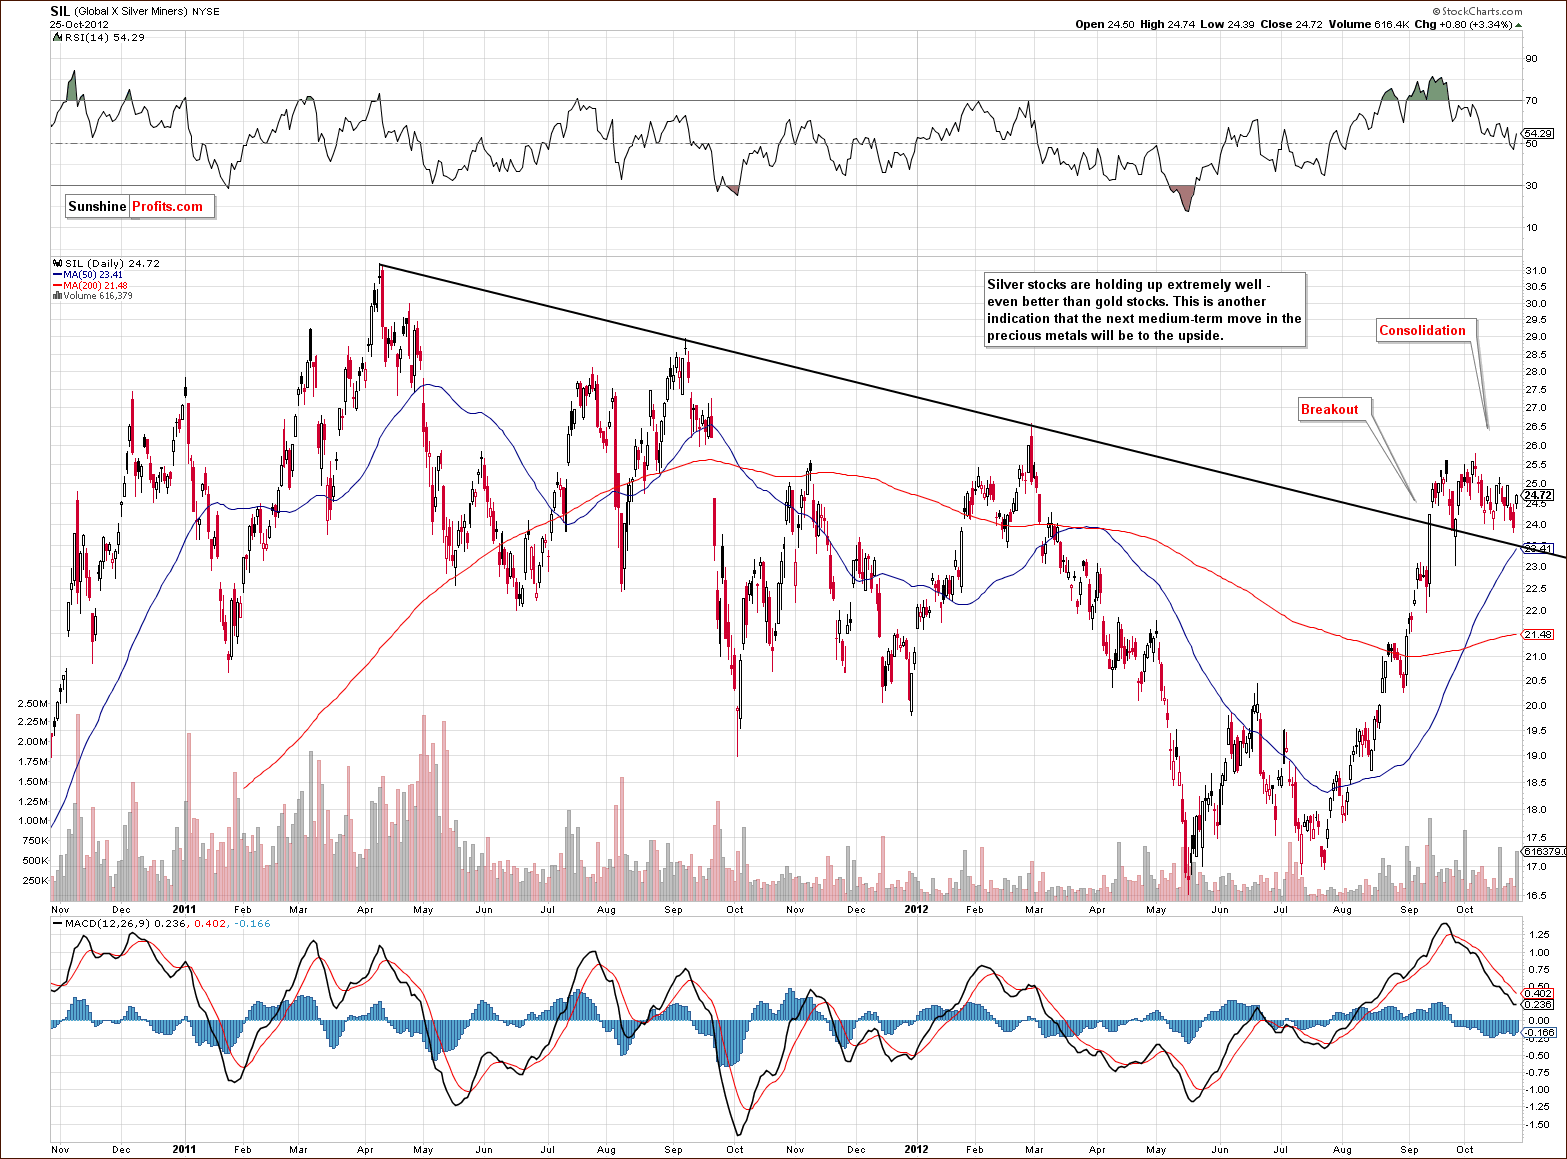
This week we have included a new chart, the long-term Global X Silver Miners chart. The silver stocks should provide confirmation or invalidation of points made in our earlier analysis of gold stocks. At this time, the silver stocks have a more bullish picture than any other part of the precious metal sector. The correction is barely visible – actually, some sideways trading has been seen when silver declined, not a decline.
There really hasn't been a decline to speak of when compared to the moves to the downside for gold stocks and silver itself. Indications coming from volume are very strong as well, with higher prices accompanied by high volume and declines seen on low volume. All-in-all, the situation is very favorable for silver stocks and the rest of the precious metals with respect to the medium and long term. This chart does not provide any short-term indications, though – at least we didn't find any meaningful short-term signs.
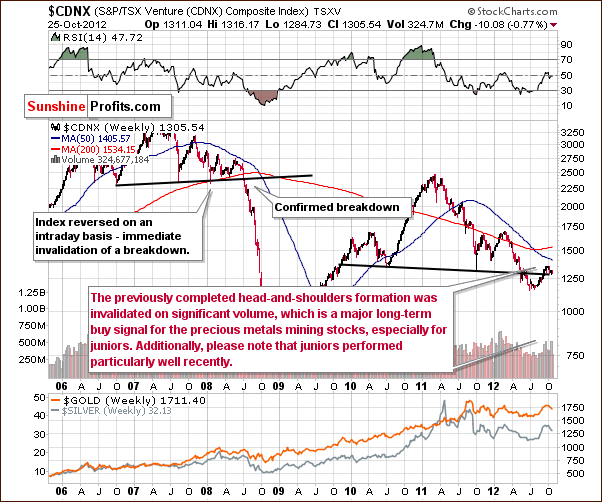
In the Toronto Stock Exchange Venture Index (which is a proxy for the junior miners as so many of them are included in it), we continue to see strength as price levels held pretty well this week. This is a good sign for juniors, miners and the rest of the precious metals.
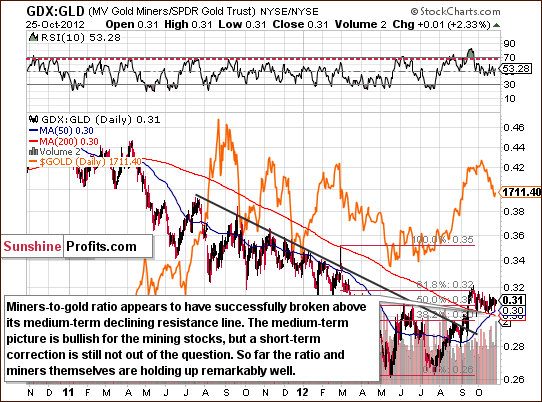
In the long-term miners to gold ratio chart, we see that the ratio has actually moved up a bit during the latest part of the period of declines in the precious metals sector. This is a very bullish factor for mining stocks.
Summing up, the main thing that we see in our analysis of mining stocks this week is that they are likely to outperform the underlying metals in the coming weeks and possibly months. A short-term bet on declines for the miners does not appear to be a good idea. This is because it seems that even if gold and silver move lower, the miners will probably decline less. Being speculative long in the miners while still shorting the metals appears to be a good idea. If the metals rally, the miners will probably rally even more and declines would likely be smaller for the mining stocks.
Letters from Subscribers
Q: Thanks for the update. Do you have any statistical measures of just how rare it is to see a weak general market, weak metals, but muted response in the miners? Obviously, the Great Depression showed that kind ofsituation (minus the metals pricing which was fixed). In the past 10 years, normally, we would have seen NEM or SLW down considerably in the type of environment we have seen in the last 8 or so trading days. I am always nervous about trading "it's different this time", because it almost never is. Thanks for the emails. I am enjoying it so far.
A: We believe that comparing the current situation to that of the Great Depression is not a good idea precisely because of the reason that you mentioned - the price of gold was fixed. So the fact that it didn't rally is not a sign of strength, and thus the analogy to the current situation is not really valid.
On a side note, some people will tell you how bad it was in 2008, but we read an interesting comparison: the average wage dropped about 5% in 2008; during the Great Depression wages fell 60%, so if we are in fact heading into "the Greater Depression", then 2008 was just the beginning. This, naturally, is no indication that it’s going to begin soon.
We checked recent history for analogous cases and found 3 of them:
- June to early July 2002 - miners held well despite declines in both gold and stocks. Unfortunately (for gold stock bulls), a plunge in gold stocks followed. HUI declined from about 140 to 93 in less than one month. An analogous decline here would mean a move to 340.
- Mid-May 2004 - gold stocks rallied without a rally in either stocks or gold. That was a major bottom not only in gold stocks, but in the whole precious metals sector.
- The second half of May 2012 - gold stocks rallied strongly without a rally in either stocks or gold. That was a major bottom not only in gold stocks, but in the whole precious metals sector.
So, we have 2 bullish cases and 1 bearish case, which (to our surprise) suggests that outperformance of gold and stocks simultaneously does not directly imply a move in either direction in the precious metals sector. So, we should not view the current strength in the mining stocks as an extremely bullish signal. It is a sign that miners will continue to show strength relative to the underlying metals, but it is no guarantee that this relationship won't break in the coming weeks (as was the case in mid-2002). Additionally, miners' strength relative to gold and relative to stocks are two of the things that the SP Indicators are based on, so even if we can't take that directly into account, we still do - indirectly, through the values of our indicators.
Q: I am a trial subscriber of SP starting yesterday. I am quite confused about the proprietary tools and information you provided.
(1) Does one need basic knowledge of statistics to understand what you are actually doing?
(2) There is a myriad of tools such as the correlation matrix and SP indicators and the Gold and Silver ranking tool. How do I put all of these tools together and form a trading method? Do I start with, for example, the Gold ranking tool and look for gold stocks to trade, and then apply the correlation matrix and SP indicators to find the right candidate? Is there a flowchart, for example? How does one begin to play the concepts and begin using the tools?
(3) Are the tools interrelated or do they work independently?
A: 1. In short, no. If you stick to reading what you receive by email from us you will remain updated on our views on the market. If you'd like to check our top gold stocks, simply open the Golden StockPicker and click "calculate". For silver stock ranking go to the Silver StockPicker and click "calculate".
On a side note, that's a tricky question, because it depends on what you mean by "what we're actually doing". If you want to understand how the ranking is constructed, then yes, some basic statistical background would be useful, but even without it you can read the report about a given tool in the reports section. After selecting a tool in the investment tools list, you will see "Detailed Report" and "Video" links in the menu on the left. This should make things clearer as far as our methodology is concerned.
However, if - like most investors - you prefer to simply use tools without getting into details, we encourage you to watch the videos in the multimedia section.
2. At this time there is only one source of automatic trading signals - SP Indicators which you will find in the charts section. That makes a total of 2 sources of signals (your Editor being the second one). You can think of it as two separate services combined into one. You can follow all provided indicators - the page with details and performance will tell you what kind of performance you can expect, what we suggest betting on when a signal is seen and where to put your stop-loss order.
Why not start with following our analysis and one of our indicators. For instance the SP Gold Stock Extreme #2 indicator had particularly good signals in the past. You can then examine our reports, tools, publications and other features one at a time and decide if you want to use some of them on your own or stick with the interpretations and signals from our indicators.
The Golden StockPicker and Silver StockPicker can be used for finding the best stocks if we or our indicators suggest taking a position in them. In this case (for speculative purposes) simply select "short term" as the perspective in the rankings.
3. They work independently (at least for now). They are created for different purposes.
Q: At this stage I don't have mining stocks organized on my platform to hedge as suggested. I do have short positions in gold at $ 1,747. Do you suggest holding them or close, or stop loss at $1,750?
A: While this is not an investment advice (we can't determine suitability of the trade for you), in this case I would still keep the short position in gold and I would still have a stop-loss order in place at $1,750.
Please allow us to digress a bit as this question shows that our subscribers' situations vary greatly. There are some subscribers who we know focus only on miners, there are those who care only about gold and there are those who put money only in silver. Some use options, some stick to ETFs and some only stocks or physical metals.
This is exactly why our tools (and other future features) have/ will have the option of customization. Currently, our interactive gold stock ranking and silver stock ranking are perfect examples of this approach. Do you want to simply bet on a rally in miners but are not sure which stocks give you the biggest bang for your buck? Take a look and find out. Constructing a portfolio with the long-term in mind? The ranking is right there. Rebalancing your portfolio? No problem, rankings are updated on a daily basis (oh, and we also checked how often you should rebalance your long-term mining stock investments to make the most of it).
It's a little more complicated than looking at a static list of top stock picks that should be good for everyone, but... Just compare it to buying a suit. You can instantly buy a very cheap suit; you can even buy it online. It will be very fast and will require no effort whatsoever. You can also go to a reputable tailor that requires you to book a visit in advance. It will require some effort just to get there, it will take time to take measurements and it will definitely take time before the suit is ready. And it will not be cheap. But you know very well the effect wearing both of these suits on important occasions will have on you and how you will feel.
You can ask someone to book the visit, and your driver can take you to the tailor, but you will never totally eliminate the effort on your part if quality is what you want. We spend countless hours making tools work efficiently and at the same time making them as easy to use for you as possible (and we make videos to make using them even easier). But we will never be able to eliminate all the effort completely. We too want the tools to be of highest quality.
Q: We are very concerned that we are seeing the early stages of a stock market crash (a la 1987/ 2008) that will have the dollar soar and gold die. We are considering selling long positions in gold and taking loses. Then there is a Romney win around the corner. Things look dark. Any advice you could offer on this unfolding scenario would be much appreciated.
A: US stocks moved close to their all-time highs and are now consolidating. This by itself doesn't make the situation bearish. There are multiple bearish developments (fundamentally) that one can say about the stock market, but that has been the case in previous years as well. Open-ended QE is now a fact and is likely to push asset prices higher despite the short-term declines (that we see right now).
If Romney is elected, we could see some declines in the stock market, but it is not certain that gold will really plunge this time, like it did in 2008. It may or may not because investors saw gold's price move back up strongly after the 2008 bottom and this time they may simply assume that the same thing will happen. Consequently they may not want to sell gold as they will not believe it has much room to drop, and even if the decline might be perceived as a very temporary phenomenon.
We should be able to provide a more detailed reply when provided with details that should make the stock market collapse soon (!).
For now, we believe that our current positions correctly reflect the current situation: long-term investments are in the market (we might suggest getting out of them if there are signs of further weakness after Romney's victory - for instance if gold moves below $1,600 and confirms the breakdown), and we are speculatively shorting metals while being long miners with a stop-loss order being in place for both positions. If the precious metals sector declines, the long position in miners will quickly be closed and the speculative short one will provide some sort of hedge to the long-term position. Naturally, we will provide comments on the situation with emphasis on long-term investments if gold indeed declines significantly.
Sunshine Profits Indicators
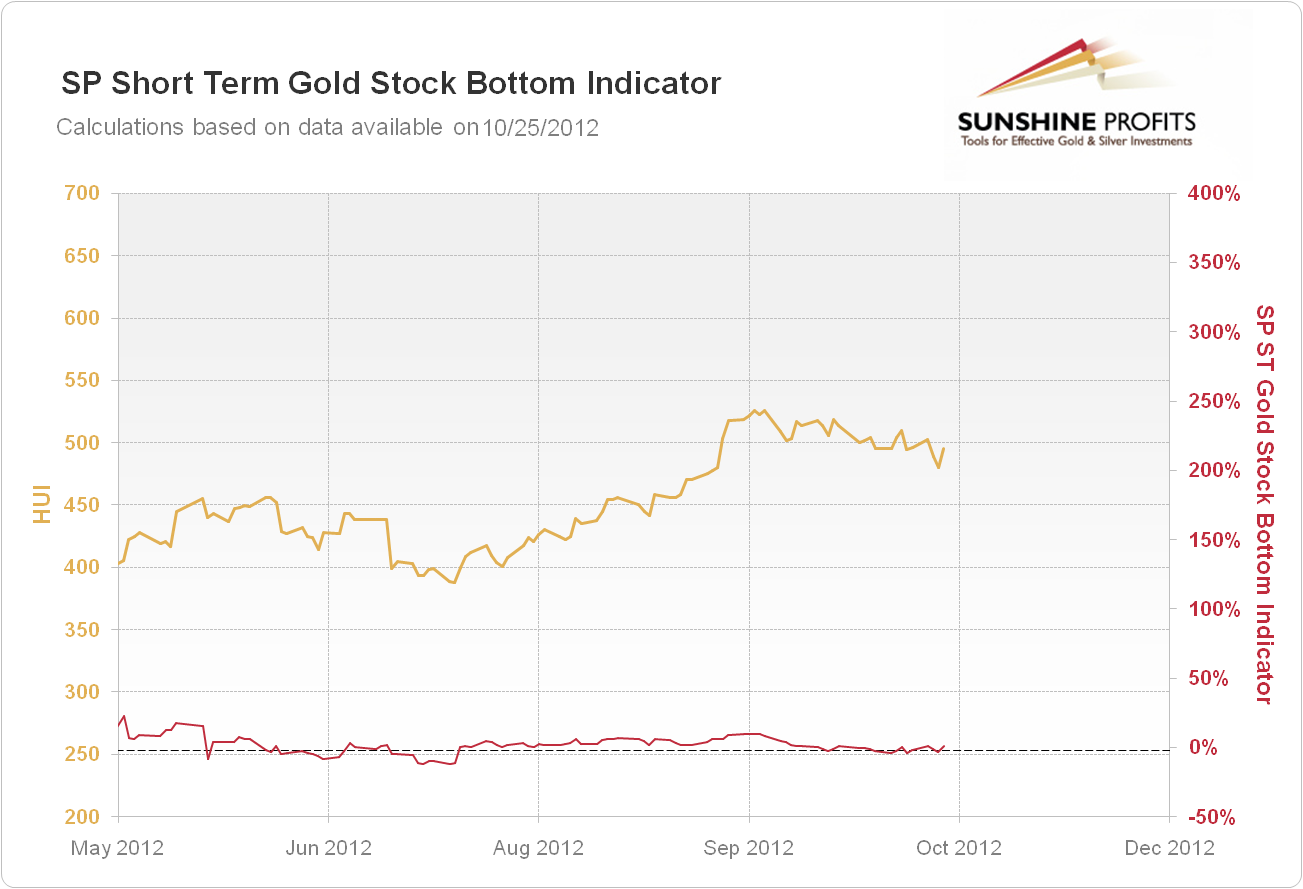
Based on yesterday's closing prices we saw a buy signal in the SP Short Term Gold Stock Bottom Indicator. Quoting from its description:
The buy signal is given, when the SP Short Term Gold Stock Indicator is below the dashed line and starts to rise. (when value of the indicator has been falling for 3 consecutive days and then the next day is higher)
Default trading suggestions after signals:
The indicator is below the dashed line, it had been falling for 3 days but went up during the last session:go long mining stocks with a 2-week trade in mind.
The indicator breaks down through the dashed line:no signal.
The indicator breaks up through the dashed line:no signal.
Consequently, the indicator suggests opening a speculative long position in the mining stocks with a 2-week trade in mind. We already have a long speculative position based on the indicators (based on the SP Gold Stock Extreme and SP Gold Stock Extreme #2 indicators) so this currently means no changes – this is something reassuring us that the long speculative position in miners is justified.
Speaking of the SP Indicators, last week we wrote the following:
Our next steps regarding charts and signals from indicators are making them bigger after they are clicked (enlarged). We will plan to check whether a stop loss can be determined for each indicator/ market individually.
We are happy to inform you that charts are bigger after you click on them (when you click each chart to enlarge it, you may need to click an additional button with arrows on the top of the screen to enlarge the chart even more) and, more importantly, that we conducted a thorough research on stop-loss orders for our indicators. You will find details in the on the page with indicators' performance. In each case stop-loss orders were optimized for trades that we suggest taking for a given indicator. For instance, the above indicator has a stop-loss of 50% which effectively means no stop-loss at all. This may seem odd, however please note that this indicator suggests precisely 2-week trades. If this trade does not bring you profits, you close it anyway. This means that in all cases indicators have built-in stop-loss orders that are based on time.
Some of them, however, will also have additional stop-loss orders based on price. For instance, SP Gold Bottom Indicator has a suggested stop-loss level of 0.7% for gold, which means that if gold declines modestly after this signal is seen, it is a good idea to close the position immediately and wait for another buying opportunity.
Again, you will find details in the on the page with indicators' performance. You will see returns on (non-leveraged - !) trades in gold, silver and mining stocks if one followed trading suggestions described for each indicator along with applying suggested stop-loss orders. On a side note, these trades were profitable even without stop-loss orders, but using them increases profitability over time and it also protects you from taking bigger losses (which is important both: financially and emotionally). These returns are simulated because the exact trading suggestions and stop-loss orders are available now, however we find this simulation as quite reliable because indicators were providing great signals (real; not simulated ones) in the past years that could have been profitably traded also in case of different trade times and stop-loss orders (profits would simply not be as big).
Please take your time to analyze these charts – it will tell you a lot about what you can expect from the indicators. Note that there are months without signals that are followed by a small loss – very discouraging psychologically, but without bigger meaning for your portfolio as the gains that follow in the following weeks or months are worth it.
The next step (which is almost ready today) will be to create a section dedicated to stop-loss orders which will feature the long-term profitability of each of the indicators associated with various stop-loss levels. This is what convinced us that the optimal values of stop-loss levels are really something optimal and not found by a coincidence.
Please keep in mind that we provide these details because we want you to be sure that what we give you is well-founded. We will strive to make it as simple to use on a continuous basis as possible. For now, you simply receive e-mails from us with changes and suggestions and there's an easy-to-interpret table with positions at the end of the update.
Summary
The short-term outlook for the USD Index is for a rally but likely not a big one. The cyclical turning point is close. The opposite outlook holds for the general stock market. Although the short-term trend is down, the medium-term support line is close, so significant declines are not likely, especially just before the elections.
The indications are for lower gold and silver prices in the short run. The mining stocks do not have as bearish an outlook mainly because they have performed so well lately. Even though stock prices declined, the USD rallied, and gold and silver prices moved lower, the mining stocks have held up remarkably well.
At this time, we continue to believe that long-term holdings in the precious metals are still a good idea as are short speculative positions in gold and silver. Being long in the miners for the short term also appears to be a good position at this time.
Downside target levels for gold are $1,680 and for silver $30 to $31. We do not have any downside target levels for the miners at this time as it seems they may move no lower than price levels seen this week.
| Portfolio's Part | Position |
|---|---|
| Trading: Mining stocks | Long |
| Trading: Gold | Short |
| Trading: Silver | Short |
| Long-term investments | Long |
Thank you for using the Premium Service. Have a profitable week and a great weekend!
This completes this week's Premium Update. Our next Premium Update is scheduled for Friday, November 2, 2012. Of course, we will continue to send out Market Alerts whenever appropriate.
Sincerely,
Przemyslaw Radomski, CFA

