
There's an old joke that the price of gold is understood by exactly two people in the entire world. They both work for the Bank of England and… they disagree.
O.K., it’s not such a great joke, but it does underscore the fact that many investors and even economists don’t understand what drives the price of gold. Most gold investors are well aware of the relationship between gold and the US dollar. A lower dollar leads to higher gold prices in US dollars and vice versa. But that is just one relationship and correlations tend to change over time, which is why at Sunshine Profits we update our Correlation Matrix every day, noting the changes in gold’s relationship to the various asset classes. There are many factors that economists use to explain the price of gold: supply and demand, central bank sales, the stock market, monetary expansion leading to inflation and investor fear in times of economic turbulence, bad news out of Europe, or America or the Middle East, etc.
There is yet another explanation used by economists, one which we would like to address here -- the influence of real interest rates on the yellow metal. The rule of thumb, according to one aspect of this theory, is that gold and interest rates move in opposite directions. Whenever the short-term interest rate falls below 2%, gold rallies, and whenever the real short-term rate is above 2%, the price of gold falls. The reasoning of economists who hold this view is straightforward. Gold produces no cash flow and pays no interest or dividends. So, there is an opportunity cost if an investor is willing to give up that cash flow. When the interest rates are high relative to inflation, there's a big opportunity cost. But, if, for example, the yield on the 10-year Treasury note is about 2 percent and inflation is running about 3.6 percent, an investor is receiving a negative real return. In this case, there is no opportunity cost to holding gold and other precious metals.
If we take a look back at the past 100 years, interest rates generally trended downward during the gold bull market of the 1930s, upward during the gold bull market of the 1960s and 1970s, and downward during the first 10 years of the current bull market. One can conclude that the trend in the nominal interest rate does not determine gold's long-term price trend.
There is another issue here. It’s not only about what low rates mean today, but what they mean for the future price moves. Lower real rates imply higher inflation in the future, encouraging investors to pile into gold as a hedge. Lower real returns in Treasuries also drive investors into riskier assets in search of higher returns. All other things being equal, lower real returns on Treasuries reduce demand for US dollars, causing the dollar to fall and therefore the gold price to rise in US dollars. Investors view looser monetary policy as an indication that the economy is in bad shape and that inflation is right around the corner which makes gold attractive as a safe haven.
The Keynesians use this relationship between interest rates and gold to explain the high gold prices today as well as in the 1970s when gold prices were high and interest rates were low. Some say that what led to the collapse in gold prices in 1981 was the US raising the federal funds rates in 1980, reaching as high as 20% in 1981.
Nobel Prize winning economist, Paul Krugman, even lost a night’s sleep over this issue and wrote in a New York Times blog titled Treasuries, TIPS, and Gold that he has no idea what drives the price of gold, to say that it’s a market driven by hoarding in Asia, Glenn Beck followers, whatever. But maybe I’ve been too flip here. Why not think about what actually should be driving gold prices? And I mean think about it, rather than going for slogans about inflation, debased currencies, and all that.
After giving it some careful thought, Krugman comes to the “surprising” conclusion that “soaring gold prices may be quite consistent with deflationists' story about the economy.”
In other words, the “real” story about gold is that “the price has risen because expected returns on other investments have fallen.” Interest rates are low, so investors are not missing out on interest if they buy gold.
Brad DeLong, a professor of Economics at the University of California, elaborated on Krugman's blog and wrote:
On this interpretation gold is and always has been a super Treasury bond: a very long duration asset that is or at least is perceived to be "safe" in the sense that its price does not trade at a discount (due to risk and default premia) from a Treasury bond of the same duration but instead trades at a premium.
Another economist to weigh in on this issue is Dr. Jeffrey A. Frankel, Professor of capital formation and growth at Harvard Kennedy School and a former member of the White House council of economic advisors. He wrote a well-known paper in the 1980s linking monetary policy and commodity prices. Frankel doesn't claim that his model explains individual commodity prices as the price of individual commodities can be influenced by factors such as weather and extraction costs, but he does offer statistics to support his claim that commodity prices are inversely related to interest rates. In the 80s when the real interest rate was at historically high levels, commodity prices were at ebb. During the 70s and 2000s, when the real interest rate was low, commodity prices were high.
Frankel updated his paper recently and wrote "Events since August 2007 provide a further data point. As economic growth has slowed sharply, both in the United States and globally, the Fed has reduced interest rates, both nominal and real. Firms and investors have responded by shifting into commodities, not out. This is why commodity prices have resumed their upward march… rather than reversing it."
Robert Murphy, an adjunct scholar of the Ludwig Von Mises Institute, the Austrian School of Economics think tank, puts this theory about gold and interest rates to the test. He notes that real interest rate (as measured by 20-year TIPS yields) rose quite sharply from 2.06 percent on January 3, 2006, to 2.58 percent by July 3 of that year, a strong move for such a short time period.
If Krugman's basic story is right, then this large increase in the "real rate of interest" over a six-month period should clearly have reduced the real price of gold. So how well does Krugman's theory hold up? (…) Spot price of gold in early January 2006 was $530. By early July the spot price had risen to $623. After adjusting for the change inofficial CPI, that's still a 15 percent increase in the "real" price of gold, during a short stretch when Krugman's theory says gold prices should have gone down, and probably sharply. Oops.
Murphy sums up, by saying that whether we're looking at large moves in the real interest rate over shorter periods, or fairly steady real interest rates over longer periods, there are patches using Krugman's own data set that are at complete odds with his model.
Perhaps the problem with Krugman's theory is that he tries to explain the price of gold while ignoring gold’s historical role as the market’s money, as a medium of exchange. Clearly gold is not priced like other commodities. Focusing on current events, the latest news about Greece and Spain, the Fed and their effect on gold prices, reflects concern for symptoms rather than an understanding of the actual cause of these price increases. If gold is a commodity like pork bellies or aluminum, then it should be priced as such. If it were to be priced strictly by its industrial uses then its price would plunge so dramatically that you and I could afford to gold plate our kitchen sink. There is something about the yellow metal that inspires people to pay substantially more for it than its commodity value. After all, gold is money, insurance against financial catastrophe.
Our take on the situation is that real interest rates are a major factor when it comes to determining the long-term trend in the gold market, but obviously they are not the only factor. For instance gold is viewed as a hedge against financial crises and turmoil in generals (military conflicts for instance) and if they arise gold will soar regardless of the current real interest rates in the US. The investment and – importantly – speculative demand makes gold rally way above its moving averages just because of emotional decisions of thousands of market participants that are not based on fundamental data at all.
Consequently, we believe that the assumptions that gold "has to" react in 6 months at most to a fundamental factor is in order to confirm its validity is flawed. If any market rallied strongly without correcting for 3 years, then we would not be surprised to see a big correction and a consolidation that is well over 1 year – regardless of the improved fundamental situation. Gold’s lack of reaction to an increase in the real rates (assuming that the reported numbers are correct) is not something that invalidates the theory, which is that real rates impact gold prices.
One more thing about the methodology featured above – it's rather not a good idea to treat equally (and compare) periods when gold was effectively money (gold standard) and periods when it wasn't (like now).
We don’t foresee any financial catastrophe this week, so let's turn to this week's technical part with the analysis of the US Dollar Index. We will start with the long-term chart (charts courtesy by http://stockcharts.com.)
USD Index
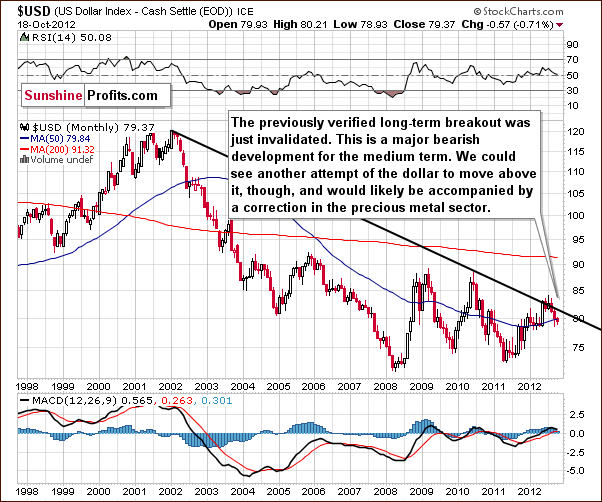
We begin this week with a look at the long-term USD Index chart. There is no real change in the chart this week, and the picture remains bearish here. This chart provides no implications for the short term whatsoever as declines could continue or a new rally could begin based on what we see here. The upcoming rally would be likely small because the declining resistance line would probably stop it. However, what’s small on the long-term chart can be average on the medium-term one and significant from the short-term perspective, and this is the case right now.
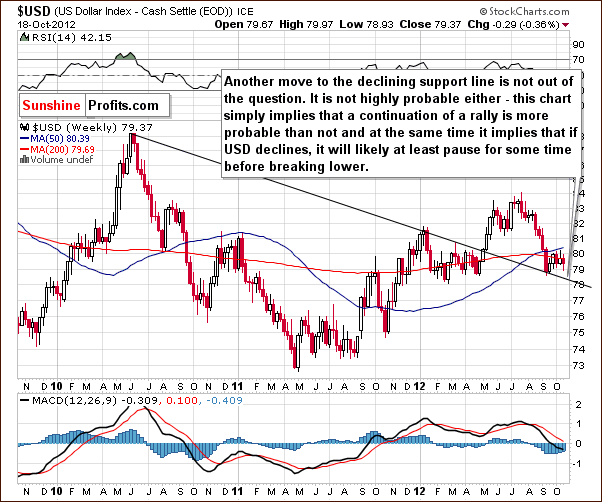
In the medium-term USD Index chart, a move to the upside appears likely. We have seen a bottom form at the declining support line (thus verifying is as support), then a bounce, and then another decline. The index is now close to the level of its previous low. We could see another move a bit lower and then a bounce or we could see a move to higher levels right away. The implications are bullish here for the coming weeks whether or not prices move higher or lower Friday and early next week (very short-term basis).
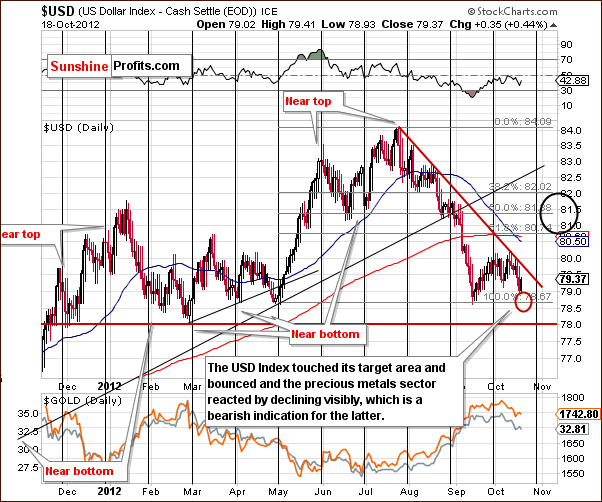
Turning now to the short-term USD Index chart, a rally appears possible as we have seen a move to the upper part of our downside target red ellipse. Another significant rally could be seen from here with a local top in late October or early November. The maximum upside target level is shown with a black ellipse – the 80.50 to 82 range.
We don’t expect major strength in the USD Index before the coming election as this could hurt the general stock market and that could cost votes.
Please take a look at the lower part of the above chart that features gold and silver and compare it to the recent performance of the USD Index. The key point here is that the recent sideways trading in the USD has resulted in lower precious metals prices – if we see more sideways trading, we can easily see more declines in the metals. If, however, the USD Index rallies (not even significantly) the metals could decline sharply. We expect this relationship to be short-lived, but still this is something that is currently in play.
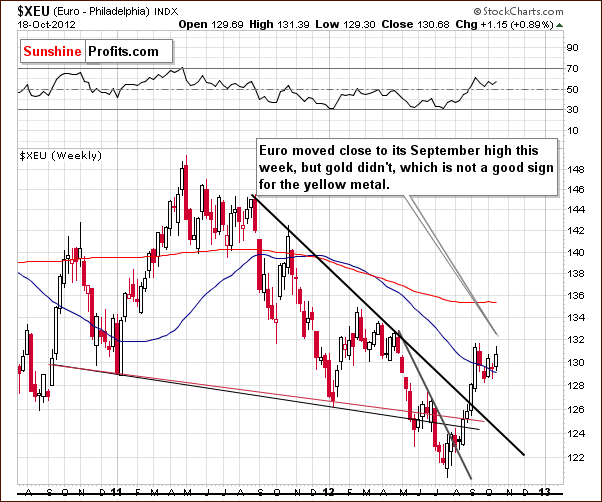
In the long-term Euro Index chart, we see the opposite of what we saw in the USD Index. The dollar is close to its lows and the euro has moved close to its September high. Gold however did not approach its high and this is not a good sign for the yellow metal. Gold’s price, in fact, is much lower this week than its October high and with gold showing weakness, the same holds true for the rest of the precious metals sector.
Summing up, the short-term outlook looks bullish for the USD Index, although not extremely bullish based on the upcoming elections. The implications for the precious metals market are bearish
General Stock Market
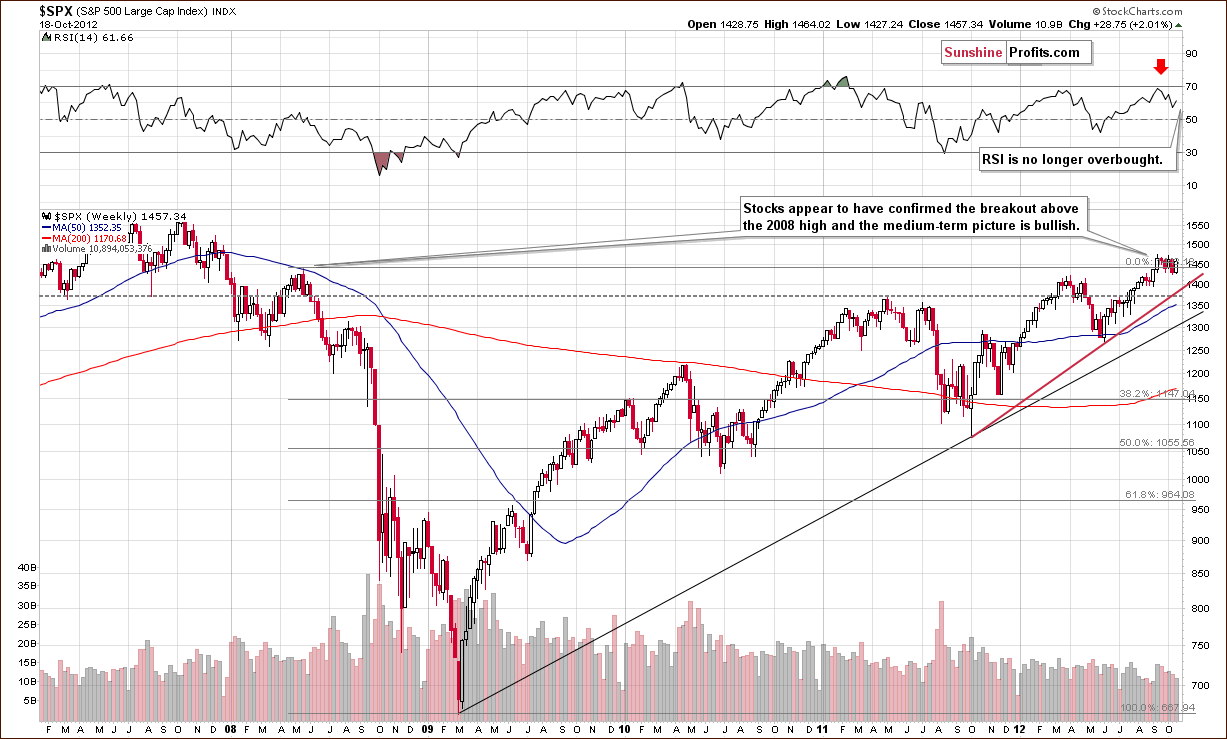
In the long-term S&P 500 Index chart, we see that stocks prices are still above their important 2008 high and the breakout is still in place. In the September 14th, 2012 Premium Update, we wrote the following:
In the very long-term S&P 500 Index chart (please click the above chart to enlarge), we see a major breakout this week above the 2008 and 2012 highs. This is an important bullish development, and the markets could very well move much higher from here. The next significant resistance line is at the 2007 highs, at 1550. A move to this point appears to be very much in the cards although a consolidation could be seen first.
Recently prices have consolidated a bit, a verification of the move above this important resistance level now turned support. Stocks now appear ready to once again move higher.
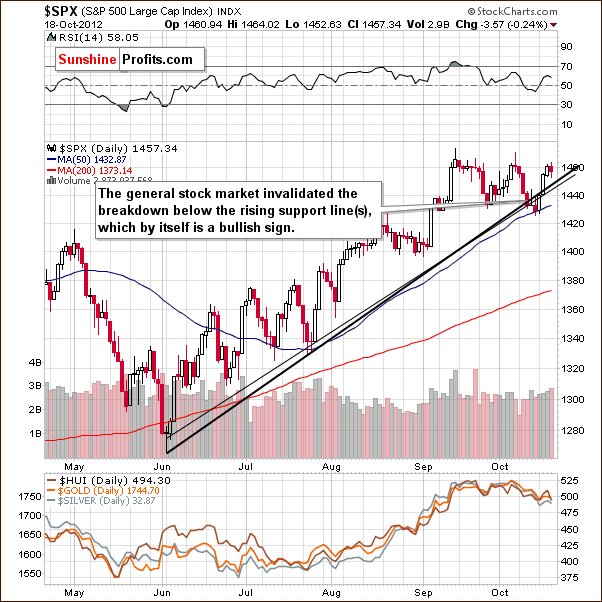
In the short-term S&P 500 Index chart, we see that last week’s breakdown has been invalidated this week. Taken by itself, this is a bullish signal. It seems likely that the rally will continue since a sideways trading pattern following a significant rally is often followed by another rally. In addition, higher stock prices are something quite typical just before Election Day in the U.S. If stocks move lower now, a bearish head-and-shoulders pattern would take shape. This does not appear likely however.
Crude Oil Prices
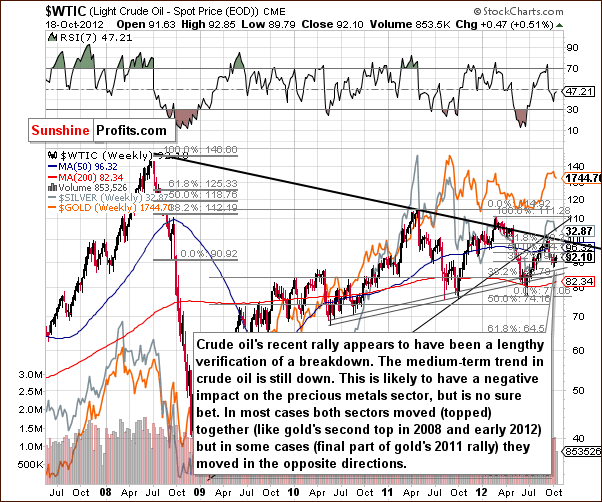
In the crude oil price chart this week, little has changed since the last time we featured this chart. The medium-term outlook appears bearish here and lower oil prices are just what politicians want before an election. As we will discuss later in this update, this makes it easier to introduce various money printing programs.
Lower commodity prices suggest that inflation is not a big threat (it doesn’t really work this way as mechanisms generating inflation work in the long term and prices can move in the short term in any direction regardless of the main trend). However, instead of focusing on whether lower prices in commodities and gold are artificial or due to technical reasons (or declining fundamentals? Not likely), let’s summarize what’s likely to happen next based on the technical picture. The medium-term trend is now down, the breakdown has been verified, and lower commodity prices in general are probable for at least a few more weeks.
Correlation Matrix
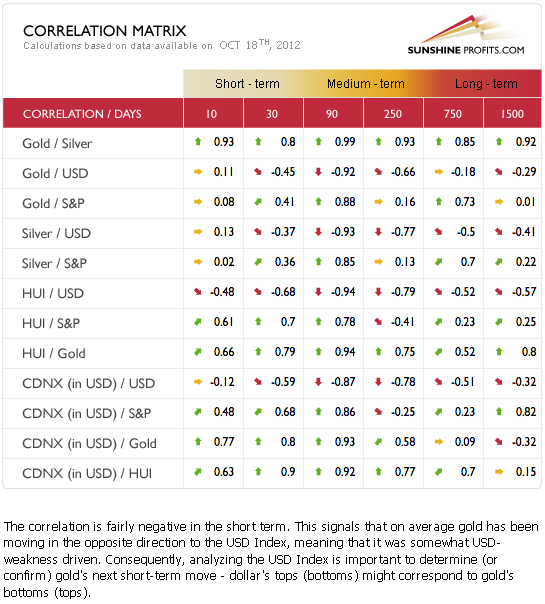
The Correlation Matrix is a tool which we have developed to analyze the impact of the currency markets and the general stock market upon the precious metals sector. The correlations have actually weakened since last week. What’s most important is the way in which they weakened.
Precious metals prices moved lower even though the USD Index did not rally and in spite of the rally seen in stocks. With these two bullish indicators in place, gold did not respond positively; this is a sign of weakness. There are clearly bearish implications going forward. This lack of reaction to the strength in stocks means that the bullish picture in the latter is not necessarily a threat to our speculative short positions in gold and silver. We are concerned but not to a point of closing them.
Gold
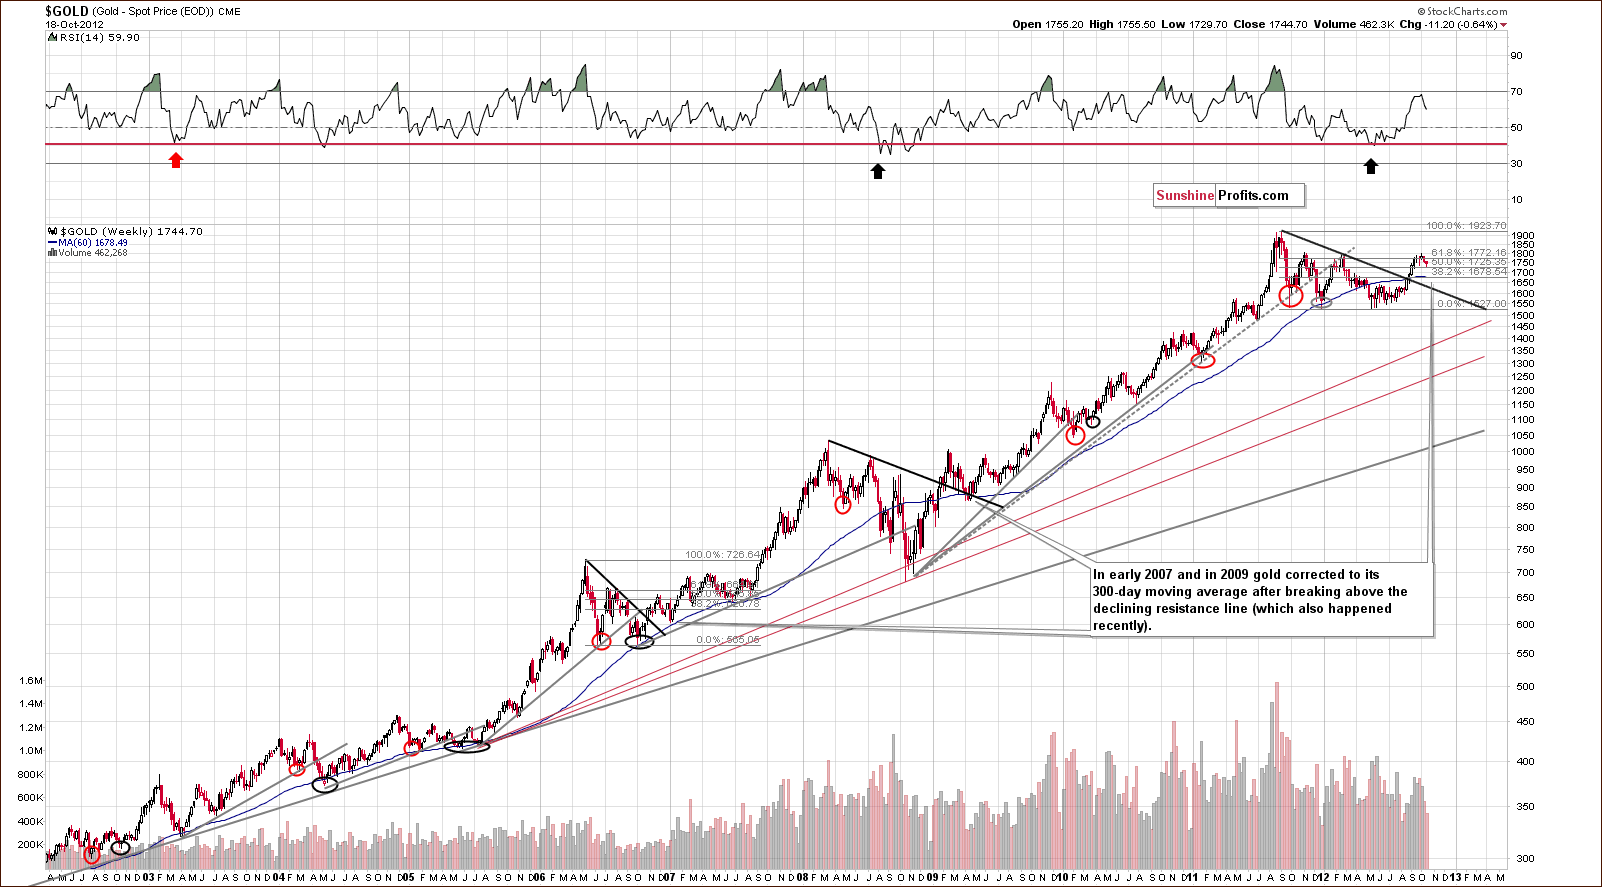
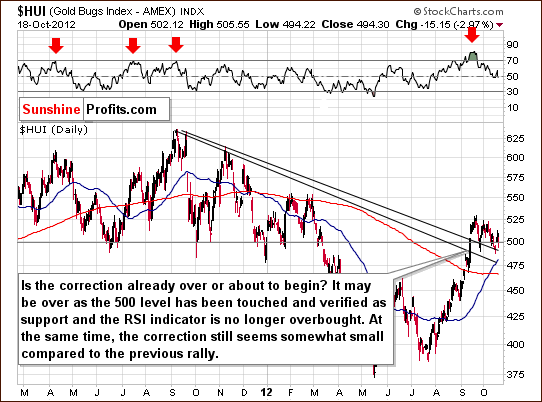
In gold’s long-term chart, we see much the same as what we saw last week. Gold is still quite likely to correct to its 300-day moving average. With the current price level well above this average, the correction is likely not over based on this chart alone. It simply seems that the correction was not significant enough to correct the August-September rally. Analogous rallies were previously followed by declines that were bigger than what we've seen this and last week.
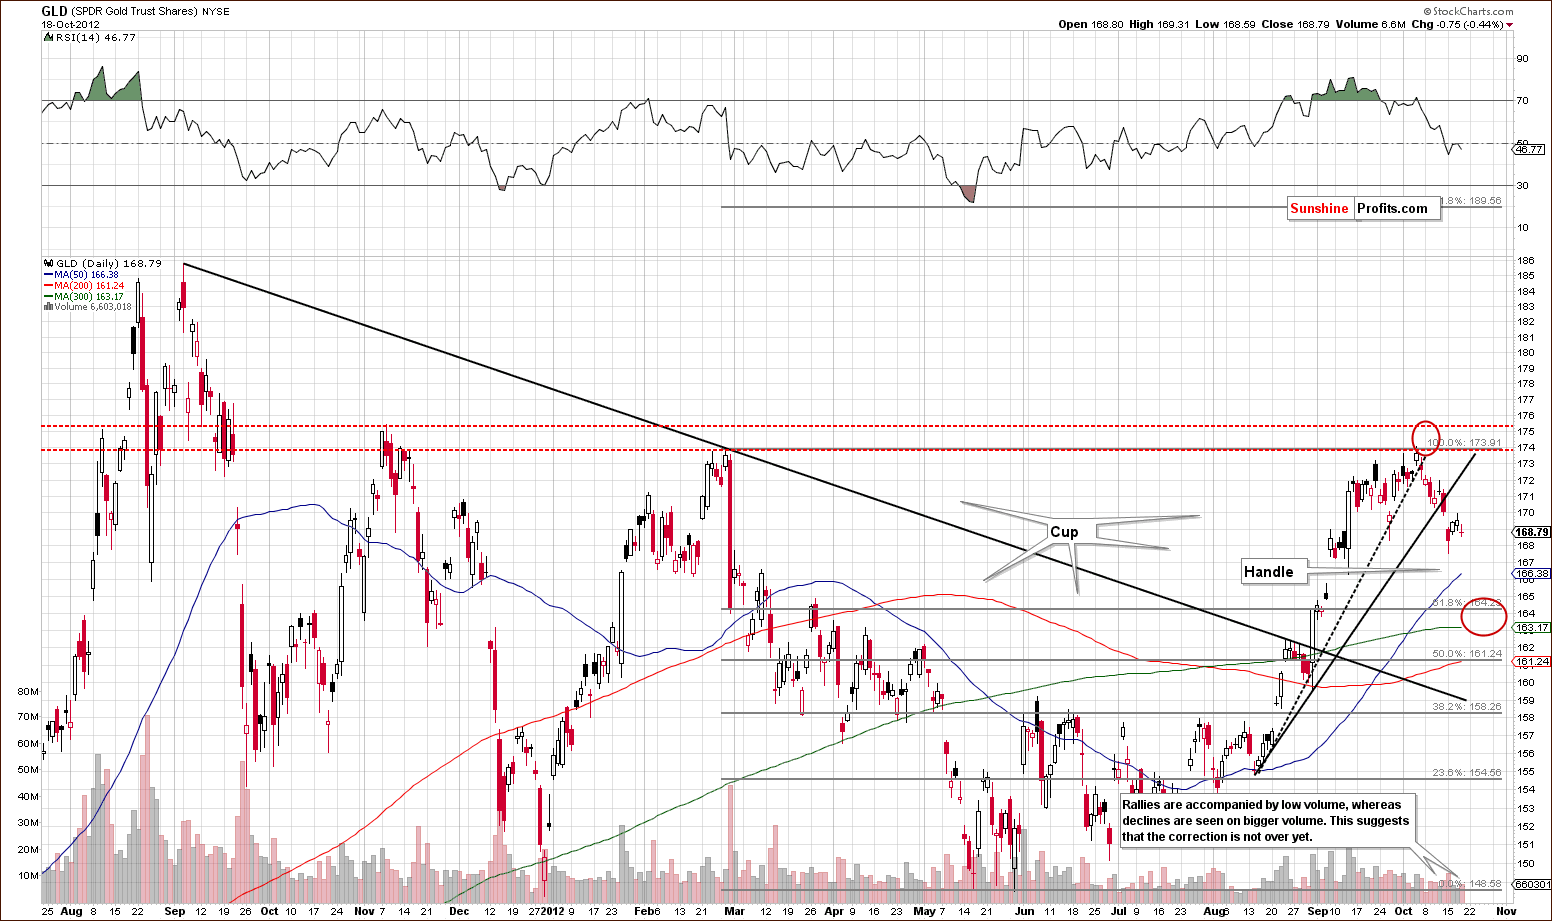
In the short term GLD ETF chart, we see that the recent breakdown has been confirmed this week. In last Friday’s Market Alert, we stated that:
At this point it seems that small speculative long positions in the mining stocks should be closed and speculative short positions in the precious metals sector should be opened (gold, silver and mining stocks). We view the odds for a continuation of a decline at 70% here (we could or could not see another small move higher here, but based on the above-mentioned factors, it is no longer worth betting on).
On Monday, gold’s price moved lower on significant volume, pulled back slightly on Tuesday and Wednesday with low volume, and declined Thursday on bigger volume. These price-volume links further emphasize that the gold market is about to move lower. The short-term picture remains bearish and our previous target level of $1,680 to $1,700 remains valid.
Finally, a look at 2012 trading patterns shows a big cup pattern and now a developing handle. This handle part will complete at the end of the current correction and will likely be followed by a rally.
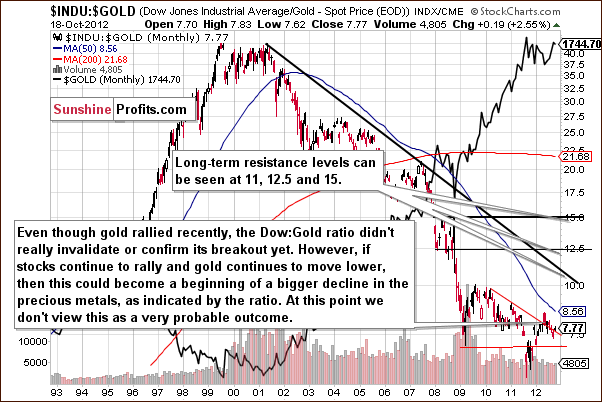
In this week’s Dow to gold ratio chart, we once see the ratio right at a declining support/resistance line. The move above this declining resistance line has not been confirmed or invalidated as the ratio has been moving around this line for a few months now.
If stocks rally, as their charts indicate and gold corrects significantly, the ratio will move higher. If the ratio moves higher, and this breakout is confirmed, this could very well lead to more strength in stocks relative to gold. It also could lead to bigger declines in gold. At this time, we bring this up only as a possibility, not something that is very probable. We will continue to watch this closely and report to you accordingly.
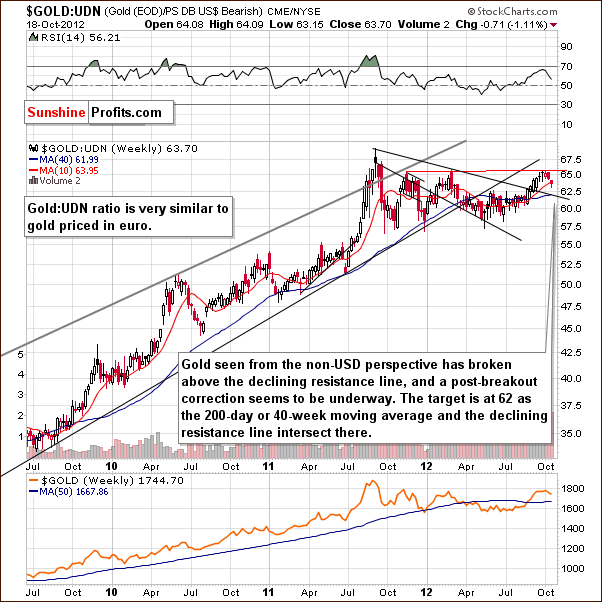
In this week’s chart of gold from the non-USD perspective, a correction now appears to be underway with gold reaching its 2012 high, and the correction does not appear to be over yet. The 200-day moving average (blue-sloping line) has provided support in the past and it seems that it will stop the current decline as well. The declining support line based on 2011 and 2012 highs is also just a bit below today’s price level. In fact these two support lines intersect at approximately 62 level and this is where we expect the decline to end. All in all, this means that the correction is about halfway done.
Summing up, the short-term situation for gold is bearish. The medium-term and long-term outlooks appear bullish at this time. We continue to believe that the $1,680 - $1,700 range will be reached relatively soon (probably next week).
The speculative short positions in gold appear justified at this point.
Silver
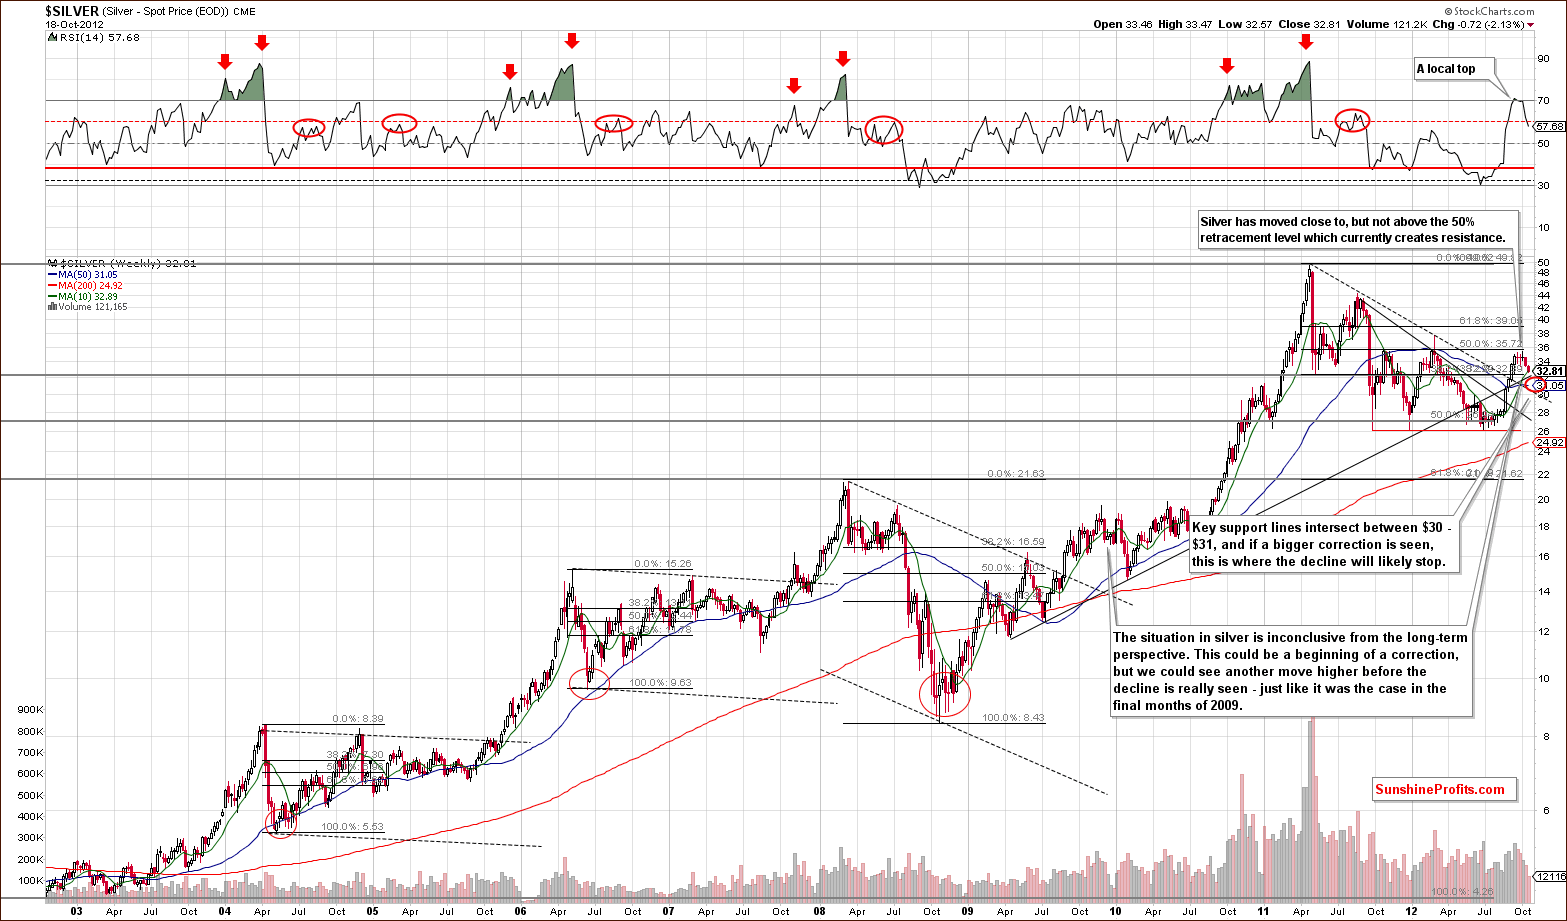
In the long-term chart for silver we see that the correction is now underway, although we still cannot rule out another pullback before the real decline is seen.
However, based on the situation in gold and according to the recent weakness of the whole precious metals sector despite positive signs from the general stock market and the USD Index, it seems that the decline here will continue.
Our downside target level of $30 to $31 has not yet been reached and we expect it to be reached quite soon – perhaps next week.
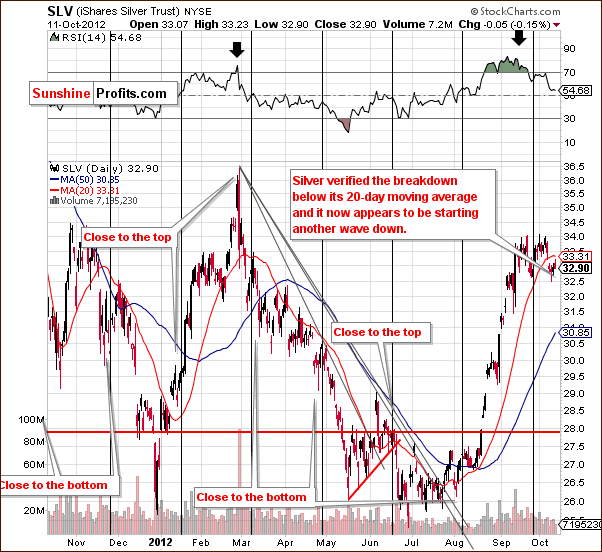
In last week’s Premium Update we wrote that silver was verifying the breakdown below its 20-day moving average. This week we see this breakdown as verified. The most profound confirmation materialized on Thursday when silver moved temporarily higher only to decline later and close the session below its opening price. The implications are now for lower prices in the days ahead.
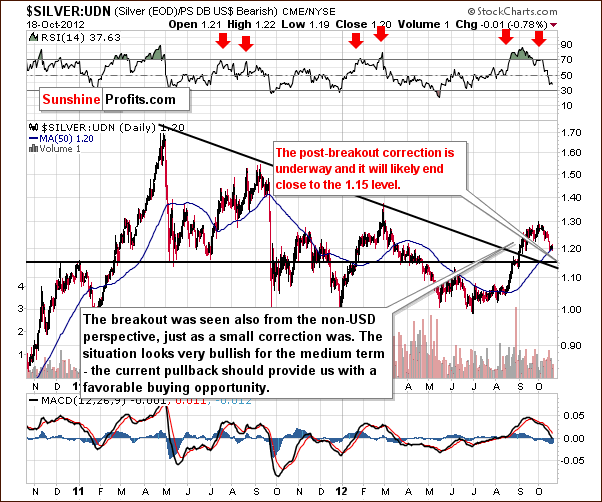
In the chart of silver’s price from a non-USD perspective, we see that a correction is underway and above one half complete. The suggestion here is for further weakness in the silver market and likewise for the rest of the precious metals.
Summing up, the situation for silver this week is much the same as gold. A correction appears to be underway but the medium-term and long-term outlooks remain bullish.
The speculative short positions in silver appear justified at this point.
Mining Stocks
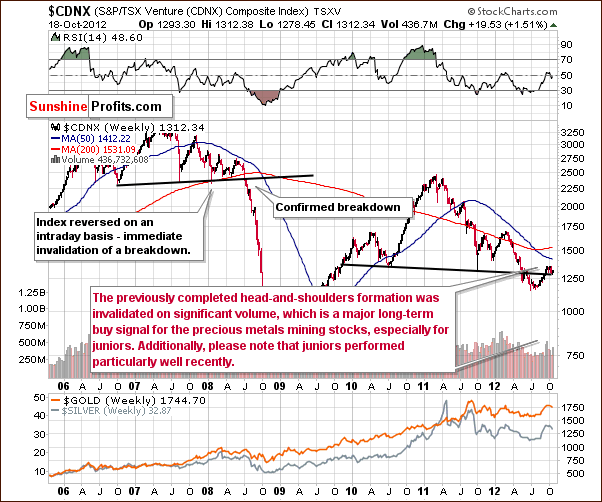
In the Toronto Stock Exchange Venture Index (which is a proxy for the junior miners as so many of them are included in it), the outlook remains bullish even with the declines seen in precious metals’ prices over the last two weeks. The index remains well above its support line, and the outlook is bullish for juniors which are highly correlated with the general stock market. This is confirmed by the coefficients in the correlation matrix (third line from the bottom).
In this week’s medium-term HUI Index chart, we have mixed implications for the short term, but the outlook is bullish for the medium term. The recent declines-corrections have not been that significant given the corresponding move in gold prices.
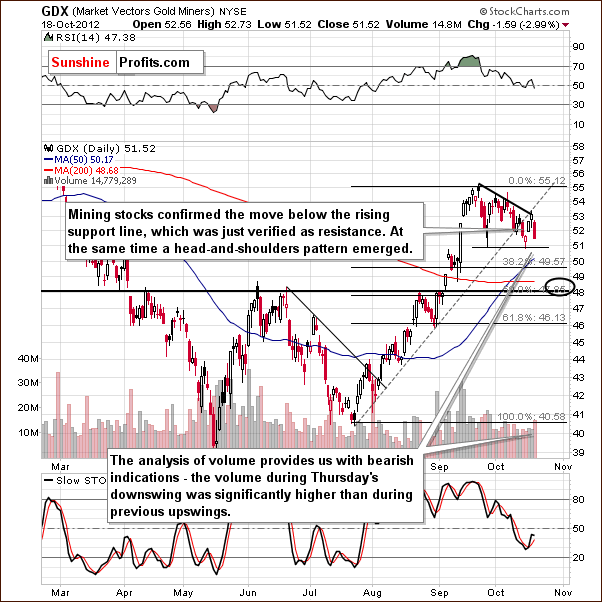
In the GDX ETF short-term chart, a decline was seen on Thursday, which was significant both in size and volume. A head-and-shoulders pattern is possible here which would confirm our $48 target level. Most importantly, the move below the rising support line has now been confirmed and verified. Lower prices for the miners are now more likely than not in the short term.
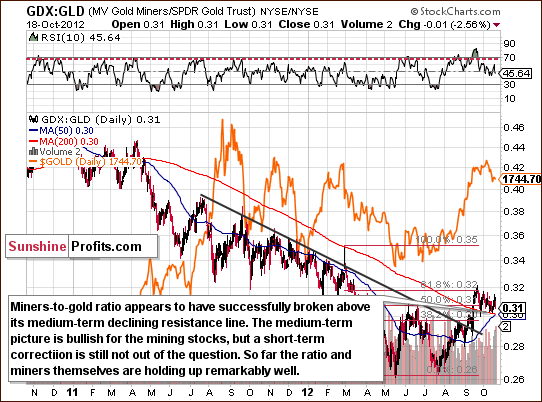
In the long-term miners to gold ratio chart, we see that the ratio held quite well this week (and month). The implication here is that declines in the mining stocks may not be as painful as in the metals themselves. After all, mining stocks rallied early this week as did the general stock market. If a rally is ahead in the general stock market, the miners may not be greatly affected by declines in the precious metals.
On the other hand, they may see daily declines (when metals decline) followed by a quick reversal (when metals do nothing and stocks rally) to the upside or simply small declines as compared to the metals. This is one of the reasons we suggested (in a Market Alert) closing short positions in the mining stocks and keeping those in gold and silver open earlier this week.
Summing up, the short-term outlook for mining stocks is a bit unclear but more bearish than not. The medium term case for the mining stocks is very bullish in our view.
Letters from Subscribers
Q: If we have already closed shorts (not willing to bet on a decline) and mistakenly gone long (with a pretty good daily loss) why would taking the loss and getting out make sense unless we were betting on a substantial future decline (in which case we should not be closing shorts)? Just trying to follow the thought process here.
A: It makes sense because the probability for a decline in the short-term is greater than the probability of a rally and we can easily see bigger declines in the coming days/weeks than what was just seen on Thursday. Since a small loss is better than a big loss, we suggest getting out of the long position in miners.
Q: I feel I got more out of your punchy up-to-the-minute alerts than the premium update which seemed more focused on the website (nice, but of no interest to me) than the market. Again, Friday was an important day and by the time I read your update so much had changed.
I am spending less time reading your premium updates and more time on your excellent email alerts. I also found this update light and wishy-washy ("The market could go up but it could go down..." variety of updates). Thankfully your alerts are more like the old PR style – forthright and punchy (70% chance of decline continuing – that is useful).
Also, your point about silver $15 – is that a genuine possibility or simply less than 5% probability? You have been a great market analyst/pundit in the past.
A: Premium Updates are dedicated to explaining the logic behind the calls that we make in the summary (or "summing up" paragraphs) and in the alerts. There are various ways one can use them.
The first is to make sure that what we suggest is well-founded (however, we feel that those who have been with us for a long time know that we always conduct very thorough research before suggesting any action - we might be right or wrong, but we always take our time to analyze the situation from multiple points of view and applying various techniques before making a call).
The second way is to use it as supplementary information in one's own analysis. We know that some of our subscribers prefer to conduct their own analysis of the market and only use our updates as a source of ideas for their own research.
The third is to use the details in the update to be 100% sure that what we wrote in the alert/ summaries is really what we meant. We strive to be as clear as possible in the summaries, but we're only human and at times it will not be crystal clear.
The fourth way of utilizing Premium Updates (for those who are short on time) is to review the summary, the "summing up" paragraphs, the Letters to the Editor section and Additional Information (to stay on top of the most current events and news).
Our Premium Updates are becoming longer and more complex than what we used to provide in past years, so we introduced the "summary instead of notification" email messages. Right now the summary of the update will be delivered to your email account, so if you want a short, to the point ("old PR style"?) message instead of a lengthy analysis, you have it. If you want details, simply click and enjoy the update. If not, you can treat the Premium Update notification/summary as another Market Alert.
Regarding $15 silver - in our view that's simply a <5% probability. On a side note, do you recall the time when silver over $15 was an "unrealistically high" target?
Q: One vocal analyst is loudly predicting a stock market crash quickly followed by a panic flight to the dollar (and a gold dive). He sees this gold pullback as the prelude to a steeper decline. Your thoughts on this would be much appreciated.
A: We would be happy to discuss the points for a major crash followed by a panic flight to the dollar. While stocks could decline here (we think that they will correct substantially at some point, but not in the coming months), we doubt that they would take gold with them similar to what we saw in 2008. Markets saw very well that gold declined only temporarily and that it resumed the rally in the subsequent months. The next time that such a decline is seen, we might see a small decline in gold because markets will take into account gold's likely rebound. That is, of course, if gold doesn't need to correct due to its own extremely overbought status (which is currently not there).
Q: Are there any recognizable price patterns that occur right before and after elections that we could profit from?
A: Generally, the recognizable price pattern that we can expect is the stock market's rally into the elections, as that is what the Powers that Be will want it to do. At the same time commodity prices and - in particular - gold's price is something that the authorities don't want to see rallying, because these declining prices make it easier for them to say that it's ok to fund various politically appropriate programs (i.e. they buy votes) and to fund them with printed money: "Inflation threat? What inflation threat? We have deflation! Gold and commodities are declining, see?"
Consequently, we might expect weakness in metals and strength in stocks. Mining stocks are influenced by both, and this might be one reason for miners' recent strength. After the elections, metals are likely to rally once again - not necessarily immediately, but the uptrend should resume sooner rather than later. In fact we may see a bottom in metals even before elections as markets predict Obama's victory.
Q: What should we do with long-term investments if Romney is elected? Wouldn't that be dollar bullish and gold bearish for years to come? Your thoughts on this would be much appreciated.
A: We have previously answered the "what if Romney wins in November" question, so we will quote it here:
"Yes, such a scenario is possible and it is bearish for gold especially from the USD perspective. As we move closer to the elections and this scenario becomes more probable and media talk about it more often, people will take that into account while deciding whether to purchase gold or not, which is why gold may decline in the medium term. In fact, this is one of the more important bearish fundamental factors for gold (there are not many bearish fundamentals, though).
However, this does not have to stop the entire secular bull market in gold - in fact we doubt it. The first important reason for this is that such a move would likely be temporary. If the whole world starts devaluing their currencies and the US adopts the "strong dollar policy", the effects on the US economy in the medium term will be disastrous as exports will become uncompetitive. Unemployment would likely soar. Sooner or later people would probably want government to do something and that something would be inflationary. Bull market in gold would resume (if people would not turn to gold even before that based on the resulting economic turmoil).
The second reason is that the demand for gold from the rest of the world could well make up for the bearish bias resulting from stronger dollar. The bull market would continue, but at a smaller pace.
All in all, we don't view the "US austerity scenario" are something sustainable given the situation in the rest of the world. We could see promises of that and even some moves in that direction, but we view that this would be just a temporary phenomenon. Still, the threat of this taking place is something that could contribute to lower gold prices in the medium term."
All in all, we believe that the outcome of the election won't change much. If Romney wins, whatever austerity measures will be taken will likely be temporary and followed by more QEs and similar. In fact, if Romney won and fired Bernanke, as promised, then the new Fed Chief could actually have a similar approach toward printing money as Bernanke does.
Let's be realistic and imagine how Romney might be thinking right now. What do voters need? A promise that the currently unpopular decisions made by Obama will be replaced and that this will have a positive effect on the country and the US economy. Romney knows very well that cutting spending will be painful in the short and medium term and that he will become unpopular because of that. Will he really do it? Or will he just pretend that he believes in it, but when things get tough (unemployment rises, stocks plunge etc.) will he prefer to be viewed as the nation's savior that helps everyone by "further stimulating the economy, saving jobs and actively fighting for prosperity"? In other words, going back to increasing spending? What would give him more votes in the future?
If Romney is elected, we expect nothing more to be seen on the precious metals market than perhaps a several-week correction. We might be wrong and we will continue to analyze charts to detect any changes, but this is what we believe is the most probable outcome right now.
Q: Thank you for the reply. I realize that you will fully explain this position on Friday, but I have to say it is disconcerting to receive an alert recommending staying out of miners while continuing to short metals.
Are you are expecting metals to drop but a corresponding miner's decline to be insignificant and not worth betting on, or too risky to bet on? I can see that position so long as your target for a metal decline stays above 1700. On the other hand, how do you explain the great volume of commercial shorts? Those guys, in that quantity, are not usually wrong.More importantly, what is the logic behind being out?
For Friday, does the recent action suggest we are not going to get much in the way of acorrection before the next big leg up? And give us your thoughts on the election - the overall view seems to be that Obama/QE is better for gold, but beyond that obvious conclusion I have to wonder how eager Romney would be to turn off the tap and crash the market, at least anytime in 2013. Thanks.
A: The point is that miners showed strength and we saw signals (SP Indicators) that suggest that miners will move higher. This invalidates the bearish picture for metals to a small degree, and it invalidates the bearish picture for the miners to a large degree. That's why we decided to leave the short position in metals intact while closing the one in miners.
The odds for miners moving to our target levels decreased and the short position in this case was no longer justified. Simply put, while gold could very well move to $1,700 or lower and silver move to $30 - $31, at the same time the HUI Index might be above 460.
The logic behind being out or shorting metals with your speculative (!) capital is this:
- metals moved far and fast during the August - September rally without a pause and were likely to correct after encountering strong resistance,
- the resistance was reached in the form of the 2012 high in the case of gold,
- gold made major headlines several times in September and everyone who could have bought gold at this point has probably done so (since a market needs fresh buying power/ more buyers for the prices to rise, at this time, price has to decline because there's nobody left to buy),
- the precious metals market showed signs of losing strength as the upswings took place on low volume around mid-September,
- gold finally broke below the rising support line several days ago and confirmed this breakdown for 3 consecutive trading days (actually, more than that at this point).
So, the correction was likely to be seen and we see signs that it has begun. That's why we're shorting the precious metals market right now, with speculative capital only.
=====================================
Q: As to the answer to the question from the subscriber in the latest PU. Generally I agree with this person. I expect you to analyze all information you have available and conclude clearly at the end. I personally don't have time to look additionally to other places after reading an already longish text - the PU. Sorry - that's what I expect from you.
A: We understand that for some subscribers a short summary is what is needed the most, so we have just started sending it out right in the email with the link to the Premium Update. So Premium Updates will be what they should be - subscribers' privilege, but not an obligation (on a side note, we know that some students say exactly the same thing about their lectures).
Q: It's OK that you distinguish between emotionless indicators and your subjectivedecision, and it's good that you mention this and make it clear. But the indicators themselves are for me a bit unclear in both ways: difficult to read graphically and the coming signals are not explained in a VERY CRYSTAL CLEAR manner. I'm sorry, maybe I am not smart enough to understand them but I have read the description of the signals coming from each and not everything is clear.
Basically for every single chart please make a very simple and crystal clear list of exactly 4 possibilities:
- "lower line broken upwards - meaning and action"
- "lower line broken downwards - meaning and action"
- "upper line broken upwards - meaning and action"
- "upper line broken downwards - meaning and action"
If you want to add some description, fine, do so at your discretion. But the list above is a MUST for me. If a signal is generated, an email (I would even welcome an SMS/ text message as sometimes you have to react immediately) should be sent. I don't want to check the site every 5 minutes to see if maybe a signal appeared. Or if the signals always appear at a given time of day then please indicate this clearly at the top of EACH page with the charts: "The signals always come at 5:03pm EST" - one simple clear sentence at the top.
- add a significant number of vertical lines to make the reading easier and the graphical resolution must also be large.
A: We have just updated descriptions below each chart – we particularly appreciate those suggestions. As far as generating an email automatically, we are not able to do that yet, because for now charts in this section are created semi-manually. Until the completely interactive version is 100% ready (and it's almost ready) we will upload charts manually and we will send notification emails manually. That's why it is currently not possible (again, not yet) for us to provide a definite hour at which a signal/notification will be provided.
Actually, the notification system that includes text/SMS notifications was prepared some time ago. It is one of the things waiting to be implemented right now.
Our next steps regarding charts and signals from indicators are making them bigger after they are clicked (enlarged). We will plan to check whether a stop loss can be determined for each indicator/ market individually.
Q: The statements about the price movements are unclear. You may even not be aware of that but you are most probably making some assumptions which are obvious for you but not for us. If you say "when the price falls/rises below/above" do you mean even one microsecond tick? 1 minute? 15 minutes? Closing price? The low of the day? I would expect more precise statements here.
A: One microsecond tick here is the default approach. If we say "sell when gold goes below $1,680", we mean even if it moves there for only one second. This is why we first send out an alert when such a level is broken, but we decide that it isn't significant because it is not confirmed by other factors. We realize that it would be ideal if we could provide you with all the possible outcomes and make you prepared for them in advance, but that's just not doable as it would require updates to be several times larger, which we simply could not write in a timely manner.
Q: Sometime you are pretty sure about a price move but at the same time don't suggest a speculative position or even discourage opening one. So how is this really? Are you really sure of the move (then suggest opening a speculative position) or are you not sure and that's why a speculative position is not suggested (in which case, don't say the possibility is 70 or 80% for that move!). Sometimes there are inconsistencies among paragraphs in the PU.
A: We apologize for any inconsistencies in the updates. We generally triple-check the final summary and double-check the "summing up" paragraphs, so the included information is the most important. If you have any doubt after reading it, please ask for clarification. We will always try to write it more clearly next time.
Probability is one thing and the expected size of the move is another one. It could be the case that while the probability of a given move is significant, the perceived (our assumption) size of the move is too small to justify opening a position.
(On a side note, that's why these are the factors we take into account in the Position Size Calculator - the tool that will tell you how many options of different maturities it makes sense to buy at most with a given price move in mind.)
Here's a thought-provoking example: if we believed that there is a 70% probability that the market would move 1% higher in the following 2 weeks, but at the same time there was 30% probability that it would decline 20% in these 2 weeks, we would suggest shorting the market with a very small amount of capital. We would probably lose this trade (70% probability), but we would lose a very small amount of capital. That's right - we would suggest shorting the market even if the probability of winning was only 30%.
As trading is not a one-time event, but a process, there would be a time when we are faced with a similar situation. We would once again short. We could lose again, but again a very small amount of capital. On average as this situation would repeat itself we would lose 7 out of 10 trades (70% probability of losing). However, the 3 times that we would actually win, would make us so much money that we wouldn't even care about the 7 losses. If one aimed for winning most trades, they would lose money over time - shocking, isn't it? The focus always has to be on making money in the long run, not on winning or losing one single trade. The problem is that it's counterintuitive and tough emotionally. By following this approach we will also get many messages from people who believe that constant winning trades are necessary for making money in the long run, and who believe that we're not doing a good job.
For instance, being prepared for a major plunge in precious metals prices earlier this year was this type of situation. It was likely to happen in our view, but it didn't, and we got back after missing some of the rally. That's certainly nothing to be proud of per say, but thanks to this approach when the major top in metals (and a subsequent major plunge) does materialize, we will probably be ready for it and that is when this approach will pay off big time.
However, until that takes place, we risk losing subscribers when they become upset with us after missing part of the rally. In fact, we're sure that if we never suggested getting out of the long-term investments, we would have more subscribers at this time. This being the case, we consciously accept the fact that we will bear the cost of this approach (those who resign from our services after being unhappy will probably not rejoin after metals do plunge as they will not be aware of our analysis at that time) in order to maximize your long-term rate of return. We simply care about you too much to give you less than what we believe is the best approach, even if we can make more money doing so. Being ethical costs, but this is the only way that we will provide our services.
Q: Also… Your suggestions/ conclusions on the technical side often conflict with the fundamental part of the PU. For instance, you say there will be a meeting of some importance, everyone expects it, and then you say based on TA that the price will be in the opposite direction from what others expect after this meeting. I have a feeling that TA is no longer very accurate in this cycle.
A:We could move the tops of the updates to the Publications section (where other light readings and interviews are located), so that these two don't seem contradictory. What do you think? We comment on the news to show you that we are keeping an eye on it and to tell you how it fits the long-term picture. They rarely determine the short-term outcome by themselves. Technicals drive markets in the short term. We have too many years of experience in the market to think otherwise. An open-ended QE was recently announced – why have metals declined since then? Because they were overbought - this is a technical term, not a fundamental one.
Q: (...) So with each price peak, I'm opening with a smaller and smaller long position (CFD) (to average the entry point) because, well… this guy has some certificates, some knowledge, so he should be right. He's saying 60-80% chance for a rally. Fine let's go long. The gains will be even bigger and when the price is at a total low, you finally admit, "OK, sorry, I was wrong, it's not going up". But why the hell THAT late when it was obvious earlier?
A:With all due respect, why would you hold a speculative long position if it was obvious (i.e. 100% probability) to you that the market is going lower? It was certainly not obvious to us. We hold a position as long as we believe the risk/reward situation justifies it, so we will usually suggest closing a position (if the size of the move is reasonable) when the probability for a given move goes to or below 60% (in this case an obvious situation would be 0%).
Most importantly, when we repeat over and over again that a given move is 70-80% probable (or any other probability) it doesn't mean that you should automatically add to your position. An increase in the probability would imply an increase in the size of the position, and the same would be the case with an increase in the size of the expected move. However, the potential size of the move has a much smaller impact on the size of the position than the probability. (We can provide a more detailed discussion of this topic if we receive more questions - or you can make some simulations with the Position Size Calculator yourself).
Q: Anyway I was asking [Editor's note: in earlier messages] about some form of interactivity on the new website so the readers can exchange their views/opinions. Is it going to be implemented?
A: Yes, there will be a whole section dedicated to interactivity - it will be called "Your Ideas", where you will be able to add, discuss and vote for ideas (generally questions that we include in the updates are also "ideas" in a way).
Q: Lastly, it would really show us how transparent and open you are towards your readers if you provided us a list of every single trade (long-term and speculative) you have suggested for the last 5 years and the gain/loss on each one(Editor's note: in order to estimate their efficiency).
A: In previous years there was no defined format for a transaction notification and there were periods when we didn't make specific trading suggestions, but provided only general commentary on the market. Sometimes we did not make any suggestions about position size, and sometimes we said that a given position is only for risk-seeking traders. There were also times when we only suggested option trades. All of this makes it very time-consuming to create such a list and to make it really useful (we would need to simulate various position sizes, trader profiles, instruments, simulate option prices in the past, and average the outcome). We believe that it will be more useful for our subscribers if we use that time for developing new tools, adding a stop-loss feature for signals from our indicators, add a text notification system, add a "Your Ideas" section and many other features that will make you more profits. At the same time, we do provide everything that we have ever posted/sent out for your review. There was one update that included a description of some signals from the past, but unfortunately there are no other analogous ones.
The last time we checked (last year) very few services provided their archives, and some even required additional payment for access to them. So, we are transparent, but we want to use our time in a way that is most effective to our subscribers in general. If you believe that we should dig into previous updates at the expense of providing new features (ETF/ ETN ranking with over 100 funds, new tools, the abovementioned features), let us know. If we get many requests, we will do it (after all, we work for you), even though we believe it's not efficient.
======================
Q: Just a short note to express my appreciation for the excellent dissertation you provided in response to my questions. In fact, it was so thoroughly informative I have yet to think of anything else I might ask along these lines! But seriously, it was a great help to me, and I'm certain to many others as well.
A: Thank you for your feedback. In fact, everyone always benefits from good questions. Last week's reply likely contributed to other detailed questions/suggestions that we received this week, and as we reply and implement changes you benefit because of improved service and we will ultimately also benefit from your satisfaction, for instance when you recommend us to your friends.
Q: I have three thoughts at present:
First, I think the term 'coiled spring' to describe PMs has never been more accurate than it is now, especially with the elections so close. So with all due respect, I am just sitting on the sidelines hoping for a good temporary decline/opportunity. But I think changes could be fast and furious, so...
A: Of course, you can utilize our analysis in any way you want. You can think about our service as an option - just like this financial instrument, you have the ability, but are under no obligation to follow it. If you're not convinced about shorting the precious metals market now with the speculative capital, don't do it. If one is not ready for a position emotionally, they will likely close it prematurely or much too late anyway. If you're waiting for a moment to go long - rest assured we will provide it.
Q: Second, I would ask that for the next month or so (or until we go long again) you pay special attention to getting out any Alerts before the market closes for the day, for two reasons: First, much of the action is happening overnight these days. Second, some of us can only move large dollar amounts at market close, not intraday, so that overnight, and then the next day, all day, action can add up.
A: We'll always try to send out Market Alerts as soon as possible, meaning that we will send them as soon as we believe there's something that you should know. We strive to send them out at least one hour before the markets close. And yes, we will make an extra effort to send them as soon as possible while the short position is still open.
Also, we apologize for sending Wednesday's Market Alert just before the end of the market session. We wanted to send it out about an hour earlier, but we had a technical problem with our email sending system. We implemented changes to send reminders about the need to update the payment system only to those who haven't done so yet. Unfortunately, not everyone updated their accounts as of that time. We immediately notified our top IT specialist, but it took some time before we were able to send the message.
We have an idea on how to improve the email alert system. From now on, if information in the market alert will be time-sensitive (i.e. about opening or closing positions), we will send a notification that the message is being created. We will also post a note on the homepage and on the list of premium updates on the website that a new Market Alert is under construction and that you will likely receive it within an hour (we will let you know more or less when you can expect it in the notification). This way, you will start being notified as soon as possible. What do you think?
Q: Third, any thoughts about SANDSTORM (SAND)?
A:Technically, this company looks very promising. The uptrend in the SAND chart is clearly visible and the SAND:GDX ratio shows the same. The company is too big to be included in our junior list because its market cap is bigger than GSS, which is in our senior ranking. And we can't include it in the senior ranking just yet, because it has not had enough high-volume days so far. We don't view the relationship between the company's stock price and the price of gold to be stable yet (which is a big deal when it comes to Golden StockPicker's selection criteria). But yes, this stock looks good.
Summary
The medium-term outlook for the USD Index is rather unclear but more bullish than not. A sharp rally is unlikely at this time with the election fast approaching. A strong US Dollar could hurt stock prices. For this reason and the current technical analysis, stocks generally have a bullish outlook today.
One very interesting phenomena this week was the lack of rally in the precious metals in spite of the positive signals in place from the USD Index and the general stock market. The strength of reaction of the metals to the daily downswing in the dollar was limited. Metals’ reaction to the dollar’s strength was significant, however. This means that sideways trading in the USD Index would likely result in lower precious metals prices, and, if the USD Index moves slightly higher, the metals could very well move sharply lower.
Gold mining stocks and silver mining stocks hold well in general – despite Thursday’s downswing – and it seems that even if the correction takes them lower, they might not decline as low as we originally expected.
Our price targets remain in place:
- Gold - $1,680 - $1,700
- Silver - $30 - $31
- GDX ETF - $48
- HUI Index - 450 - 460.
The probability of these targets being reached in in the next 4 weeks is 70% in case of gold and silver and 60% in case of the HUI Index and the GDX ETF.
Long-term investments: remain in the market with your precious metals holdings
Trading – PR: Short position in gold and silver (not in mining stocks).
Trading – SP Indicators: No position.
Alternatively, you for greater clarity, you can check the current positions in the table below:
| Portfolio's Part | Position |
|---|---|
| Trading: Mining stocks | No position |
| Trading: Gold | short |
| Trading: Silver | short |
| Long-term investments | long |
We may soon suggest closing short positions and going long as our Extreme and Extreme #2 Indicators suggested. We will continue to monitor this situation and keep you informed as necessary.
Earlier this week we told you that we will provide you with details regarding the performance of each of the SP Indicators. We are happy to inform you that a section with performance of our gold & silver indicators has just been released. You will find average performance of each of the indicators along with our comments and default actions that traders are to make based on them (we call them default, because we understand that some traders might use them in a different way based on signals and their performance).
Thank you for using the Premium Service. Have a profitable week and a great weekend!
This completes this week’s Premium Update. Our next Premium Update is scheduled for Friday, October 26, 2012. Of course, we will continue to send out Market Alerts whenever appropriate.
Przemyslaw Radomski, CFA

