
Your editor has been diving last week in some of the most stunning coral reefs in the world in the Egypt's Sinai Peninsula. Once you get into your gear you dive into a silent, hauntingly beautiful world teeming with fish in psychedelic colors and a great diversity of marine life.
As you dive deeper the pressure becomes higher and the buoyancy decreases. Conversely, when you swim higher, at a certain level you feel that you're being pushed even higher as the buoyancy increases. The is analogous to what just happened in the precious metals market - as gold and silver moved above the resistance line, their "buoyancy" increased and it now became much more likely that they will rally further.
The coral reefs are similar to today's global economy. Like the economy, the fragile marine ecosystem is in rapid decline and, in some places in the world, on the verge of collapse due to over-exploitation, pollution and climate change. Conservationists say that to save the coral reefs will require massive government intervention.
Sounds familiar?
Speaking of government intervention, yesterday gold was little changed before the key Federal Reserve policy decision, a day after a German court ruling in favor of a euro zone rescue fund. The decision centered on challenges to Germany's participation in the 500 billion euro ($639.3 billion) European Stability Mechanism, or ESM. Critics charged that the treaty behind the ESM robs Germany's parliament of its constitutional authority over the country's budget and had asked for an injunction to prevent the country's president from signing it into law. In other words the Court ruled that it is constitutionally permissible for Germany to finance the debt of other nations.
The decision means the eurozone finally has two robust financial defenses against the debt crisis. The bailout fund will take its place alongside plans by the European Central Bank to buy unlimited amounts of short-term government bonds issued by troubled countries. The ESM can support countries by loaning them money, while the ECB bond purchases could lower the painfully high borrowing costs that are threatening Italy and Spain. Additionally, the ESM is also expected to join in purchasing bonds to support the ECB effort. Yet both the ESM and the ECB bond purchases are only stopgap measures. They can give governments time to reduce their deficits and cut debt long-term by reforming their economies so they can grow faster. One wonders if the countries will bite the bullet or to delay once the pressure is off, as they have during previous lulls in the crisis.
The news of the German court decision Wednesday sent bullion to its highest since the end of February. Also investors were hoping that the Fed will announce another round of quantitative easing, (QE3) at the conclusion yesterday of a two-day policy meeting. Such news would be considered positive for gold, as injections of liquidity into the market tend to benefit the yellow metal.
What investors got from the Fed was something much bigger than QE3. What we got was an open-ended QE. $40 billion will be pumped into the U.S. economy each month until further notice. Just as if the endless QE wasn't enough, the Federal Reserve has maintained its funds rate at 0.0%-0.25% at least until mid-2015.
The above is not important only per say, but also because it is something that exceeded market's expectations. Consequently, we didn't see the buy the rumor, sell the fact type of reaction – what happened was bigger than the rumor, so markets got another positive impact.
This is a major bullish fact for the precious metals market. As Europe and the US continue their inflationary race, precious metals rally – and they should rally much higher – endless QE means that they virtually have to.
At this point, it seems that higher precious metals prices will be seen this fall and winter.
Meanwhile platinum continues to surge upwards due to labor unrest in South Africa's mines. Machete-wielding strikers forced the world's No.1 platinum producer Anglo American Platinum to shut down some of its South African operations, sending spot platinum to a five-month high of $1,654.49. The price has risen by nearly 20 percent since a strike at the Lonmin mines turned violent last month, leaving 44 dead and dozens injured in clashes between police and striking workers.South Africa produces about 80 percent of the world's platinum.
We recall with some nostalgia that it was last year on September 6, that gold hit an all-time high of $1,923. This of course reminds us that a month before that the credit agency Standard & Poor's stripped the United States of its AAA rating on its bonds after partisan wrangling over raising the government's debt limit led the nation to the brink of default. And now in addition to nostalgia we get a feeling of déjà vu. This week the U.S. just received another warning of a credit downgrade, this time from Moody's Investors Service. The credit agency said Tuesday that it would most likely cut its Aaa rating on United States government debt, probably by one notch, if Washington's budget negotiations failed. In its report on Tuesday, Moody's said it was difficult to predict when Congress would reach a deal on the budget.
When George Soros speaks people usually listen. Soros is a strong supporter of European integration but a longtime critic of Germany's eurozone crisis management. In his usual forthright manner, Soros said in a speech this week that Europe's recession will intensify and spread to Germany within six months.
“The policy of fiscal retrenchment in the midst of rising unemployment is pro-cyclical and pushing Europe into a deeper and longer depression,” Soros said in prepared remarks in a Monday speech in Berlin. “That is no longer a forecast; it is an observation. The German public doesn't yet feel it and doesn't quite believe it. But it is all too real in the periphery and it will reach Germany in the next six months or so.”
Soros said Germany needs to abandon its demands for austerity in other countries and embrace the continued fiscal unification of the region or leave the euro zone itself. (Recently, German politicians, led by Chancellor Angela Merkel, have begun signaling greater comfort with monetary debasement.) Soros also said it would be preferable for Germany to stay in the euro zone and work to boost growth, activate a debt-reduction fund and guarantee common bonds.
It's now time to dive into the beautiful world of charts and technical analysis. Just as this and last week's developments were of long-term nature, we will mostly focus on long-term charts today. Let's begin this week's technical part with the analysis of the US Dollar Index (charts courtesy by http://stockcharts.com.)
USD and Euro Indices
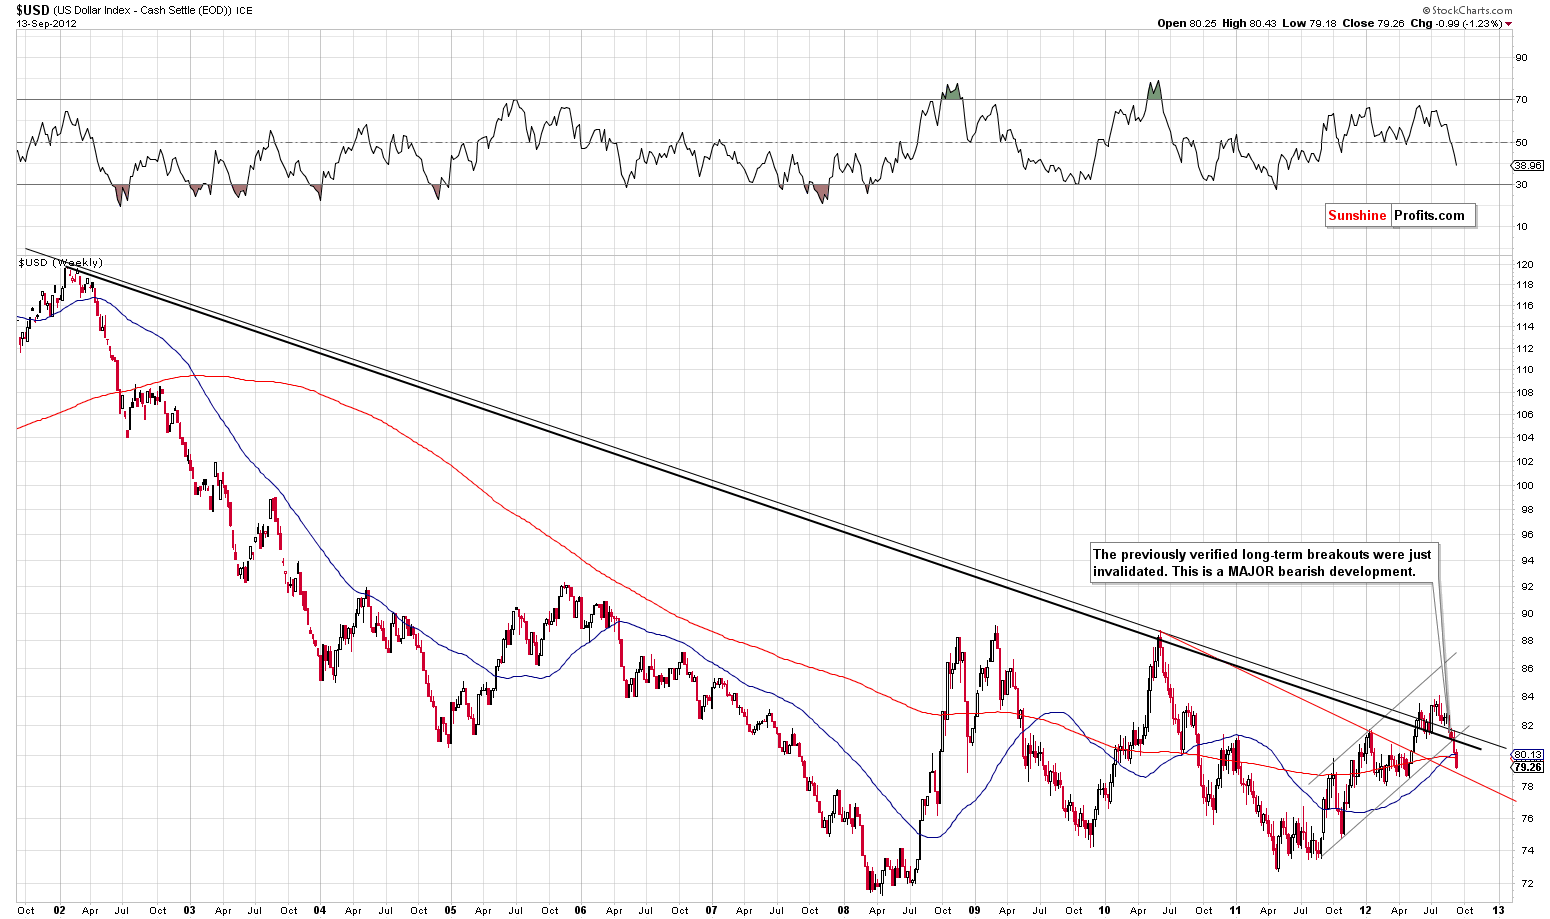
We begin this week with a look at the long-term USD Index chart (please click the above chart to enlarge). We focus on this chart to analyze the USD Index because this week's moves have long term and medium term significance. The short-term picture is really not relevant based on this week's price action, so its chart is not included this week.
Two breakouts were invalidated this week and this was truly a very unlikely development. Just by the term itself, breakouts normally hold and are generally not invalidated. The previously broken resistance line normally becomes a support line. With two breakouts being invalidated this week, a true sign of weakness in the USD Index is clearly seen and points to a bearish outlook for the months ahead.
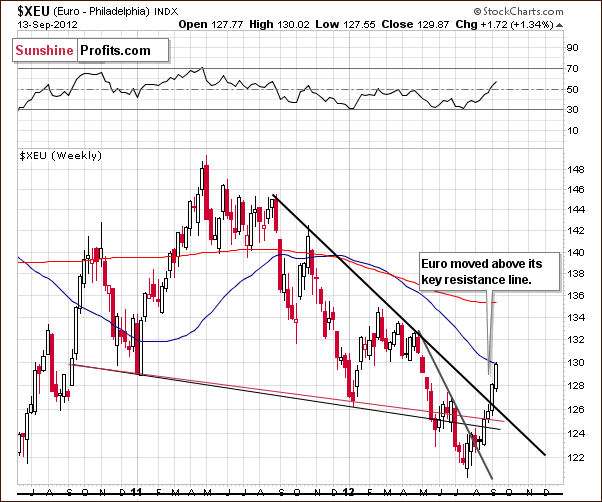
In the long-term Euro Index chart this week, we have quite the opposite situation as compared to the dollar. Now it's not that the euro is showing strength, but rather the dollar has simply lost much of its appeal relative to the euro and this makes the euro look strong.
The breakout in the euro this week is a bullish phenomenon. Price levels have moved significantly above the previously broken resistance line and the picture is clearly bullish.
Summing up, the medium-term picture for the Euro Index has changed this week and is now bullish. Conversely, the outlook for the USD Index has turned to bearish.
General Stock Market
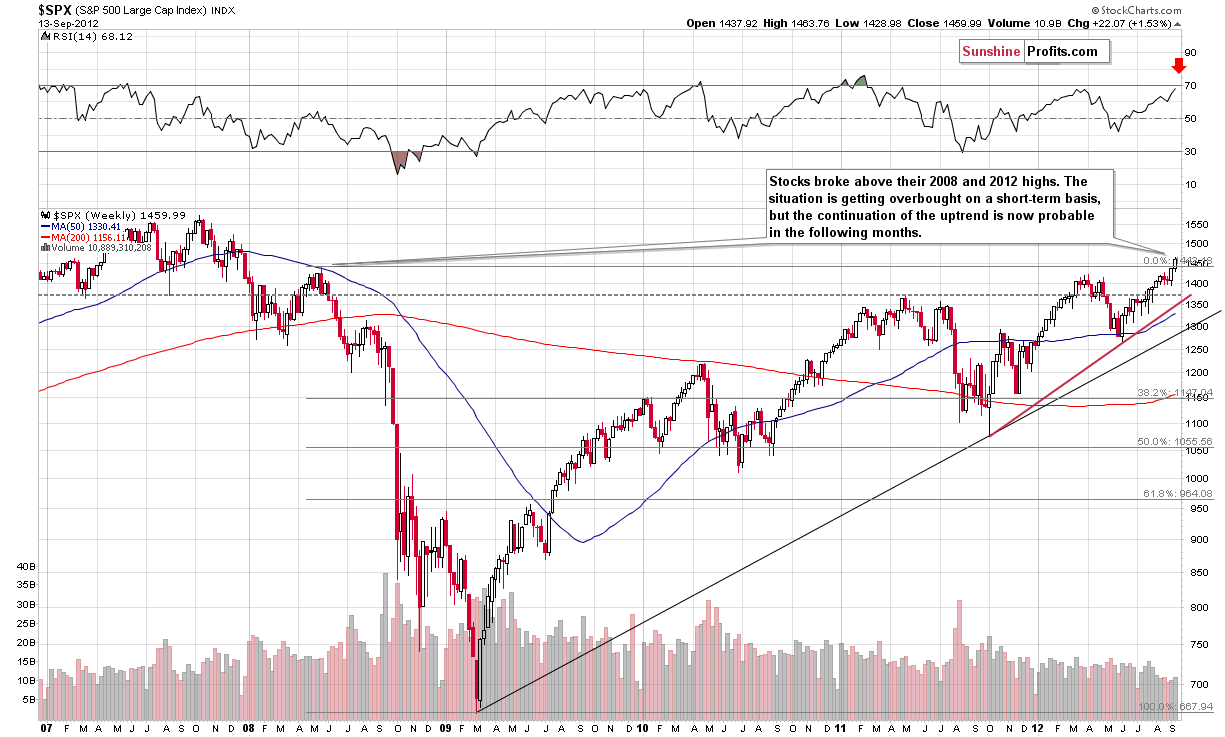
In the very long-term S&P 500 Index chart (please click the above chart to enlarge), we see a major breakout this week above the 2008 and 2012 highs. This is an important bullish development, and the markets could very well move much higher from here. The next significant resistance line is at the 2007 highs, at 1550. A move to this point appears to be very much in the cards although a consolidation could be seen first.
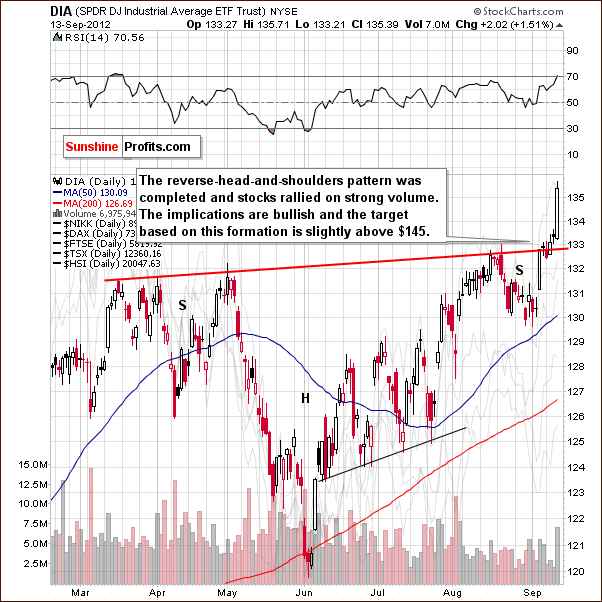
In the short-term DIA (a proxy for the Dow Jones Industrial Average), we see a reverse head-and-shoulders pattern which has now been completed as stocks rallied on Thursday. The RSI level is above 70, which suggests that a pullback is likely. It seems however that unless the price level here falls below $133, the picture will remain bullish for the short term. The target based on the reverse head-and-shoulders pattern is $145, which is very much in tune with the 1550 target for the S&P 500 Index.
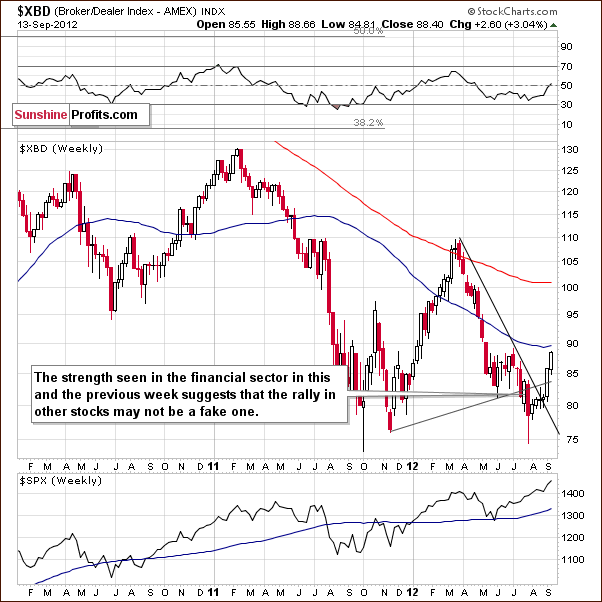
In the Broker Dealer Index chart (a proxy for the financial sector) we have seen strength both this week and last week and this is an indication that the recent rally in stocks is not a fake. The implications here are bullish for the short term especially given that the financials often lead the other stocks (higher or lower).
Summing up, stocks have rallied strongly this week and the new upside target level appears to be at the 2007 high or slightly above the 1,550 level. The analogous target for the DIA ETF is $145. After these targets are reached we expect some kind of consolidation and a breakout into new highs - based on “market steroids” in the form of open-ended QE and low interest rates.
Correlation Matrix
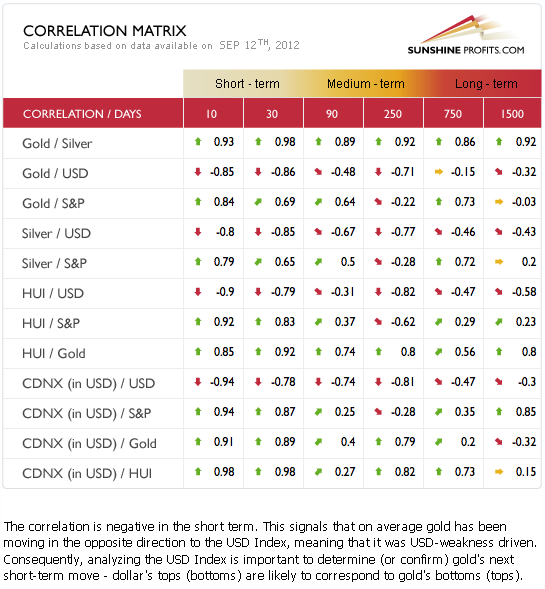
The Correlation Matrix is a tool which we have developed to analyze the impact of the currency markets and the general stock market upon the precious metals sector. The developments in the markets this week have bearish implications for the USD Index and have created a bullish outlook for stocks. This combination has resulted in a rosy picture for the precious metals. The classic mode is in place in this week's correlations as the miners have moved with stocks and in the opposite direction of the dollar.
The announcement of QE3 along with a promise to keep interests rates at or near zero through the middle of 2015 has helped to keep these correlations intact. The outlook for the precious metals – based on USD Index and stocks – is bullish for the medium term.
Gold
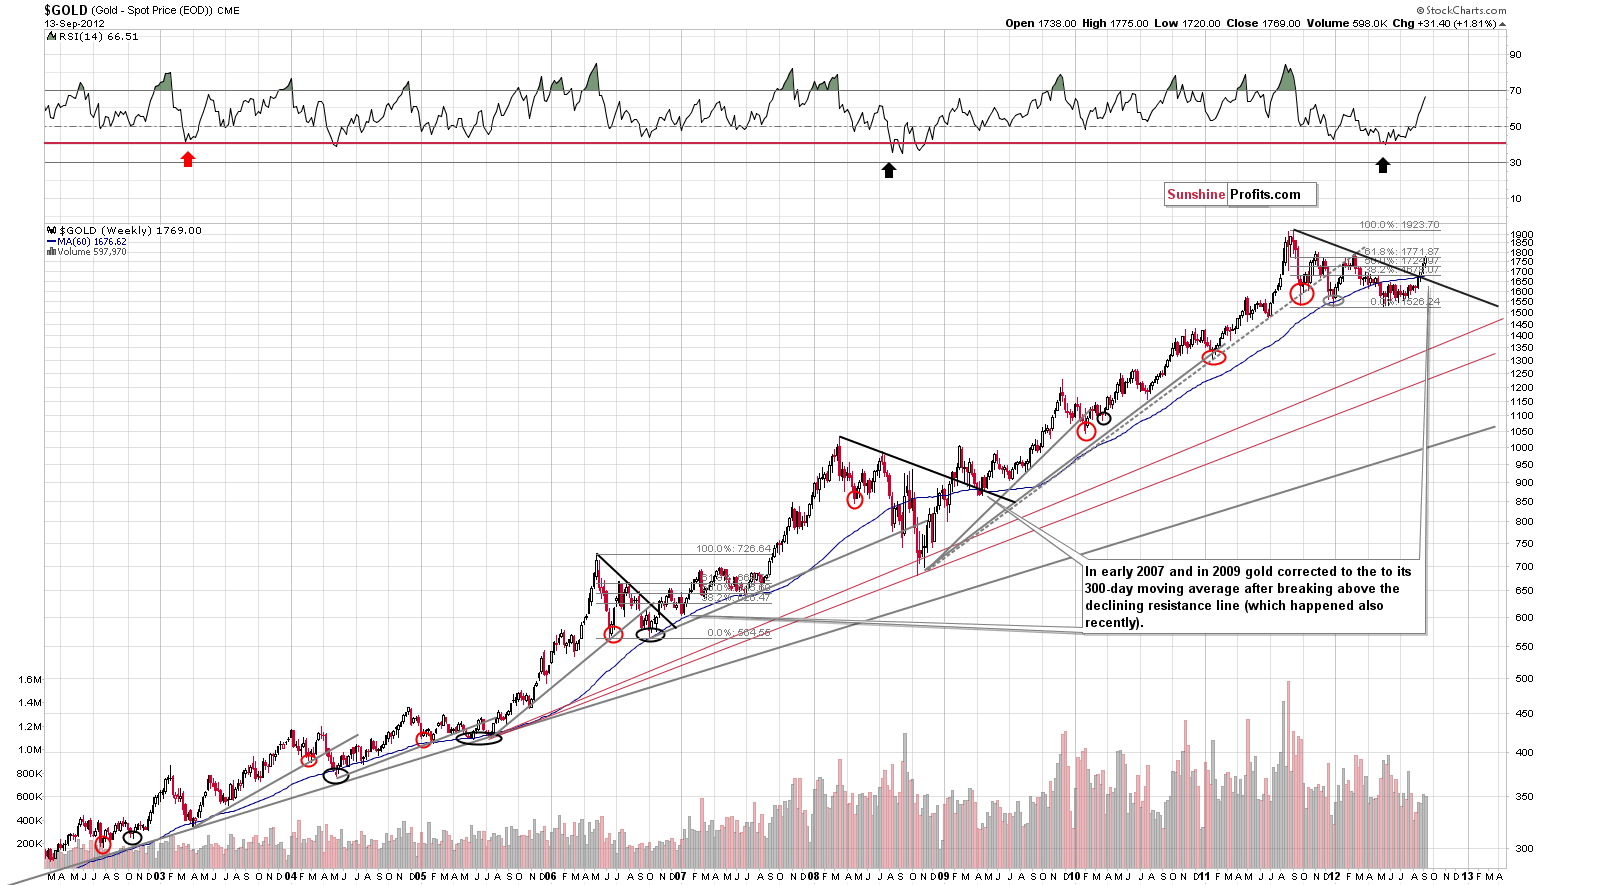
In gold's long-term chart (please click the above chart to enlarge), we see a major breakout that took place previously. As we indicated in the previous updates and alerts, this is the most important event seen on the gold market so far this year, as it is an indication that the consolidation pattern in gold is over.
However, on a short-term basis, the gold market is overbought and a correction is quite likely. How low can it go?
We have observed an interesting pattern, which is quite similar to breakouts which formed back in 2009 and also in 2006. In both cases, the corrections which followed took gold close to its 60-week (300 days) moving average, a support level which is just below $1,680 today. Although we may see gold reach this level, a significant decline from today, such a move would not invalidate the bullish picture at all. It would rather present a great buying opportunity!
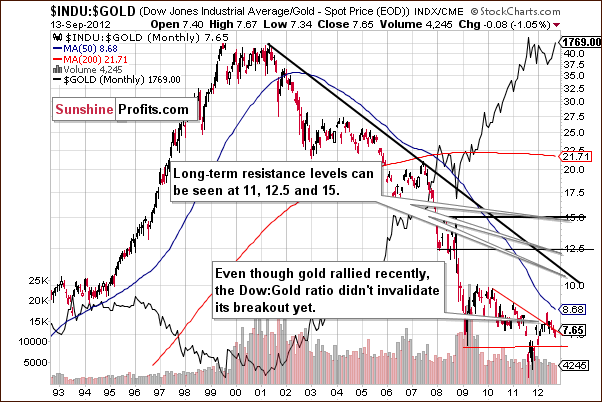
In the Dow to gold ratio chart, we have not yet seen an invalidation of the previous breakout. The jury is still out on this issue and with rallies in both gold and stocks this week, the relative performance between them is pretty much unchanged.
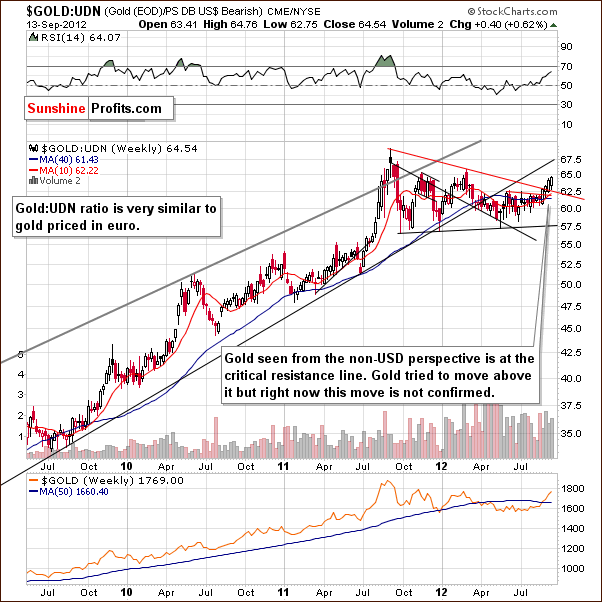
In this week's chart of gold from the non-USD perspective, we also see a breakout which confirms what we've seen from the traditional USD perspective. The outlook for the medium term is now bullish here as well.
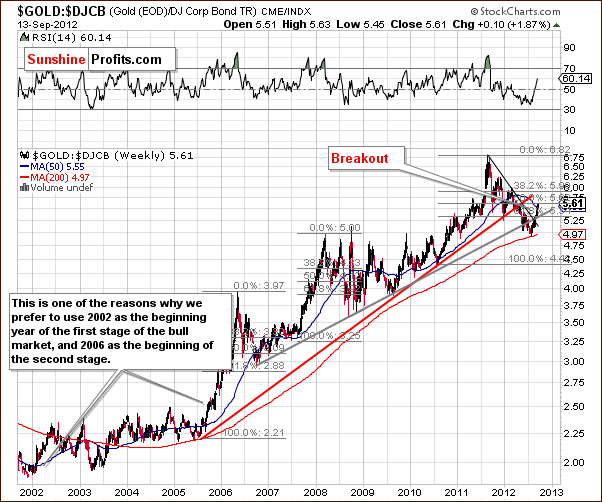
Finally, we have the same indications in the gold to bonds ratio chart. The previous breakdown here has been invalidated and such action is a bullish signal by itself. Please note that the short-term declining trend has also been invalidated.
Summing up, there are strong bullish signals right now in the gold market and the medium-term picture is bullish. For the short-run, however, it's not quite as clear with RSI levels indicating an overbought status following this week's rally. It's probably best to wait a bit before entering speculative long positions, but long-term investment capital seems best kept in at this time.
The most probable outcome in our view here is that we'll get another rally, to the February high - $1,780 - $1,790 and a correction will be seen after that. The correction would not take gold below the previously broken resistance levels (which have turned into support) and it would be a good idea to enter long speculative positions as soon as gold moves below $1,700.
Silver
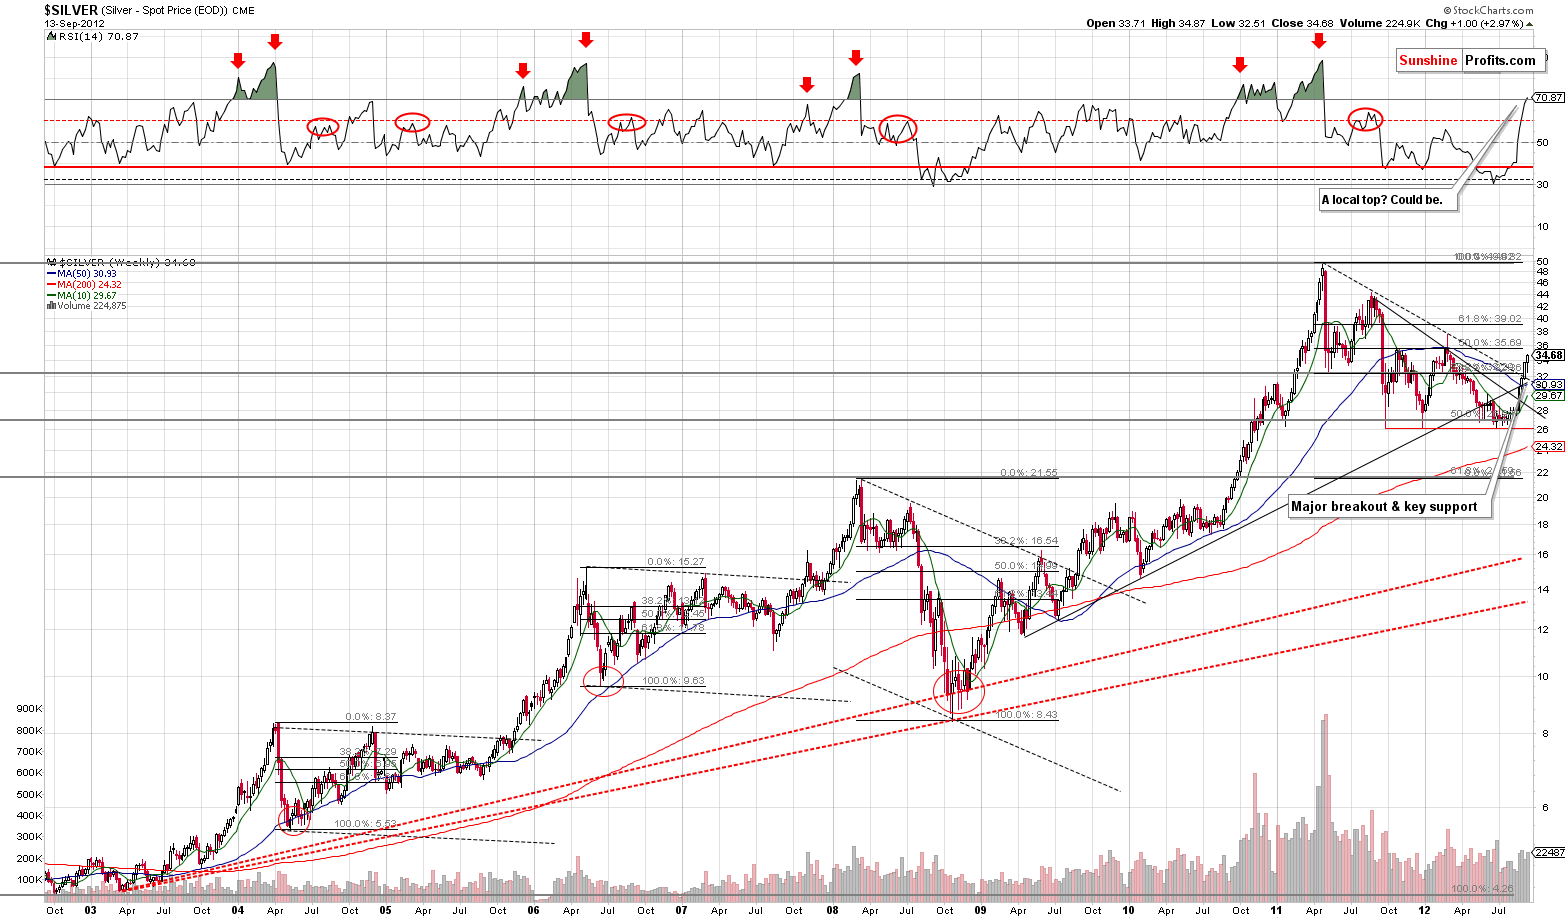
The long-term chart for silver this week (please click the above chart to enlarge), generally confirms what we saw in this week's analysis of gold charts. A breakout has been seen here, and a correction back to the $31.50 level or so may be seen. The RSI is slightly above 70 suggesting that a local top will likely be seen soon.
Some sort of consolidation usually follows when silver breaks out above the resistance line created by previous tops. We saw this in 2005, 2007 and 2009 (dashed lines on the above charts) and we could very well see it again.
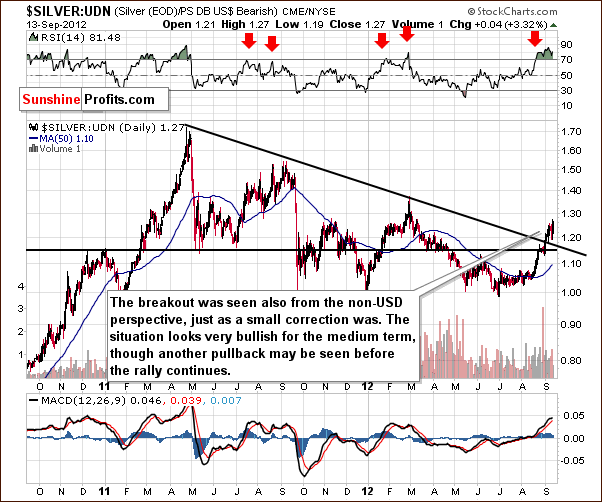
In this week’s chart of silver from the non-USD perspective, similar things are seen. We have a breakout, but for the short term, an extremely overbought situation. A correction would not be surprising here, even though the medium-term outlook is very bullish.
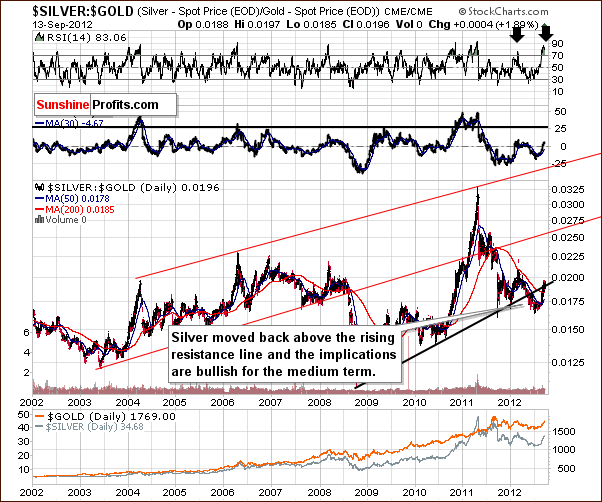
In the silver to gold ratio chart, similar implications are present. The ratio is back above an important support line, and with RSI levels extremely overbought, a pause here appears likely.
Summing up, as with the situation for the yellow metal, the long- and medium-term outlooks for silver are bullish but the short term is a bit unclear at this time.
As in the case of gold, we could see additional move higher in silver (slightly above $35) followed by a decline – to the $31.50 level and then a continuation of the rally.
Platinum & Palladium
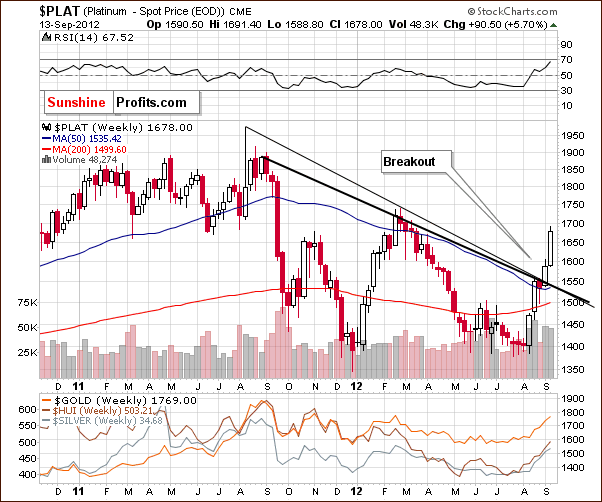
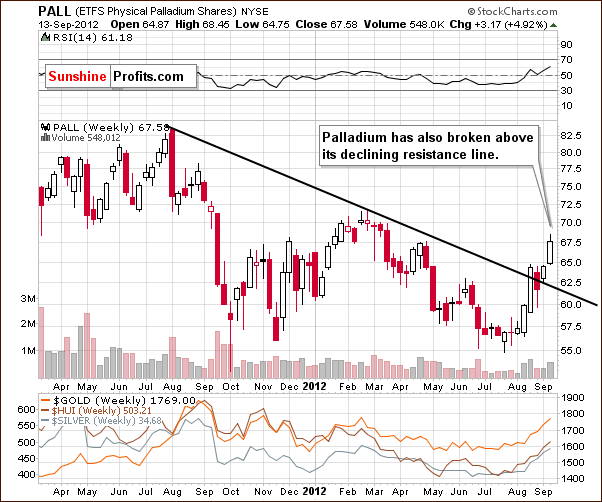
In both the platinum and palladium charts, we have similar confirmations of the medium-term bullish outlook now present across the precious metals sector. Breakouts have been seen here as well and strongly suggest that moves to the upside will be seen in the months ahead (though not necessarily without any corrections).
Mining Stocks
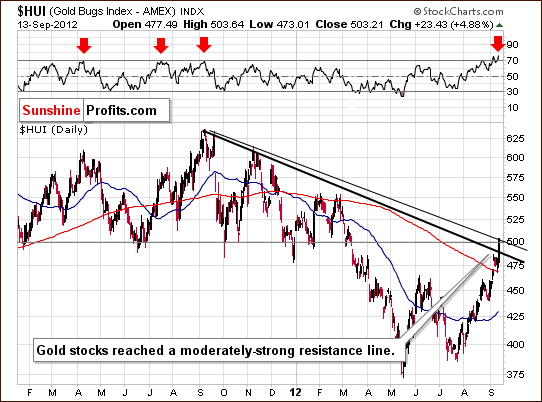
In this week's short-term HUI Index chart, we have a bit of a bearish situation. With the index reaching the psychologically important 500 level this week, a level which has often provided support in the past, we could very well see it serve as resistance this time.
A moderately strong resistance line is also in place, one which is based on two local tops which were quite close together. The situation would be more bearish if the previous tops were father apart as this would make the resistance line a bit stronger.
In short, it is a tough call as to how low the index will go from here. Our best bet seems to be in the 450 to 460 range based on previous local tops. With RSI levels extremely overbought, it seems that a local top is quite likely very soon.
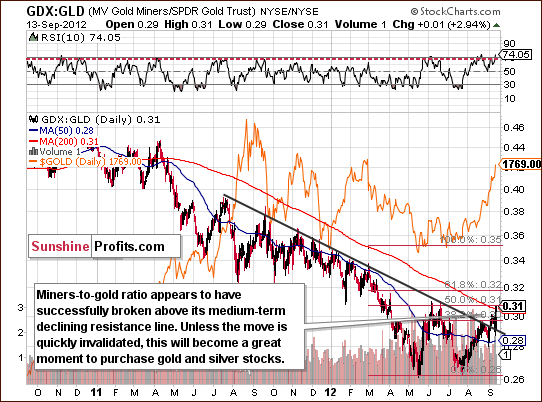
In the miners to gold ratio chart we also see a breakout this week and this is important and encouraging for mining stock investors. The ratio has been struggling for a month to break out and we finally see a convincing move above the resistance line.
If a correction is seen and the ratio does not break below the support line, this will be a strong signal that miners will outperform gold in the month to follow. In exciting related topic, next week a brand new tool (in our new website; actually two tools: one for gold and one for silver) will be at your disposal for selecting mining stocks and rebalancing your mining stock holdings.
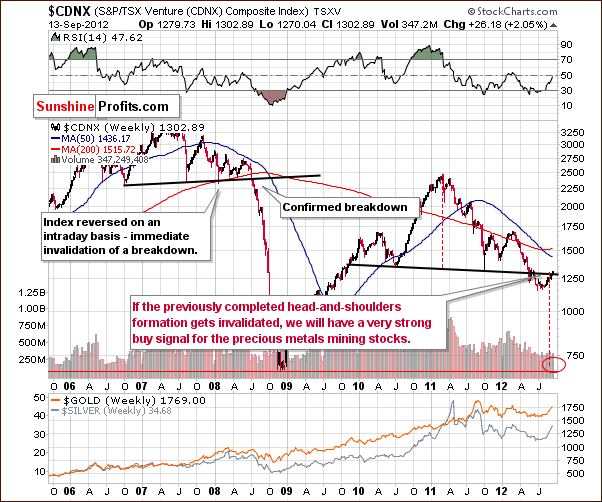
In the Toronto Stock Exchange Venture Index (which is a proxy for the junior miners as so many of them are included in it), it is clear that the head-and-shoulders pattern is in the process of being invalidated. It is a tough call as to whether it will be invalidated or not as a big move above the 1300 level is needed to invalidate the pattern and to turn the situation to very bullish here. This would of course be very good news for mining stock investors and especially those who focus on juniors.
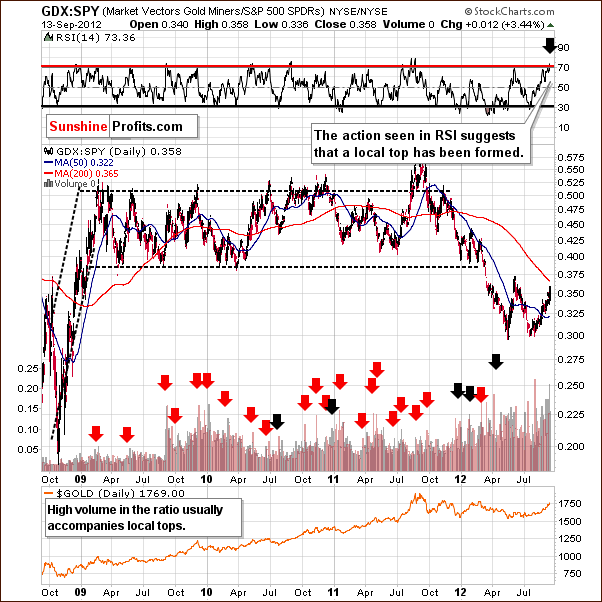
In the miners to other stocks ratio chart, we have some bearish indications with RSI levels now above 70. In the past, this was often seen when local tops were in so it is likely that the top may be in already or very close. A move lower in this ratio would be as a result of the miners underperforming the other stocks.
Summing up, the situation is particularly interesting this week as the HUI Index chart is rather bearish with RSI levels in overbought territory. The miners, however, are beginning to outperform the underlying metals and this bodes well for the future performance of the mining stock sector.
Sunshine Profits Indicators
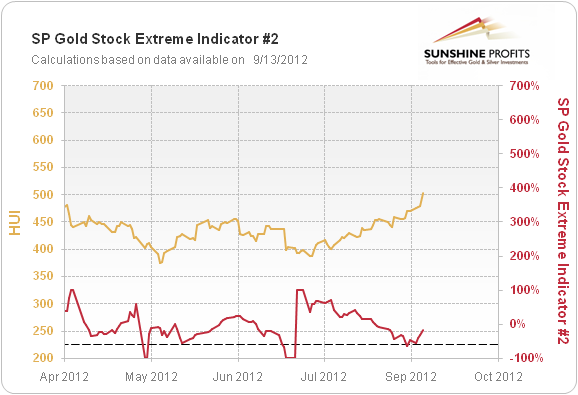
On September 7th, 2012, one of our indicators flashed a buy signal which confirmed what we outlined in the September 2nd, 2012 Update. At that time we wrote that if gold holds above $1,675 for 2 more consecutive trading days, we suggest getting back on the long side of the market (buying metals) with both: long-term capital and speculative capital (thus closing short positions and going long gold).
That was the case, and we saw additional confirmation thereof in the form of a buy signal from our Extreme #2 indicator. The medium-term trend is clearly bullish right now. If the correction is seen in the precious metals in the following days, as described earlier in this update, we expect the bottom (and a great buying opportunity) to be confirmed by at least one of our indicators – just as previous important bottoms were (see the above chart for details).
Letters from Subscribers
Q&A: We were asked what one should do if they did not move back to the long side of the market at all (including their long-term investment capital). The answer is the same as if one was already long with their investment capital: put long-term investment capital in the market, and take speculative capital out. This means going back in with one's long-term capital now. If it's too difficult to do psychologically, then please get back in with at least half of your long-term capital and promise yourself not to wait longer than one month before putting the other half back in (if a decline is not seen in the interim).
Q: What happens if silver plunges below 31.5 and gold plunges below 1670?
A: If these moves are confirmed, then we'll probably turn bearish, however this would depend also on other factors. At this time such a scenario appears rather unlikely.
Q: In January 2007 the USD Index was at the same level it is now, i.e. around 82. So I looked at “GLD” and saw a 155% increase over this time. Has any of the following occurred?
(a) the US money supply increased by an amount that one can mathematically/ technically equate to this "GLD" increase (given that the USD Index in these two periods is the same).
AND/ OR
(b) inflation contributed by rising enough to justify/ quantify this "GLD" increase in a similar way.
AND/ OR
(c) the USD lost enough purchasing power to contribute to this "GLD" increase when the USD Index was/ is at the same level for January 2007 and today.
Can you mathematically or technically clearly explain this difference so that one can evaluate whether gold has indeed gotten well ahead of itself over the last 12 years as compared with the combination of (a) and (b) and (c)? Thanks.
A: In our view, the easiest way to explain this is by including non-USD investors in the picture. People who use currencies other than US dollars also purchase gold (and GLD). They don't exchange US dollars for gold, but euros, yen, francs and so on. Therefore, they don't "sell" USD for gold - they "sell" other currencies. Consequently, gold's value against currencies other than USD goes up. Since gold has just become more valuable in this situation (non-USD investors bought it) and the situation for the US dollar didn't change, then the price of gold in terms of USD will also rise.
So, some rallies in gold (and GLD) can be attributed to declines in USD and some to other factors, for instance by purchases from non-USD investors.
Please note that gold broke out in euros in 2006. So if the timeframe that you choose for comparison is since 2007, this is similar to the timeframe for the whole gold bull market seen from the euro perspective.
As you can see in our Correlation Matrix, the long-term correlation between the USD Index and gold is relatively weak. There is simply more to the long-term picture for gold than the negative USD trend. From the long-term point of view, currency exchange rates are like ships that sink at difference rates versus tangible assets and the eternal currency: the precious metals.
Q: I read in the press that:
"…QE program this week the gold market probably won't do more than rally to the $1800-$1850 range before commencing a significant correction..."
How significant will the upcoming correction be? Will there be a chance to buy silver in the mid 20s? Surely it would be madness to buy at the current elevated prices? Best wishes.
A: In our opinion the chance of seeing silver in the mid 20s is quite small right now - definitely not worth betting on. The downtrend was invalidated last week and on Thursday markets were surprised with an open-ended QE3, which basically implies that silver, platinum and gold have to go up in the long run. At this point we believe that if we see a significant correction, gold would not move lower than to $1,670 and silver would move not lower than to $31.5.
Summary
Everything has changed in the past two weeks for the precious metals markets and the same goes for the USD Index. The latter changed direction and now has a bearish outlook whereas the Euro Index is now moving higher due to the weakness in the dollar.
The general stock market has rallied strongly this week and its outlook is bullish with the Fed igniting a strong move to the upside on Thursday. This, combined with the points made above, paints a bullish picture for the precious metals. A medium-term rally is quite likely based on this week's analysis of the metals markets. The short term is a bit questionable, however, as a period of consolidation seems quite possible before any continuation of the recent rally.
Our best bet at this time appears to be a small rally in the metals themselves with gold moving to its 2012 high followed by a correction. If signs of gold topping are seen, it may be a good idea to open small short positions in the sector. We feel that a combination of several strong sell signals must be seen first, however.
At this time, it seems best to have long-term capital in the precious metals: gold, silver, platinum, and mining stocks. Speculative capital is probably best kept on the sidelines at this time awaiting a better risk-reward situation.
Thank you for using the Premium Service. Have a profitable week and a great weekend!
This completes this week's Premium Update, which is the last Premium Update that we post on our current (=old) website. Our next Premium Update is scheduled for Friday, September 21, 2012, however, we will continue to send out Market Alerts after (or on) each trading day until the release of the new website, which is scheduled on Wednesday, September 19, 2012.
Przemyslaw Radomski, CFA

