

Briefly: in our opinion, full (300% of the regular position size) speculative short positions in junior mining stocks (GDXJ) are justified from the risk/reward point of view at the moment of publishing this Alert.
Some might consider an additional (short) position in the FCX.
Did you notice what happened in gold, miners, and stocks at the end of Friday’s session? It was small and huge at the same time.
Small because the size of the price moves that we saw in the final hour of trading was nothing to write home about per se. Huge because the shape of the most recent price moves has meaningful implications.
Before we move to the chart featuring GLD, GDXJ, and SPY, let’s take a moment to consider the importance of looking at the markets from various perspectives.
Have you heard that the market is nasty? I haven’t but saying that wouldn’t be far from the truth. You see, the market has this special power of discovering your weaknesses and then using them against you.
You’re impatient? And you buy options that are about to bring you huge gains if the market moves right away in your preferred way? Here’s a prolonged consolidation that will make your options expire worthless… and then you’ll get the move that you were waiting for.
You’re too bold? And you’re entering huge positions because you’re surely (!) be correct about the market moves? Here’s a more-or-less random counter-trend move that makes you panic and get out of the position right before it returns to its trend and makes you a lot of money. Why would you panic? Because due to the oversized position, your paper losses (you didn’t really incur them, but as you were monitoring the value of your portfolio it felt (!) like you did) were too painful for you to wait out the correction.
Those examples are relatively simple, but there are more sophisticated things that the market can use against you. In reality, working on oneself and on one’s own character has a tremendous rate of return, not only because it “not only” makes one happier and more fulfilled, but because it also enables one to better handle whatever the market throws at them.
Now, what can we do with this “nastiness” of markets in addition to the above? We can mitigate the emotional effect that the market has on us by applying more than one technique, more than one perspective, looking at more than one market, and so on. It’s easy for the market to get a hold of one’s emotions if one only looks at it from one perspective.
From that point of view, it’s easy to panic when we see some kind of sudden price move… Because this sudden price moves changes everything… Everything that we’re looking at that is. It might not change 99% of things, but if it’s just the 1% that we’re paying attention to, then this 1% is “our everything”, even though the reality is completely different.
You probably heard about missing the forest while being too focused on the trees. That’s one of the ways to describe the above. It’s a nice approximation, but it might be a bit misleading because it emphasizes only the broader context, while in reality sometimes the extra context comes from zooming in, not out.
To be completely clear, the more angles one uses to look at a given situation, the greater the chance of making the right decision and the lower the chance of getting tricked by the market’s “nastiness”.
That’s why, in my analyses, I focus on so many markets and so many perspectives (and I monitor many more charts, tools, techniques, and perspectives than I’m describing). In today’s analysis, I’m going to introduce you to a very short-term view of the markets, and I’ll then zoom out twice.
The chart below is based on hourly price changes – each candlestick represents one hour of trading.
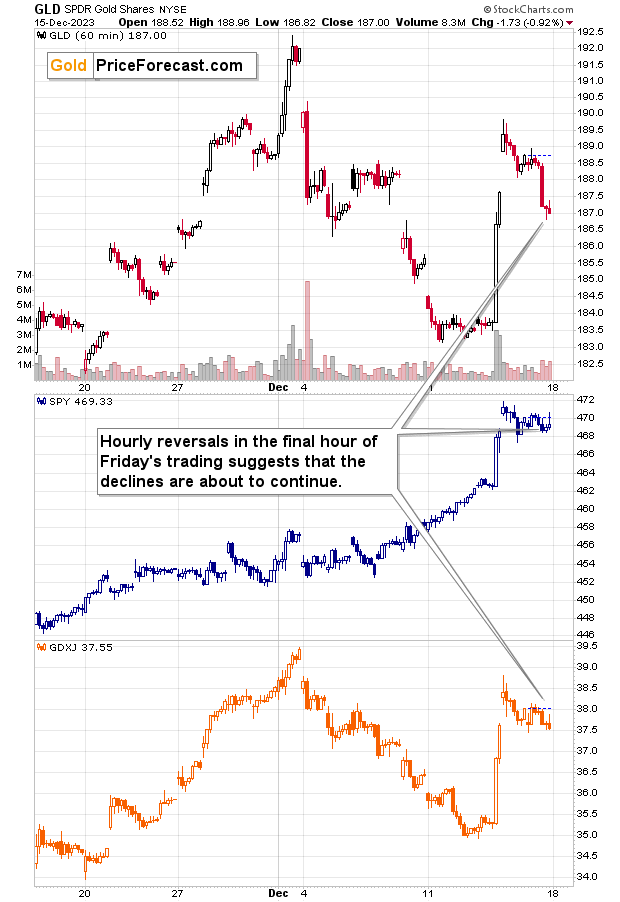
Let’s start with the middle part of the chart – it features the SPY ETF, a popular proxy for the broad market this ETF is based on the S&P 500 Index.
In the case of the SPY, we clearly see that it tried to rally at the end of Friday’s session, but it failed, and it closed the day and week relatively close to its intraday lows. In other words, it formed an intraday reversal in terms of hourly candlesticks.
The same happened in the case of junior mining stocks (GDXJ) and (to a smaller extent, but still) in GLD.
The implications of reversals are bearish, but since we saw them in all three: gold, stocks, and junior miners, they confirm each other, and the odds of seeing a decline early this week increase.
Let’s focus on the GDXJ and its hourly price moves.
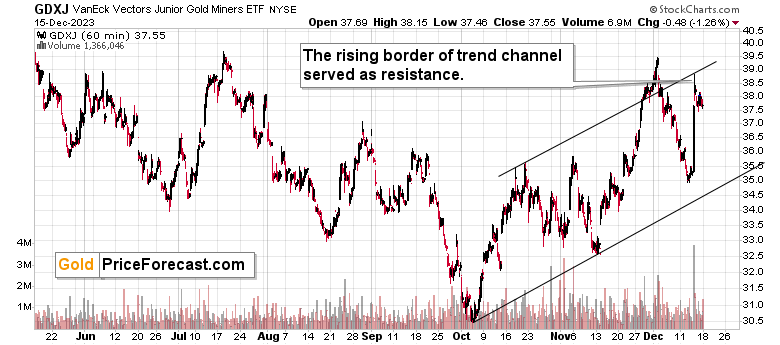
In Friday’s regular Gold Trading Alert, I wrote the following:
The upper border of the trend channel was reached and the GDXJ reversed from there.
Based on the above chart alone, we’re likely to see a move lower, quite likely to $35 or so. However, based on many other charts, it’s likely that the move to $35 will be just the first step in a way to much lower levels.
After all, the indications from short-term charts are less important than ones from medium-term charts, which in turn are less important than ones from long-term charts.
Indeed, we saw a move lower during Friday’s session. However, since the GDXJ didn’t move to at least $35, the bearish implications of the above chart (and GDXJ’s move to the upper border of the trade channel), remain up-to-date.
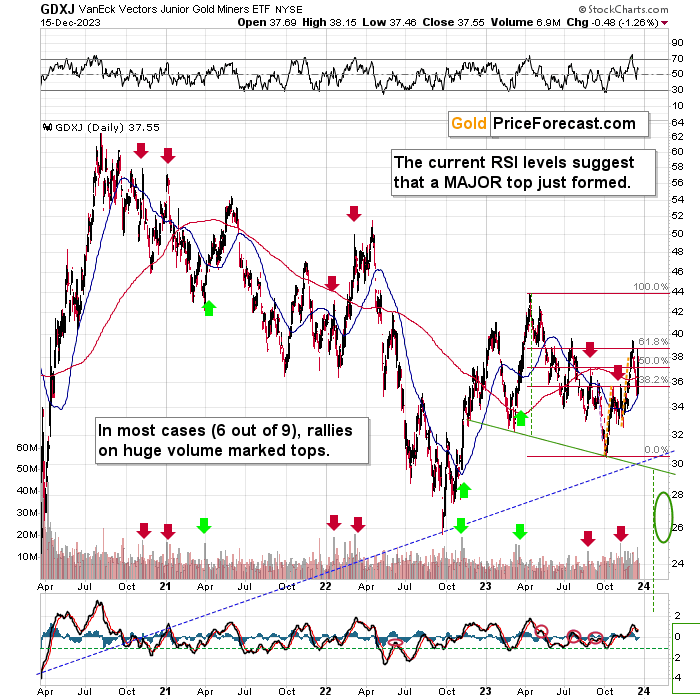
Zooming out provides us with a picture that continues to point to lower GDXJ prices, i.a. due to the recent sharp increase in volume levels.
In case of this ETF, the link between big-volume rallies and local tops is not as clear as it is in case of silver, but it’s still present. I marked the similar cases with arrows and in 6 out of 9 such cases, big-volume rallies marked local tops, or those tops followed very soon. Only in 3 out of 9 cases, big rallies followed.
Interestingly, all those three bullish cases were preceded by declines that were much bigger than what we saw recently. This suggests that the bullish analogies are not the correct ones. The bearish ones are.
Zooming out helps to put things into perspective.
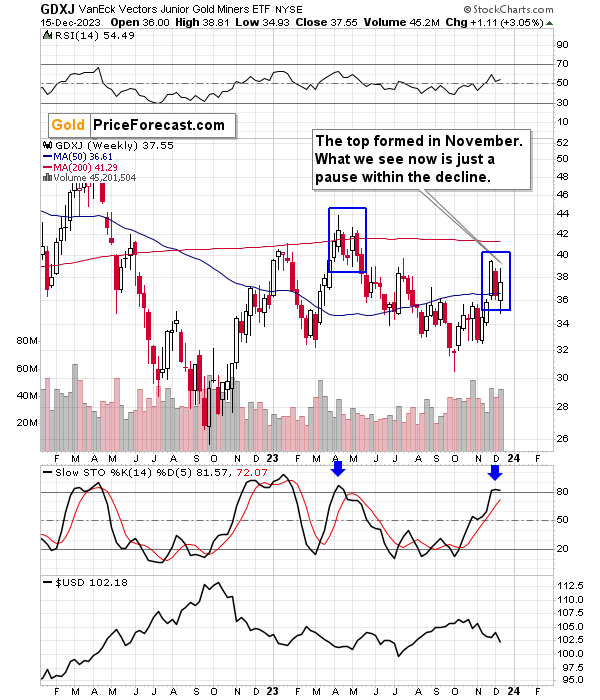
Looking at the above chart, two things stand out:
- The final top for the recent upswing most likely formed in November, and what we see now is just a pause in the post-top decline. Right after the top, GDXJ declined, and this week it corrected. It’s normal for the markets not to move up or down in a straight line, so this kind of performance is normal.
- The recent top, the subsequent decline, and then another move higher that ends with a specific candlestick (white one, with distinct knots on both ends) is just like what we saw at the 2023 top.
The implications of both points are bearish.
Now, let’s consider the situation in the USD Index. I commented on it in the final, intraday Alert of the previous week. I wrote the following:
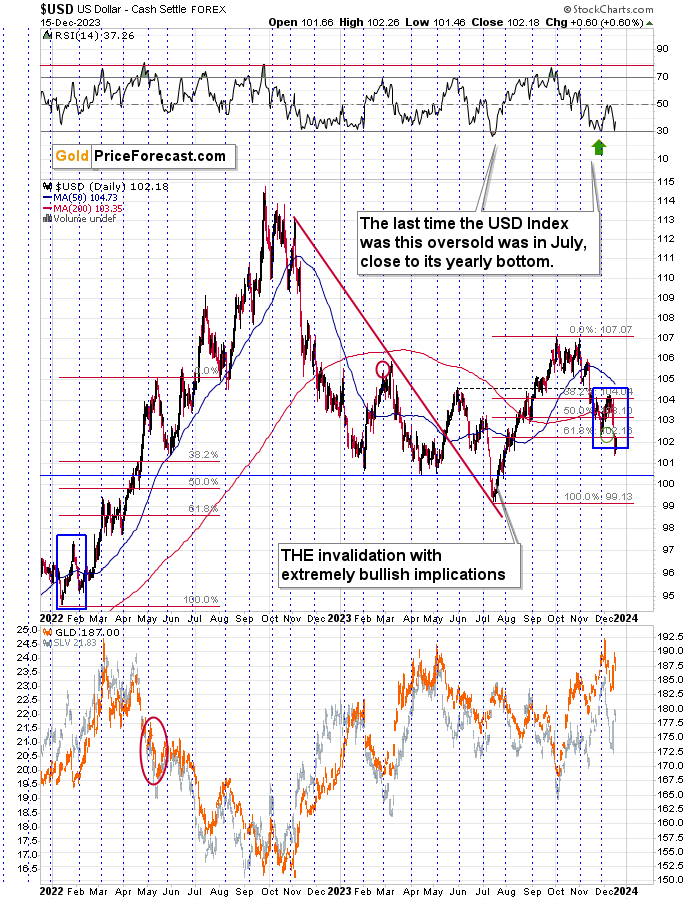
The USD Index is moving higher today, and while it didn’t move back above its 61.8% Fibonacci retracement just yet, it’s definitely moving north, and such an invalidation could take place any hour now.
The move below the early-August lows was already invalidated, but a move back above the 61.8% retracement will be the thing that confirms that the bottom is most likely in.
Generally, it takes three consecutive closes below a certain level to confirm a breakdown. So far we saw just one, and in today’s session the USDX moved higher. Invalidation later today or on Monday seems very much doable, and given how oversold the USD Index is, it’s likely to happen.
The situation in the EUR/USD also provides the context, and it makes the above-mentioned invalidation even more likely. (…)
After I wrote the above, the USD Index moved even higher, and it closed the week only slightly below the 61.8% Fibonacci retracement level. This means that the USD Index is ripe for the invalidation of the move below the 61.8% retracement.
Just as the hourly reversals point to lower precious metals and stock prices this week, the upcoming – likely – invalidation in the USD Index, is likely to add fuel to the bearish fire.
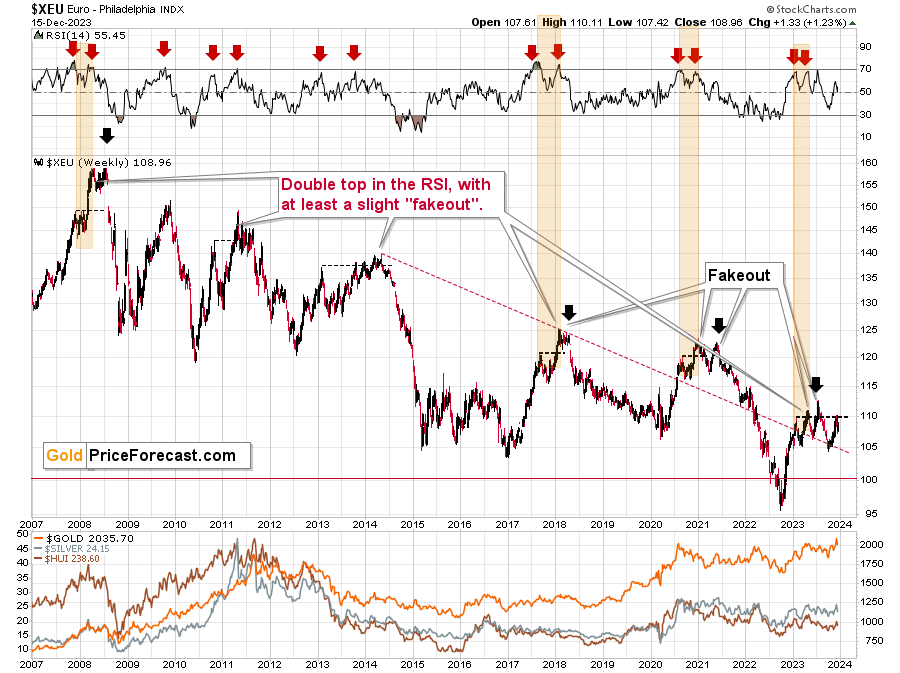
The situation in the EUR/USD remains similar to the previous broad tops that I marked on the above chart. My Frisday’s comments on its chart remain up-to-date
The European currency moved once again to its early-2023 top, thus likely creating a multi-top pattern. This has been a common way for the EUR/USD to top and I marked the previous cases on the above chart.
In 2008 and in 2011 there were sharp, final comebacks to this level before the decline continued. The one in 2014 was small, but it was still there, and the same goes for the one seen in 2021.
What might see chaotic or a game-changer from the short-term point of view, often becomes normal and orderly when looked at from a bigger perspective.
In this case, what happened recently in junior mining stocks is most likely a part of a bigger, medium-term decline.
Consequently, the roadmap that I presented for the GDXJ previously, remains up-to-date:
The markets usually don’t move up or down in a straight line, so some kind of correction is likely to take place in the future, anyway. The question is from what price levels.
My best candidate for the first correction (based on the data that I have available right now) is The $30.5 - $32 range, which is based on the previous lows. I don’t expect a huge rally from those levels, though. Perhaps a move from $30.5 to $32, and then the decline would continue.
The next target is more important. After breaking to new 2023 lows, the move to the 2022 low (close to $26) becomes a good possibility – I marked this area with a green ellipse.
Once this level is reached, I then expect the GDXJ to correct in a more visible manner. After all, at that point, it will be after important breakdowns:
- Below the rising blue support line
- Below the previous 2023 low
- Below the green support line
Consequently, a verification of those breakdowns by a move back to them, would be quite normal. This means a move back to $29 - $30. Then, after a successful verification of those breakdowns, I’d expect the GDXJ to slide lower – to the 2020 low or close to them – at about $20.
There’s also a good possibility of seeing a bottom at about $22, as that’s where we have a downside target based on the head-and-shoulders pattern that is most likely being formed right now. It could also be the case that the GDXJ slides to about $20 on an intraday basis only to recover and close the day at about $22. In a way, both targets would be reached in this case.
There are many IFs around the above-mentioned scenario, and the situation might (and it probably will) change as we go. Remaining open-minded and flexible regarding the new information is key, but having a roadmap is very useful, too, as it shows how things could develop on a more-or-less basis. This can help you prepare for those – or similar – price moves.
Again, as always, I’ll keep you – my subscribers – updated.
= = =
If you’d like to become a partner/investor in Golden Meadow, you’ll find more details in the above link.
Overview of the Upcoming Part of the Decline
- It seems that the recent – and probably final – corrective upswing in the precious metals sector is over.
- If we see a situation where miners slide in a meaningful and volatile way while silver doesn’t (it just declines moderately), I plan to – once again – switch from short positions in miners to short positions in silver. At this time, it’s too early to say at what price levels this could take place and if we get this kind of opportunity at all.
- I plan to switch from the short positions in junior mining stocks or silver (whichever I’ll have at that moment) to long positions in junior mining stocks when gold / mining stocks move to their 2020 lows (approximately). While I’m probably not going to write about it at this stage yet, this is when some investors might consider getting back in with their long-term investing capital (or perhaps 1/3 or 1/2 thereof).
- I plan to return to short positions in junior mining stocks after a rebound – and the rebound could take gold from about $1,450 to about $1,550, and it could take the GDXJ from about $20 to about $24. In other words, I’m currently planning to go long when GDXJ is close to $20 (which might take place when gold is close to $1,450), and I’m planning to exit this long position and re-enter the short position once we see a corrective rally to $24 in the GDXJ (which might take place when gold is close to $1,550).
- I plan to exit all remaining short positions once gold shows substantial strength relative to the USD Index while the latter is still rallying. This may be the case with gold prices close to $1,400 and GDXJ close to $15 . This moment (when gold performs very strongly against the rallying USD and miners are strong relative to gold after its substantial decline) is likely to be the best entry point for long-term investments, in my view. This can also happen with gold close to $1,400, but at the moment it’s too early to say with certainty.
- The above is based on the information available today, and it might change in the following days/weeks.
You will find my general overview of the outlook for gold on the chart below:
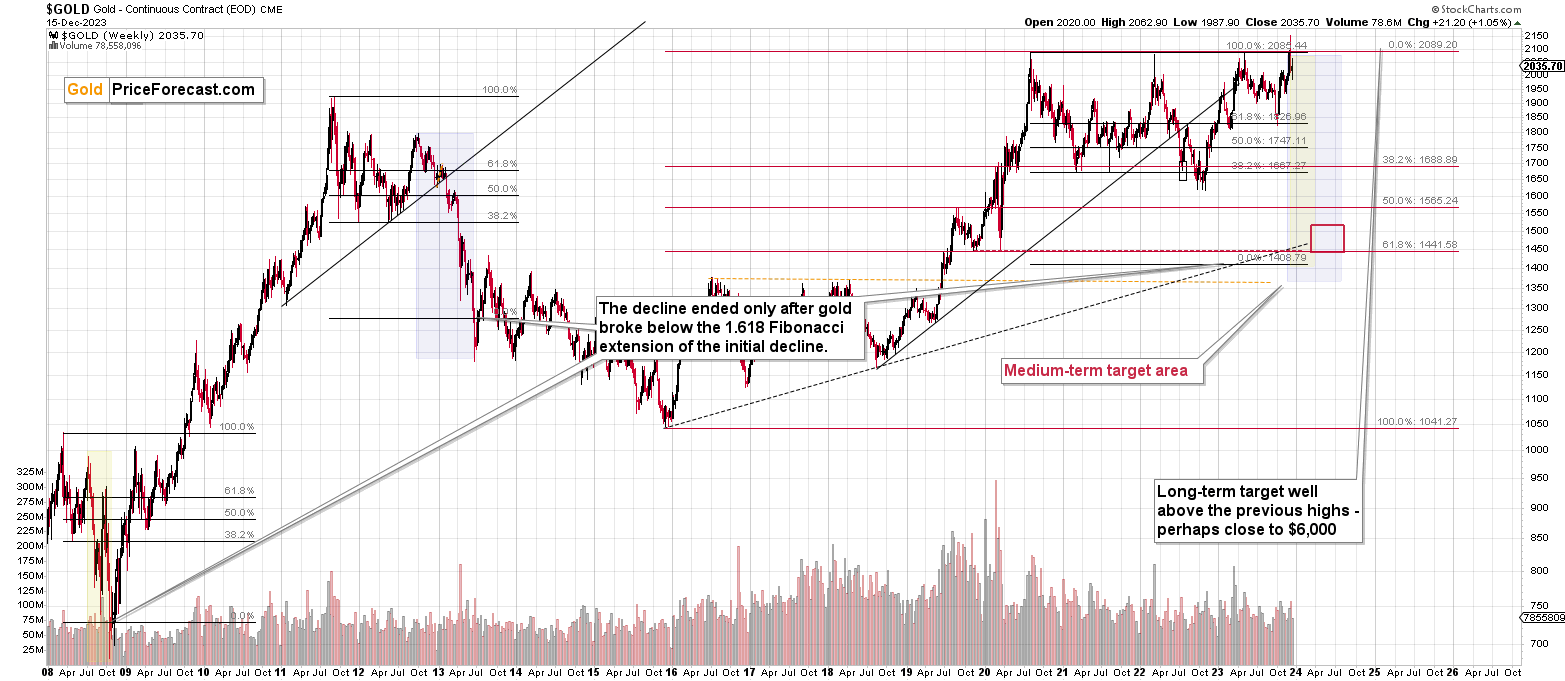
Please note that the above timing details are relatively broad and “for general overview only” – so that you know more or less what I think and how volatile I think the moves are likely to be – on an approximate basis. These time targets are not binding nor clear enough for me to think that they should be used for purchasing options, warrants, or similar instruments.
Letters to the Editor
Please post your questions in the comments feed below the articles if they are about issues raised within the article (or in the recent issues). If they are about other, more universal matters, I encourage you to use the Ask the Community space (I’m also part of the community) so that more people can contribute to the reply and enjoy the answers. Of course, let’s keep the target-related discussions in the premium space (where you’re reading this).
Summary
To summarize, the short-term corrective upswing in the mining stocks is most likely over, and that the top in the precious metals market is likely in or at hand. It becomes more obvious when one looks at the key pattern in the EUR/USD, which is yet another broad top. The reversal in GLD and the move to the upper border of the trend channel in the GDXJ’s very short-term picture provide the short-term confirmations. So does silver’s immediate-term outperformance.
The Fed’s surprisingly dovish remarks triggered emotional buying, but it’s unlikely that this rally will last.
And just like the top that we saw in the first half of 2022, this top is likely to be followed by severe declines in gold, silver, and mining stocks. Junior miners are likely to fall particularly hard, being influenced also by – most likely – falling stock prices. The values of copper and FCX shares are likely to slide as well.
===
As we’re on a streak of 11 profitable (closed, unleveraged) trades, and – just like I wrote today and in the previous days – it looks like we’re going to see much more of them in the near future, I want to provide you with even more great news!
We’re opening the possibility of extending your subscription for up to three years (at least by one year) with a 10% discount from the current prices.
Locking in those is a great idea not only because it’s perfect time to be ready for what’s next in the precious metals market, but also because the inflation might persist longer than expected and prices of everything (including our subscriptions) are going to go up in the future as well. Please reach out to our support – they will be happy to assist you and make sure that your subscription days are properly extended at those promotional terms. So, for how many years would you like to lock-in your subscription?
To summarize:
Trading capital (supplementary part of the portfolio; our opinion): Full speculative short positions (300% of the full position) in junior mining stocks are justified from the risk to reward point of view with the following binding exit profit-take price levels:
Mining stocks (price levels for the GDXJ ETF): binding profit-take exit price: $28.12; stop-loss: none.
Alternatively, if one seeks leverage, we’re providing the binding profit-take levels for the JDST (2x leveraged). The binding exit level for the JDST: $10.54; stop-loss for the JDST: none.
For-your-information targets (our opinion; we continue to think that mining stocks are the preferred way of taking advantage of the upcoming price move, but if for whatever reason one wants / has to use silver or gold for this trade, we are providing the details anyway.):
Silver futures downside exit price: $20.22 (stop-loss: none)
SLV exit price: $18.62 (stop-loss: none)
ZSL exit price: $24.98 (stop-loss: none)
Gold futures downside exit price: $1,812 (stop-loss: none)
Spot gold downside exit price: $1,792 (stop-loss: none)
HGD.TO – alternative (Canadian) 2x inverse leveraged gold stocks ETF – the exit price: $8.43 (stop-loss: none)
HZD.TO – alternative (Canadian) 2x inverse leveraged silver ETF – the exit price: $19.49 (stop-loss: none)
///
Optional / additional trade idea that I think is justified from the risk to reward point of view:
Short position in the FCX with $27.13 as the short-term profit-take level.
Long-term capital (core part of the portfolio; our opinion): No positions (in other words: cash)
Insurance capital (core part of the portfolio; our opinion): Full position
Whether you’ve already subscribed or not, we encourage you to find out how to make the most of our alerts and read our replies to the most common alert-and-gold-trading-related-questions.
Please note that we describe the situation for the day that the alert is posted in the trading section. In other words, if we are writing about a speculative position, it means that it is up-to-date on the day it was posted. We are also featuring the initial target prices to decide whether keeping a position on a given day is in tune with your approach (some moves are too small for medium-term traders, and some might appear too big for day-traders).
Additionally, you might want to read why our stop-loss orders are usually relatively far from the current price.
Please note that a full position doesn't mean using all of the capital for a given trade. You will find details on our thoughts on gold portfolio structuring in the Key Insights section on our website.
As a reminder - "initial target price" means exactly that - an "initial" one. It's not a price level at which we suggest closing positions. If this becomes the case (as it did in the previous trade), we will refer to these levels as levels of exit orders (exactly as we've done previously). Stop-loss levels, however, are naturally not "initial", but something that, in our opinion, might be entered as an order.
Since it is impossible to synchronize target prices and stop-loss levels for all the ETFs and ETNs with the main markets that we provide these levels for (gold, silver and mining stocks - the GDX ETF), the stop-loss levels and target prices for other ETNs and ETF (among other: UGL, GLL, AGQ, ZSL, NUGT, DUST, JNUG, JDST) are provided as supplementary, and not as "final". This means that if a stop-loss or a target level is reached for any of the "additional instruments" (GLL for instance), but not for the "main instrument" (gold in this case), we will view positions in both gold and GLL as still open and the stop-loss for GLL would have to be moved lower. On the other hand, if gold moves to a stop-loss level but GLL doesn't, then we will view both positions (in gold and GLL) as closed. In other words, since it's not possible to be 100% certain that each related instrument moves to a given level when the underlying instrument does, we can't provide levels that would be binding. The levels that we do provide are our best estimate of the levels that will correspond to the levels in the underlying assets, but it will be the underlying assets that one will need to focus on regarding the signs pointing to closing a given position or keeping it open. We might adjust the levels in the "additional instruments" without adjusting the levels in the "main instruments", which will simply mean that we have improved our estimation of these levels, not that we changed our outlook on the markets. We are already working on a tool that would update these levels daily for the most popular ETFs, ETNs and individual mining stocks.
Our preferred ways to invest in and to trade gold along with the reasoning can be found in the how to buy gold section. Furthermore, our preferred ETFs and ETNs can be found in our Gold & Silver ETF Ranking.
As a reminder, Gold & Silver Trading Alerts are posted before or on each trading day (we usually post them before the opening bell, but we don't promise doing that each day). If there's anything urgent, we will send you an additional small alert before posting the main one.
===
On a side note, while commenting on analyses, please keep the Pillars of the Community in mind. It’s great to provide points that help others be more objective. However, it’s important to focus on the facts and discuss them in a dignified manner. There is not much of the latter in personal attacks. As more and more people join our community, it is important to keep it friendly. Being yourself, even to the point of swearing, is great, but the point is not to belittle other people or put them in a position of “shame” (whether it works or not). Everyone can make mistakes, and everyone does, in fact, make mistakes. We all here have the same goal: to have a greater understanding of the markets and pick better risk-to-reward situations for our trades. We are on the same side.
On another – and final – side note, the number of messages, comments etc. that I’m receiving is enormous, and while I’m grateful for such engagement and feedback, I’m also starting to realize that there’s no way in which I’m going to be able to provide replies to everyone that I would like to, while keeping any sort of work-life balance and sanity ;) Not to mention peace of mind and calmness required to approach the markets with maximum objectivity and to provide you with the service of the highest quality – and best of my abilities.
Consequently, please keep in mind that I will not be able to react / reply to all messages. It will be my priority to reply to messages/comments that adhere to the Pillars of the Community (I wrote them, by the way) and are based on kindness, compassion and on helping others grow themselves and their capital in the most objective manner possible (and to messages that are supportive in general). I noticed that whatever one puts their attention to – grows, and that’s what I think all communities need more of.
Sometimes, Golden Meadow’s support team forwards me a message from someone, who assumed that I might not be able to see a message on Golden Meadow, but that I would notice it in my e-mail account. However, since it’s the point here to create a supportive community, I will specifically not be providing any replies over email, and I will be providing them over here (to the extent time permits). Everyone’s best option is to communicate here, on Golden Meadow, ideally not in private messages (there are exceptions, of course!) but in specific spaces or below articles, because even if I’m not able to reply, the odds are that there will be someone else with insights on a given matter that might provide helpful details. And since we are all on the same side (aiming to grow ourselves and our capital), a ton of value can be created through this kind of collaboration :).
Thank you.
Przemyslaw K. Radomski, CFA
Founder, Editor-in-chief

