

Briefly: in our opinion, full (300% of the regular position size) speculative short positions in mining stocks are justified from the risk/reward point of view at the moment of publishing this Alert.
It’s almost 9/11 – 20 years ago everything changed for so many people. The world was never the same since the day of the tragedy. So many unnecessary deaths, and so much suffering that resulted from them…
Gold – being the safe-haven asset – soared in the immediate aftermath, but it was not the immediate rally that really mattered. It was the shift in the global sentiment that was the real change. The world suddenly became a much more violent and uncertain place in the eyes of many investors. Therefore, the need for getting protection – in the form of gold – started to emerge on investors’ radars.
Twenty years later we have gold priced over 6 times higher than the price it reached immediately after the 9/11 disaster. Moreover, with the monetary authorities printing massive amounts of money in the aftermath of yet another tragedy – the recent pandemic – gold seems poised to soar to the moon.
But.
Just because something is likely to move much higher, it doesn’t mean that it can’t become overvalued on a temporary basis.
Just because something is likely to move much higher, it doesn’t mean that it’s likely to go higher now.
And finally, just because something is likely to move much higher, it doesn’t mean that it’s likely to go higher without declining first.
And the gold price – as bullish as it might get in the long run – is very likely repeating its pattern from 2013, when it declined profoundly. There are multiple confirmations present in other markets (like gold stocks) and ratios (like gold to bonds ratio, and gold stocks to gold ratio that shows the extreme weakness of the entire precious metals market), but in today’s analysis, I would like to focus on gold’s price itself.
It’s Not a Rhyme Anymore. It’s Repetition!
The history repeats itself to a considerable degree, and you will soon see that the fact that gold was unable to hold its breakout above its 2011 highs was not accidental. It’s not a coincidence that gold is now about $300 lower than it was when it reached its August 2020 high, even though the USD Index is trading approximately at the same levels as it was trading in August 2020. Let’s jump right into gold’s long-term chart.
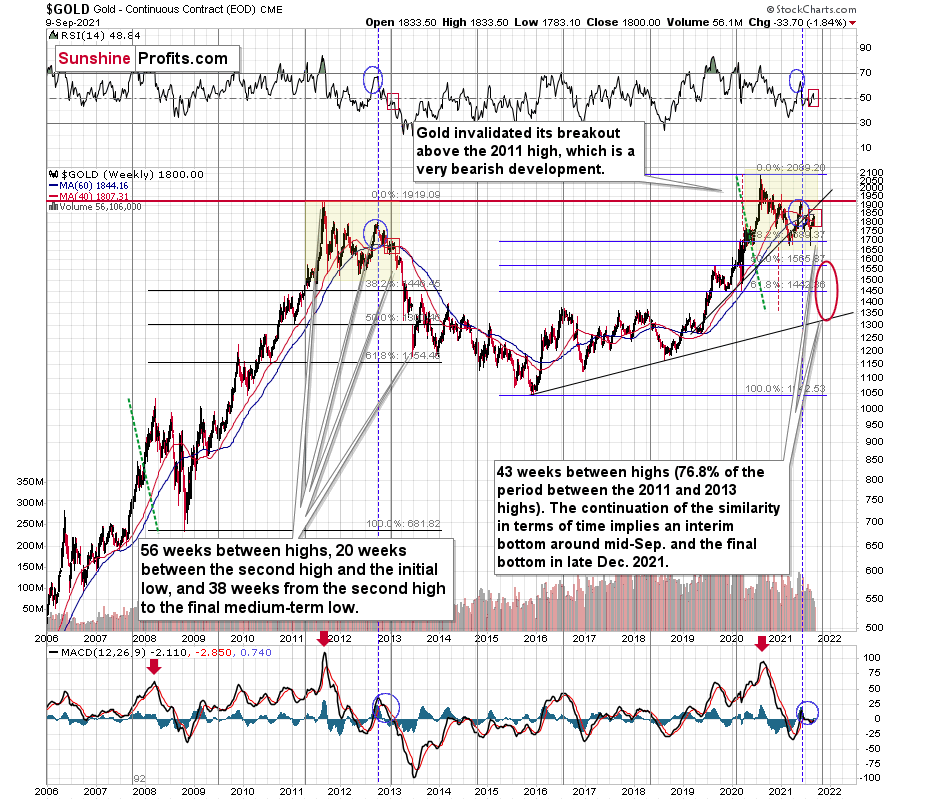
Even without zooming in, you can clearly see that both areas marked in yellow are similar (please note that you can click on the chart to enlarge it).
Before discussing gold’s price moves, please note that the positions of the indicators (the RSI in the upper part of the chart, and the MACD in the lower part of the chart) are almost identical now and during the 2012-2013 decline. The areas marked with red and blue correspond to each other.
To make the analogy clearer, I’ll zoom in on them separately, using two charts below.
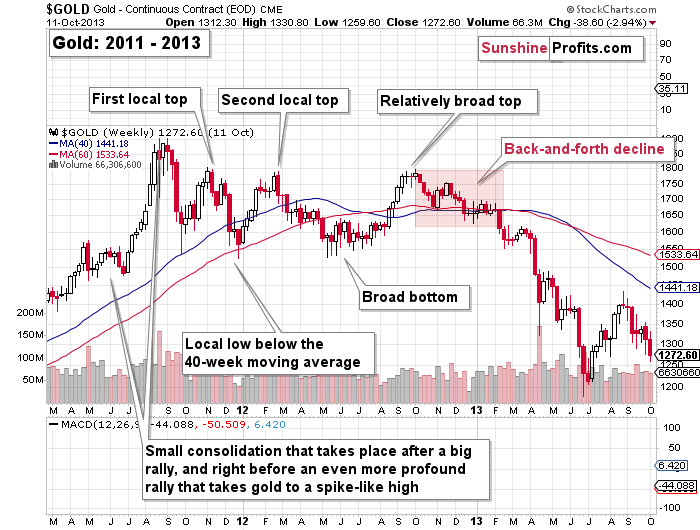
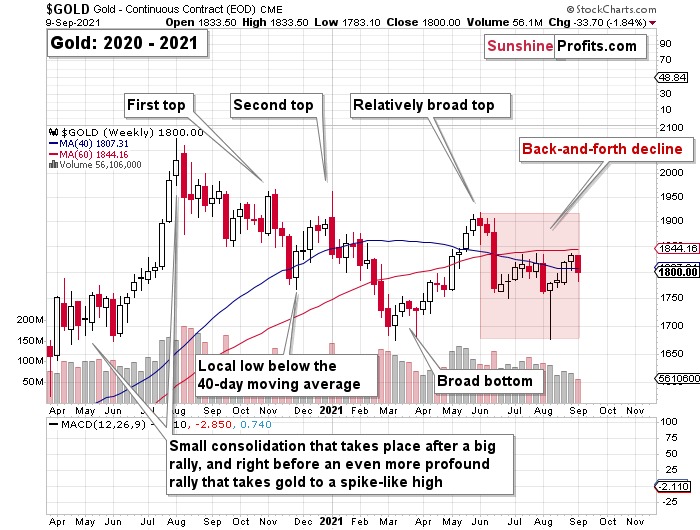
Both yellow areas start with a small consolidation that takes place after a big rally and right before an even more profound rally, which takes gold to a spike-like high.
Then gold declines. After the first drop and a quick rebound (in both cases), we get the first local top, where gold shows that it’s unable to reach the previous high, let alone break above it. We saw that in November 2011 and in early November 2020.
Then we see another decline in gold’s price. This time, it takes gold below its 40-week moving average (marked with red). Both bottoms form quickly, and the comeback is swift. That happened in December 2011 and in late November 2020.
Then we see another move higher – right to the most recent local high. That happened in February 2012 and in early January 2021.
And then we see another slide lower. In this case, gold bottoms close to the small consolidation that preceded the final (2011, 2020) top. The bottoms were broad and took place between May 2012 and July 2012, as well as between March and April 2021.
Then we get yet another rally that takes gold relatively close to the previous local tops (October 2012 and May 2021). In both cases, the shape of the top is broader than it was in the case of the previous two tops.
After that top, a huge decline in the price of gold begins, but it’s not clear at first, and many people still think it’s just a consolidation that will be followed by more rallies.
During this time (October 2012 – early 2013, and May 2021 – now) gold moves back and forth with lower lows and lower highs. Gold stocks underperform gold in a clear manner in both periods.
So far, the moves have been extremely similar, and if the history simply continues to be similar, we can estimate what’s ahead by extrapolating what we already saw in 2013. Based on this analogy, it seems that we’re about to see one final correction when gold once again moves to its previous (2021) lows, but this correction won’t be significant. It will be the final good-bye to the current trading range before gold truly slides – just as it did between April and June 2013.
Now, this is what the situation looks like right now, and the above outlook is based on much more than just the above (extraordinary, but still) single analogy. The remarkable self-similarity is present also in the HUI Index, and what’s likely to take place in the case of gold’s arch-nemesis – the USD Index – fully corresponds to the above-featured scenario. Silver’s performance confirms it as well. (By the way, have you noticed the fact that even though gold temporarily moved above its 2011 high, neither gold stocks nor silver managed to do the same thing? They were not even close. This should make even the most bullish precious metals investors concerned.)
I’m looking at the markets each day, I’m going through many charts and news announcements (hint: most of them matter very little) on a daily basis, and I will accordingly report to you – my subscribers – as soon as I notice any meaningful change in the above analogies so that you are able to adjust your outlooks (and investment/trading positions) in advance. If the change is not urgent, I’ll let you know through the regular daily analyses, and if it is urgent, I’ll notify you via a quick email message. As always, I’ll keep you informed.
Having said that, let’s take a look at the market from a more fundamental angle.
The Dovish Hawks
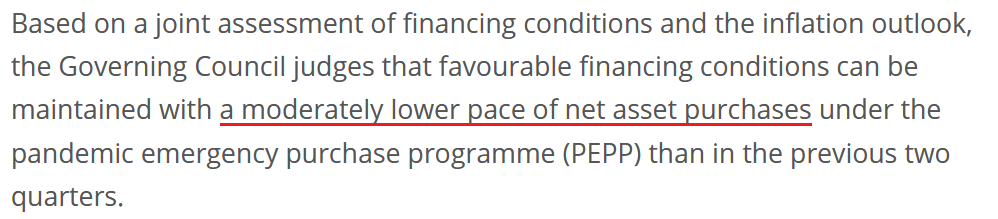
With the European Central Bank (ECB) releasing its monetary policy decision on Sep. 9, the announcement was akin to a New Year’s resolution, which never fully materializes. To explain, the ECB struck a conciliatory tone and said that its net PEPP purchases would be conducted at “a moderately lower pace” going forward.
Please see below:
 Source: ECB
However, while the deceleration may seem like a monumental shift, the move is much more semblance than substance:
- The ECB left the interest rate on its main refinancing operations and the interest rates on its marginal lending facility and its deposit facility at 0.00%, 0.25% and -0.50% respectively.
- Net APP purchases will still be reinvested “for an extended period of time past the date when [the ECB] starts raising the key ECB interest rates, and in any case for as long as necessary to maintain favorable liquidity conditions and an ample degree of monetary accommodation.”
- “ The Governing Council will continue to conduct net asset purchases under the PEPP with a total envelope of €1,850 billion until at least the end of March 2022 and, in any case, until it judges that the coronavirus crisis phase is over .”
Now, that third statement is key. With the ECB pledging “€1,850 billion until at least the end of March 2022,” the central bank’s bond-buying program will continue largely unaffected.
Please see below:
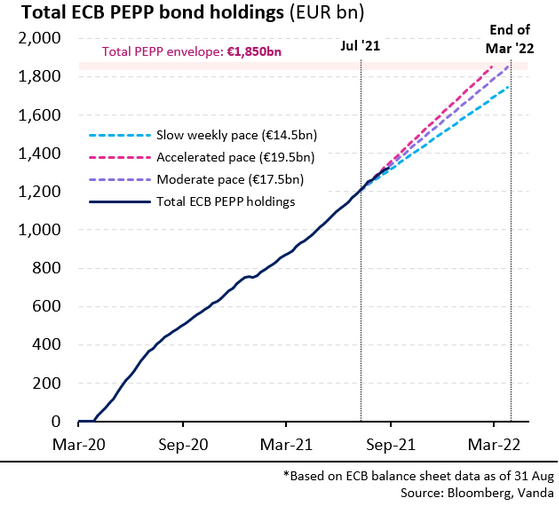
To explain, the light blue (slow), pink (accelerated), and purple (moderate) lines above project the future trajectory of the ECB’s weekly PEPP purchases. If you analyze the vertical gray line on the right side of the chart (it depicts the end of March 2022), you can see that €19.5 billion per week (~€78 billion per month) and €17.5 billion per week (~€70 billion per month) will result in the ECB exhausting the entire PEPP facility by the expiration date. Conversely, at €14.5 billion per week (~€58 billion per month), the facility will expire with roughly €1,750 billion of the €1,850 billion funds used. Thus, as the ECB shifts from its “significantly higher pace” in H1:2021 to “a moderately lower pace” going forward, the fundamental impact over the next seven months is largely unaffected.
To that point, Joe Little, global chief strategist at HSBC Asset Management, said the following:
“In our view, the decision to reduce asset purchases is not tapering, but a reversal of March’s emergency uplift in purchases – which itself followed a market episode of rising bond yields. It means that in Q4, ECB asset purchases will look closer to the levels they were in Q1 this year.”
Please see below:
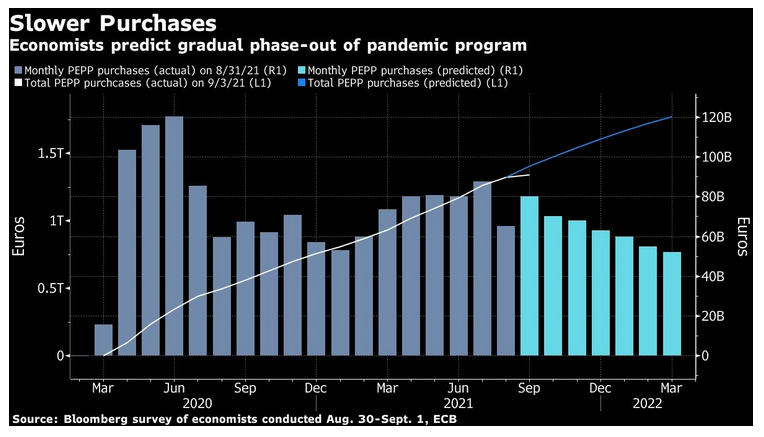
To explain, the dark blue bars above track the ECB’s monthly PEPP purchases since March 2020, while the light blue bars above track economists’ consensus estimates until the end of March 2022. If you analyze the middle of the chart, you can see that the ECB began 2021 in the ~€50 to ~€80 billion per month range before increasing the pace to more than ~€80 billion per month in July (using the scale on the right side of the chart). Moreover, with economists forecasting that the ECB will purchase another ~€80 billion per month in September and remain above/at ~€60 billion per month until at least January 2022, it’s unlikely that the €1,850 billion won’t be drained by the time the PEPP facility expires at the end of March 2022.
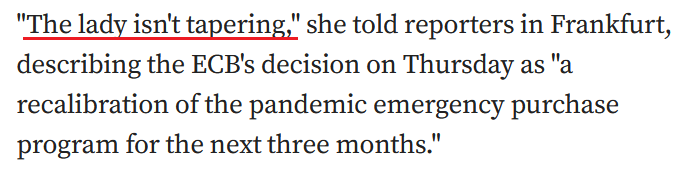
On top of that, ECB President Christine Lagarde said the following during her press conference on Sep. 9:
 Source: Bloomberg
The bottom line? The EUR/USD largely ignored the news on Sep. 9, as an initial spike higher was quickly sold and the currency pair ended the day up by 0.07%. However, because the EUR/USD accounts for nearly 58% of the movement of the USD Index, its performance, and the ramifications for the PMs, are extremely important.
To that point, with the Fed’s next policy meeting scheduled for Sep. 21/22, the disruptions from the Delta variant will likely keep the central bank on hold. However, since the dovish consensus leaves room for a possible hawkish surprise, Dallas Fed President Robert Kaplan said on Sep. 8 that the central bank should taper “sooner rather than later.”
“I will be watching very carefully how the economy is unfolding between now and our Sept. 22 meeting. As I see it now, I don’t see a fundamental change in the outlook. If I get to the meeting and continue to feel that way, I’d be advocating that we should announce a plan for adjusting these purchases in the September meeting and begin shortly thereafter, maybe in October.”
Likewise, St. Louis Fed President James Bullard said on Sep. 8 that “if we can get the workers matched up and bring the pandemic under better control, it certainly looks like we'll have a very strong labor market going into next year. There is plenty of demand for workers, and there are more job openings than there are unemployed workers.”
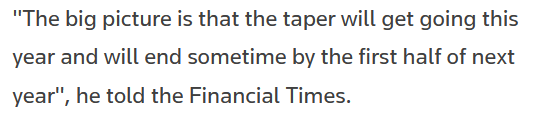
More importantly, though:
 Source: Reuters
What’s more, after the S&P 500 suffered another down day on Sep. 9, further volatility could accelerate the USD Index’s likely uprising. For example, while the general stock market still remains extremely elevated, a valuation reset could shift sentiment and create a safe-haven bid for the U.S. dollar.
Please see below:
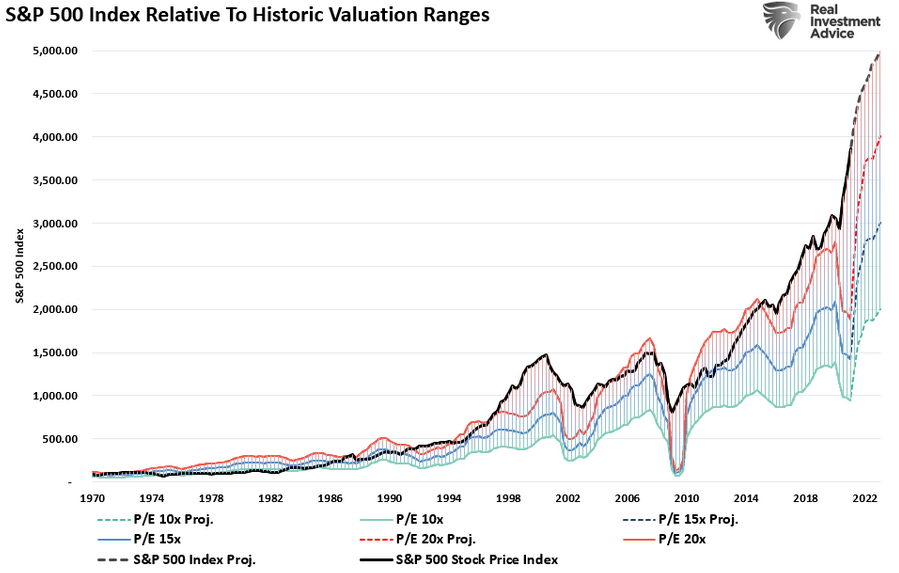
To explain, the black line above tracks the S&P 500, while the orange and blue lines above track the S&P 500’s implied valuation if its price-to-earnings (P/E) ratio was 20x and 15x respectively. If you analyze the right side of the chart, a 20x multiple – which is roughly 33% higher than the long-term average – implies an S&P 500 price target of 4,000. Even worse, at 15x, it implies a price target of 3,000. As a result, if fundamentals become fashionable once again, a reversion to the mean could upend the S&P 500 and uplift the USD Index.
Tech? All Aboard!
Moreover, while cyclical sectors have been crushed in recent weeks, the technology sector – which makes up roughly 28% of the S&P 500 – has been the driving force behind the benchmark’s levitation. And with inflows hitting a roughly five-month high last week, a tech drawdown could be the straw that breaks the camel’s back.
Please see below:
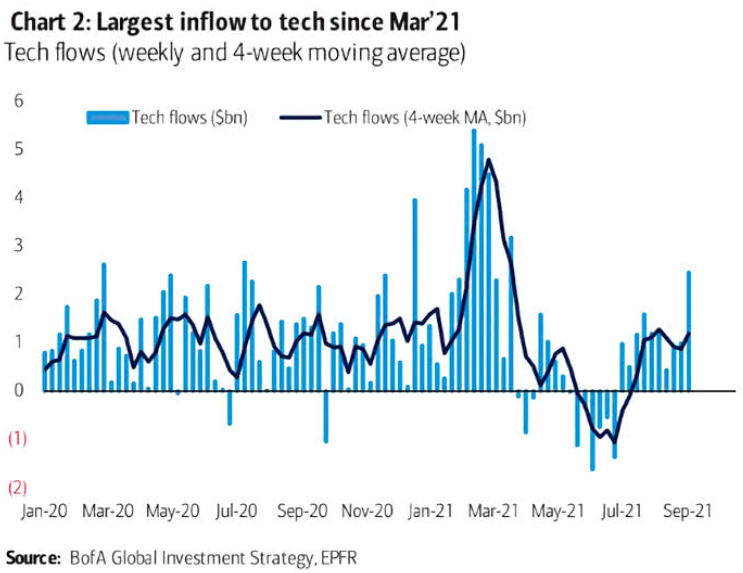
To explain, the blue bars above track the weekly inflows into U.S. technology stocks. If you analyze the bar furthest to the right, you can see that the ‘all aboard’ attitude has left sentiment extremely elevated. Thus, a deceleration in breadth and crowded positioning could be the S&P 500’s undoing.
In conclusion, gold rallied on Sep. 9, while the gold miners continued their underperformance. And with the latter declining alongside the USD Index once again, the gold miners’ inability to muster support is an extremely bearish sign. Moreover, with the general stock market also eliciting weakness, a material correction could uplift the USD Index and accelerate the gold miners’ bearish underperformance. As a result, ominous clouds have gathered, and the rainfall will likely continue for the next few months.
Overview of the Upcoming Part of the Decline
- It seems to me that the corrective upswing in gold is over or close to being over, and the big decline seems to be already underway.
- It seems that the first stop for gold will be close to its previous 2021 lows, slightly below $1,700. Then it will likely correct a bit, but it’s unclear if I want to exit or reverse the current short position based on that – it depends on the number and the nature of the bullish indications that we get at that time.
- After the above-mentioned correction, we’re likely to see a powerful slide, perhaps close to the 2020 low ($1,450 - $1,500).
- If we see a situation where miners slide in a meaningful and volatile way while silver doesn’t (it just declines moderately), I plan to switch from short positions in miners to short positions in silver. At this time, it’s too early to say at what price levels this could take place, and if we get this kind of opportunity at all – perhaps with gold close to $1,600.
- I plan to exit all remaining short positions when gold shows substantial strength relative to the USD Index while the latter is still rallying. This might take place with gold close to $1,350 - $1,400. I expect silver to fall the hardest in the final part of the move. This moment (when gold performs very strongly against the rallying USD and miners are strong relative to gold after its substantial decline) is likely to be the best entry point for long-term investments, in my view. This might also happen with gold close to $1,375, but it’s too early to say with certainty at this time. I expect the final bottom to take place near the end of the year, perhaps in mid-December.
- As a confirmation for the above, I will use the (upcoming or perhaps we have already seen it?) top in the general stock market as the starting point for the three-month countdown. The reason is that after the 1929 top, gold miners declined for about three months after the general stock market started to slide. We also saw some confirmations of this theory based on the analogy to 2008. All in all, the precious metals sector is likely to bottom about three months after the general stock market tops.
- The above is based on the information available today, and it might change in the following days/weeks.
You will find my general overview of the outlook for gold on the chart below:
Please note that the above timing details are relatively broad and “for general overview only” – so that you know more or less what I think and how volatile I think the moves are likely to be – on an approximate basis. These time targets are not binding or clear enough for me to think that they should be used for purchasing options, warrants or similar instruments.
Summary
To summarize, even though we saw a sizable upswing last Friday, it doesn’t seem that it changes anything with regard to the bearish medium-term trend on the precious metals market. The key breakdowns / breakdowns were either not invalidated (USD Index) or were invalidated in a way that’s suspicious (silver, GDXJ, GDX) or in tune with what happened during the powerful 2013 slide (GDX, HUI Index).
Even the volume readings from the palladium market confirm the bearish narrative for gold, silver, and mining stocks.
It seems that our profits from the short positions are going to become truly epic in the following weeks.
After the sell-off (that takes gold to about $1,350 - $1,500), I expect the precious metals to rally significantly. The final part of the decline might take as little as 1-5 weeks, so it's important to stay alert to any changes.
Most importantly, please stay healthy and safe. We made a lot of money last March and this March, and it seems that we’re about to make much more on the upcoming decline, but you have to be healthy to enjoy the results.
As always, we'll keep you - our subscribers - informed.
By the way, we’re currently providing you with the possibility to extend your subscription by a year, two years or even three years with a special 20% discount. This discount can be applied right away, without the need to wait for your next renewal – if you choose to secure your premium access and complete the payment upfront. The boring time in the PMs is definitely over, and the time to pay close attention to the market is here. Naturally, it’s your capital, and the choice is up to you, but it seems that it might be a good idea to secure more premium access now while saving 20% at the same time. Our support team will be happy to assist you in the above-described upgrade at preferential terms – if you’d like to proceed, please contact us.
To summarize:
Trading capital (supplementary part of the portfolio; our opinion): Full speculative short positions (300% of the full position) in mining stocks are justified from the risk to reward point of view with the following binding exit profit-take price levels:
Mining stocks (price levels for the GDXJ ETF): binding profit-take exit price: $35.73; stop-loss: none (the volatility is too big to justify a stop-loss order in case of this particular trade)
Alternatively, if one seeks leverage, we’re providing the binding profit-take levels for the JDST (2x leveraged) and GDXD (3x leveraged – which is not suggested for most traders/investors due to the significant leverage). The binding profit-take level for the JDST: $16.96; stop-loss for the JDST: none (the volatility is too big to justify a SL order in case of this particular trade); binding profit-take level for the GDXD: $35.46; stop-loss for the GDXD: none (the volatility is too big to justify a SL order in case of this particular trade).
For-your-information targets (our opinion; we continue to think that mining stocks are the preferred way of taking advantage of the upcoming price move, but if for whatever reason one wants / has to use silver or gold for this trade, we are providing the details anyway.):
Silver futures upside profit-take exit price: unclear at this time - initially, it might be a good idea to exit, when gold moves to $1,683
Gold futures upside profit-take exit price: $1,683
HGD.TO – alternative (Canadian) inverse 2x leveraged gold stocks ETF – the upside profit-take exit price: $11.38
Long-term capital (core part of the portfolio; our opinion): No positions (in other words: cash
Insurance capital (core part of the portfolio; our opinion): Full position
Whether you already subscribed or not, we encourage you to find out how to make the most of our alerts and read our replies to the most common alert-and-gold-trading-related-questions.
Please note that we describe the situation for the day that the alert is posted in the trading section. In other words, if we are writing about a speculative position, it means that it is up-to-date on the day it was posted. We are also featuring the initial target prices to decide whether keeping a position on a given day is in tune with your approach (some moves are too small for medium-term traders, and some might appear too big for day-traders).
Additionally, you might want to read why our stop-loss orders are usually relatively far from the current price.
Please note that a full position doesn't mean using all of the capital for a given trade. You will find details on our thoughts on gold portfolio structuring in the Key Insights section on our website.
As a reminder - "initial target price" means exactly that - an "initial" one. It's not a price level at which we suggest closing positions. If this becomes the case (like it did in the previous trade), we will refer to these levels as levels of exit orders (exactly as we've done previously). Stop-loss levels, however, are naturally not "initial", but something that, in our opinion, might be entered as an order.
Since it is impossible to synchronize target prices and stop-loss levels for all the ETFs and ETNs with the main markets that we provide these levels for (gold, silver and mining stocks - the GDX ETF), the stop-loss levels and target prices for other ETNs and ETF (among other: UGL, GLL, AGQ, ZSL, NUGT, DUST, JNUG, JDST) are provided as supplementary, and not as "final". This means that if a stop-loss or a target level is reached for any of the "additional instruments" (GLL for instance), but not for the "main instrument" (gold in this case), we will view positions in both gold and GLL as still open and the stop-loss for GLL would have to be moved lower. On the other hand, if gold moves to a stop-loss level but GLL doesn't, then we will view both positions (in gold and GLL) as closed. In other words, since it's not possible to be 100% certain that each related instrument moves to a given level when the underlying instrument does, we can't provide levels that would be binding. The levels that we do provide are our best estimate of the levels that will correspond to the levels in the underlying assets, but it will be the underlying assets that one will need to focus on regarding the signs pointing to closing a given position or keeping it open. We might adjust the levels in the "additional instruments" without adjusting the levels in the "main instruments", which will simply mean that we have improved our estimation of these levels, not that we changed our outlook on the markets. We are already working on a tool that would update these levels daily for the most popular ETFs, ETNs and individual mining stocks.
Our preferred ways to invest in and to trade gold along with the reasoning can be found in the how to buy gold section. Furthermore, our preferred ETFs and ETNs can be found in our Gold & Silver ETF Ranking.
As a reminder, Gold & Silver Trading Alerts are posted before or on each trading day (we usually post them before the opening bell, but we don't promise doing that each day). If there's anything urgent, we will send you an additional small alert before posting the main one.
Thank you.
Przemyslaw Radomski, CFA
Founder, Editor-in-chief

