

Briefly: in our opinion, full (300% of the regular position size) speculative short positions in junior mining stocks are justified from the risk/reward point of view at the moment of publishing this Alert.
Like yesterday, let’s once again start with the fundamental overview of the current situation on the market.
Now You See Me, Now You Don’t
Inflation. Inflation. Inflation. No one has written more about inflation over the last eight months than me. However, with investors’ propensity to undershoot and overshoot reality, we find ourselves on the other side of the coin.
To explain, while Fed Chairman Jerome Powell was dismissing inflation in early 2021, I warned that pricing pressures would remain for much longer than he expected. I wrote on Apr. 30:
With Powell changing his tune from not seeing any “unwelcome” inflation on Jan. 14 to “we are likely to see upward pressure on prices, but [it] will be temporary” on Apr. 28, can you guess where this story is headed next?
However, with the old narrative of ‘no inflation’ morphing into fears of ‘hyperinflation,’ market participants have gone from one extreme to the other. And in the process, the ‘panic buying’ has uplifted gold, silver, and mining stocks.
However, while we remain bullish on inflation and expect hot prints to elicit more hawkish rhetoric (and policy) from the Fed, the U.S. dollar has begun the disinflationary unwind.
To explain, I wrote on Sep. 30:
Powell’s only hope to curb inflation is to strengthen the U.S. dollar and weaken commodity prices. For context, major futures contracts are priced in U.S. dollars. And when the dollar rallies, it’s more expensive for foreign buyers (in their currency) to purchase the underlying commodities. As a result, a stronger U.S. dollar often stifles demand. And with the current supply/demand dynamics favoring higher commodity prices, Powell will have to work his magic, strengthen the dollar, and reduce commodities demand if he wants his inflation problem to subside.
To that point, with the EUR/USD falling to a new 2021 low on Nov. 11 and the USD Index rising to a new 2021 high, the stronger the U.S. dollar, the more disinflationary the U.S. economy becomes.
Please see below:
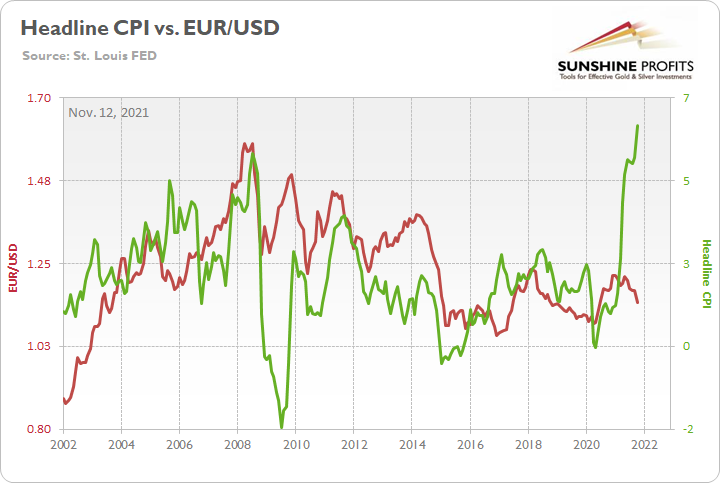
To explain, the green line above tracks the year-over-year (YoY) percentage change in the headline Consumer Price Index (CPI), while the red line above tracks the EUR/USD. For context, the EUR/USD accounts for nearly 58% of the movement of the USD Index.
If you analyze the relationship, notice how peaks in the EUR/USD often coincide with peaks in the headline CPI? It’s no coincidence. When the U.S. dollar strengthens, it pressures emerging markets (commodity producing countries), makes dollar-denominated debt more expensive (in currency-adjusted terms), and thus, stifles global demand for commodities. More importantly, though, it often reduces the U.S.’s inflationary pressures.
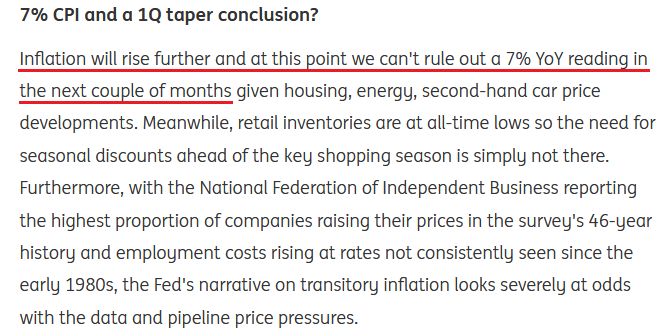
Thus, while investors’ position for 1970’s hyperinflation, the reality is that perceptions have gone from too cold to too hot. For example, ING – which was bullish on the EUR/USD and expected it to rally to “1.25 in 2021, with strong upside risks to 1.30” – now predicts that the headline CPI could hit 7% in the coming months.
ING’s Chief International Economist James Knightley wrote on Nov. 10:
 Source: ING
However, while he concluded that “QE tapering will be accelerated and rate hikes will come sooner” (which is bearish for the PMs), uncontrolled inflation remains unlikely. For example, the S&P Goldman Sachs Commodity Index (S&P GSCI) increased by 5.75% in September and by 5.47% in October. Conversely, the index is down by roughly 1% so far in November. And with producer inflation leading consumer inflation, a slowdown of the former should result in a slowdown of the latter.
For context, the S&P GSCI contains 24 commodities from all sectors: six energy products, five industrial metals, eight agricultural products, three livestock products and two precious metals. However, energy accounts for roughly 54% of the index’s movement.
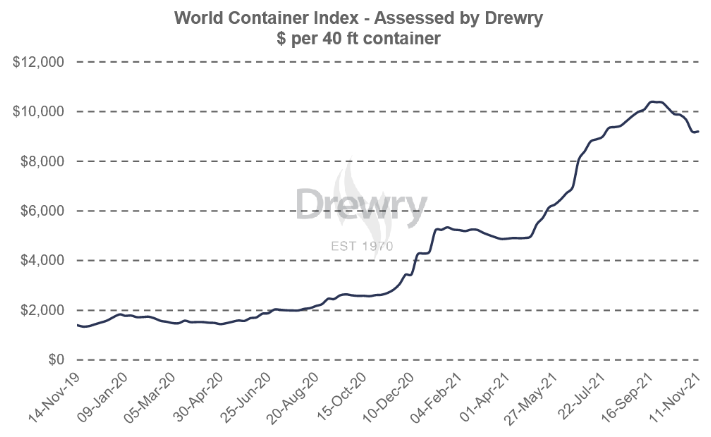
Second, I’ve written extensively about how shipping costs have been on fire in 2021. And with COVID-19 outbreaks in China slowing down production – the U.S. imports more goods from China than any other country – skyrocketing shipping costs were extremely inflationary.
However, the upward pressure has already subsided. And with the Drewry World Container Index peaking in mid-September, a 7% inflation print seems too optimistic.
Please see below:
Third, I’ve highlighted on several occasions how the Commodity Producer Price Index (PPI) often leads the following month’s headline CPI. And after the former increased by 2% month-over-month (MoM) on Nov. 9 – which is a material MoM increase – and by 22.2% YoY (a new 2021 high), it implies a headline CPI print of roughly 5.75% to 6.25% when the data is released on Dec. 10.
Please see below:
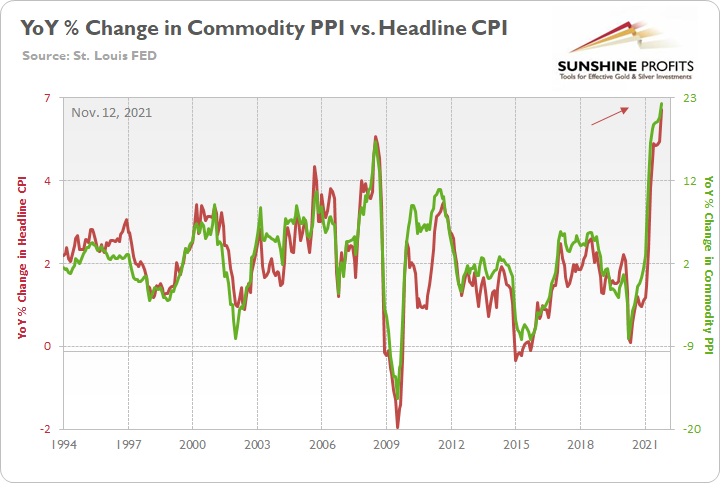
To explain, the green line above tracks the YoY percentage change in the commodity PPI, while the red line above tracks the YoY percentage change in the headline CPI. If you analyze the relationship, you can see that the pair have a close connection.
To that point, after the headline CPI slightly outperformed the commodity PPI in October (follow the black arrow below), the outperformance could result in mean reversion next month.
Please see below:
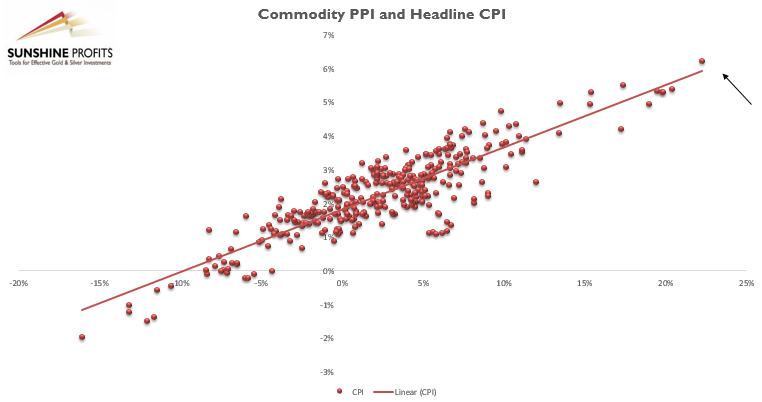
To explain, the scatterplot above depicts the relationship between the headline CPI and the commodity PPI (since 1994). For context, the headline CPI is plotted on the vertical axis, while the commodity PPI is plotted on the horizontal axis. If you analyze their movement, you can see that the pair have a strong linear relationship. And again, while the S&P GSCI’s fervor in September and October filtered into the commodity PPI, and then into the headline CPI, if the S&P GSCI’s November weakness persists, the feedback loop means that the headline CPI should follow suit.
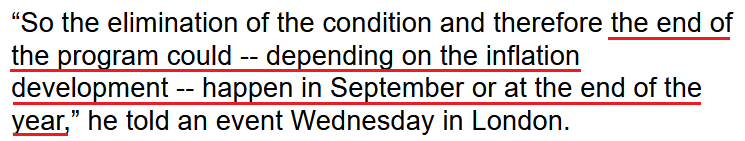
Finally, while U.S. dollar strength is bearish for inflation, and more importantly, bearish for the PMs, the USD Index’s fundamental foundation remains robust. For example, ECB Governing Council member Robert Holzmann is one of the group’s hawkish members. He has been sounding the alarm on inflation for months and called the ECB’s dovish stance in July “a step too far.”
However, even he admitted on Nov. 10 that the ECB’s bond-buying program should remain in place until at least September 2022. For context, the ECB has been adamant that it won’t raise interest rates until after its bond purchases end.
Please see below:
 Source: Bloomberg
Conversely, with the Fed’s taper concluding in June 2022 (expected) and the futures market pricing in rate hikes in July and September 2022, the USD Index’s uptrend has plenty of room to run.
The bottom line? With the inflation narrative shifting from ‘no big deal’ to ‘out of control,’ investors had it wrong then, and they likely have it wrong now. Inflation is hot, no doubt about it. But the notion of 1970s-style hyperinflation is much more semblance than substance. At least for now. The U.S. dollar is rallying (disinflationary), the taper is underway (disinflationary), U.S. Treasury yields are rallying (disinflationary) and the FOMC can raise interest rates without crashing the U.S. economy. As a result, the 2021 theme of ‘USD Index up, PMs down’ should resurface sooner rather than later.
In conclusion, the PMs rallied on Nov. 11 and their recent ascent rivals the summer of 2020. However, with investors misreading the inflation story once again, a sharp reversal will likely materialize over the medium term, perhaps much sooner. To that point, when too many investors move in one direction, it’s often wise to take the other side of the trade.
The when aspect is – as always – the most interesting one for precious metals investors and traders, and that’s what I commented on in yesterday’s analysis (I encourage you to read it, if you haven’t had the chance to do so yet). I wrote the following about the GDX ETF chart:
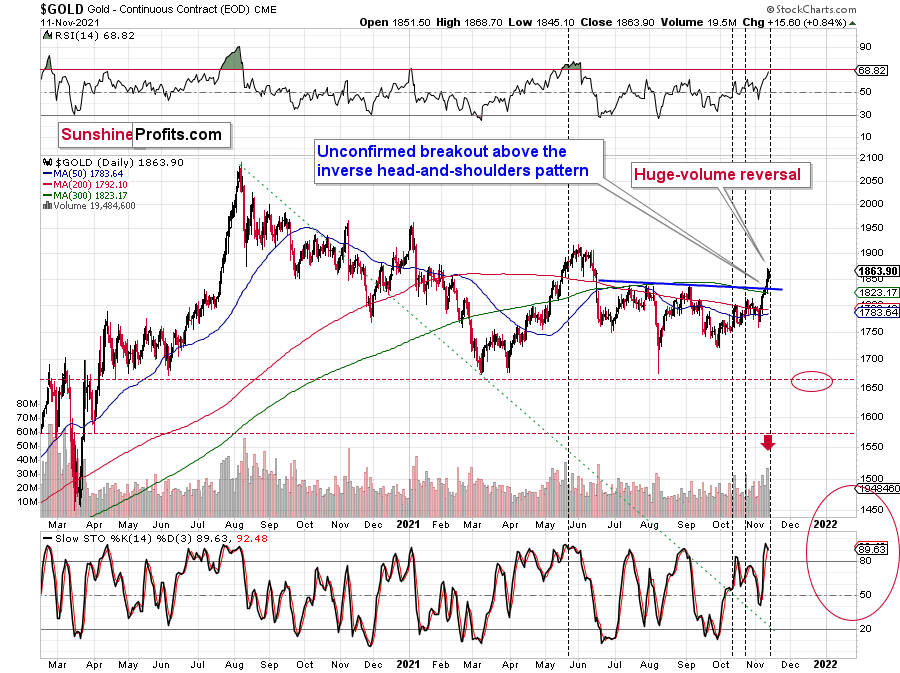
Furthermore, looking at another proxy for the precious metals mining stocks – the GDX ETF - provides us with an even more bearish indication.
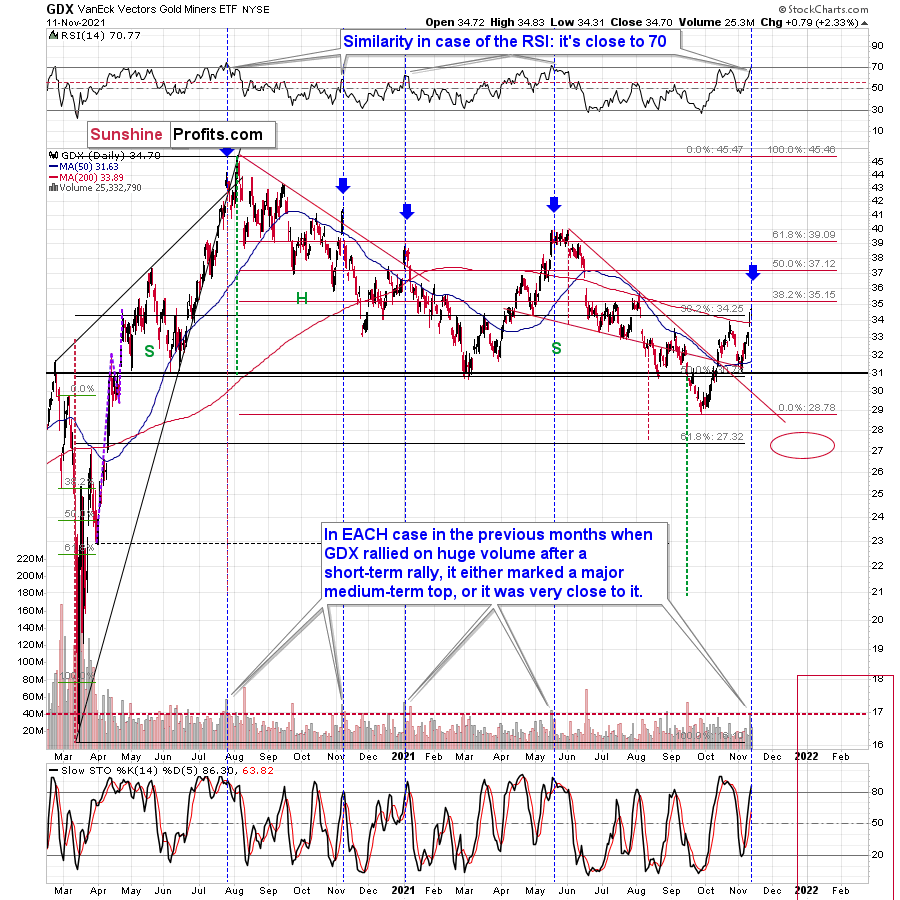
The GDX ETF rallied on huge volume yesterday (marked with red dashed line to make comparisons easier), and there were only 4 cases in the recent past when we saw something like that after a visible short-term rally.
In EACH of those 4 cases, GDX was after a sharp daily rally.
In EACH of those 4 cases, GDX-based RSI indicator (upper part of the chart) was trading close to 70.
The rallies that immediately preceded these 4 cases:
- The July 27, 2020 session was immediately preceded by a 29-trading-day rally that took the GDX about 42% higher. It was 7 trading days before the final top (about 24% of time).
- The November 5, 2020 session was immediately preceded by a 5-trading-day rally that took the GDX about 14%-15% higher (the high-volume day / the top). It was 1 trading day before the final top (20% of time).
- The January 4, 2021 session was immediately preceded by a 26-trading-day rally that took the GDX about 17%-18% higher (the high-volume day / the top). It was 1 trading day before the final top (about 4% of time).
- The May 17, 2021 session was immediately preceded by a 52-trading-day rally that took the GDX about 30% higher. It was 7 trading days before the final top (about 13% of time).
So, as you can see these sessions have even more in common than it seemed at the first sight. The sessions formed soon before the final tops (4% - 24% of time of the preceding rally before the final top), but the prices didn’t move much higher compared to how much they had already rallied before the high-volume sessions.
Consequently, since the history tends to rhyme, we can expect the GDX ETF to move a bit higher here, but not significantly so, and we can expect this extra move higher to take between an additional 1 and 8 trading days.
Why 1 – 8 trading days? Because that’s 4% - 24% of time based the preceding rally (that took 30 trading days).
Since it’s unlikely to take the mining stocks much higher, and the reversal could take place as soon as today, I don’t think that making adjustments to the current short positions in the mining stocks is justified from the risk to reward point of view.
Is there a meaningful resistance level that would be likely to trigger a decline in mining stocks? Yes! The GDX ETF is just below its 38.2% Fibonacci retracement level based on the August 2020 – September 2021 decline. The resistance is slightly above $35, so that’s when the final top could form.
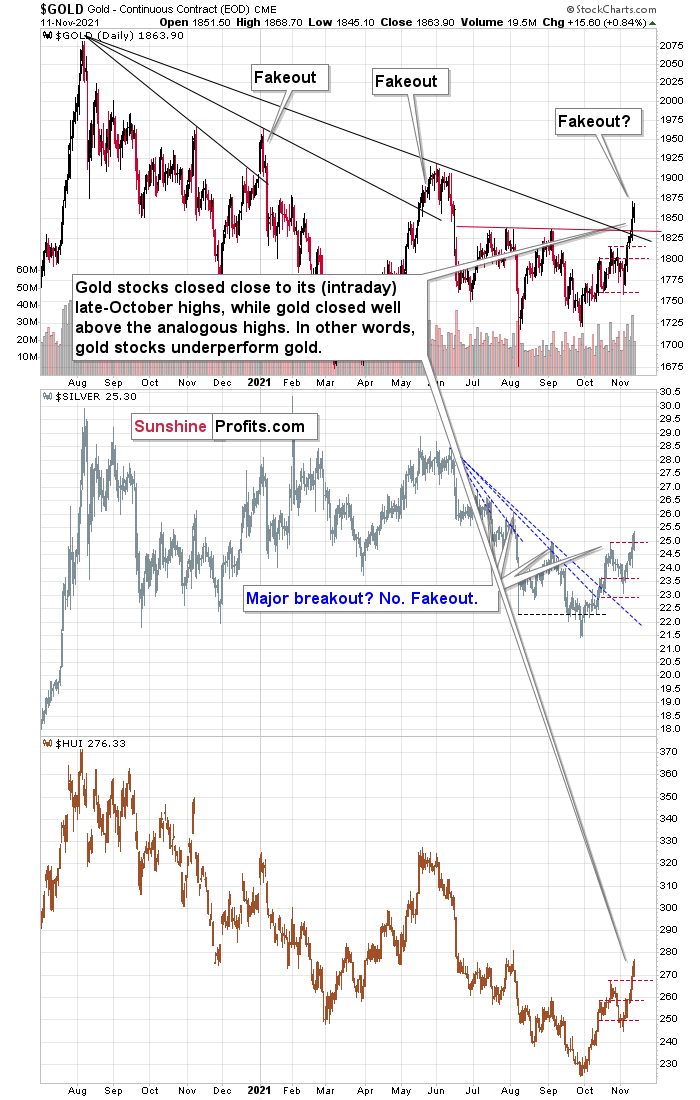
Today’s pre-market rally in gold doesn’t invalidate any of the above. In fact, it fits the above-described narrative. Let’s keep in mind that if/once gold invalidates its breakout above the neck level of the inverse head and shoulders pattern, gold miners could fall particularly hard.
Naturally, it’s your capital, and you can take any decision as you want, but it’s my responsibility to report to you the situation exactly as I see it and it’s exactly like I wrote above. In fact, it seems that now is a good time to be entering short positions in the mining stocks if one didn’t have any previously (I wouldn’t increase the size of the existing positions, though). This trade is definitely testing our patience, and while I can’t make any promises regarding market performance, if the history does indeed repeat itself and the decline that follows is similar to what we saw in 2013, the patience should be extremely well rewarded.
The GDX ETF closed below $35 yesterday, and today, the countdown is at 0 – 7 trading days. This means that the top might have already been formed yesterday, but it’s not 100% clear if that was the case.
Given today’s pre-market moved lower in gold, it could be the case. Or given the fact that gold didn’t move to new intraday highs yesterday. Still, as the above countdown shows, it doesn’t have to be.
The shape of the current upswing in gold also resembles what we saw in late 2020 and early 2021 (two local tops and then a sharp rally to the final top), but that’s not a very strong indication and similarity, as it’s not something that formed over a longer period and the price moves are rather generic.
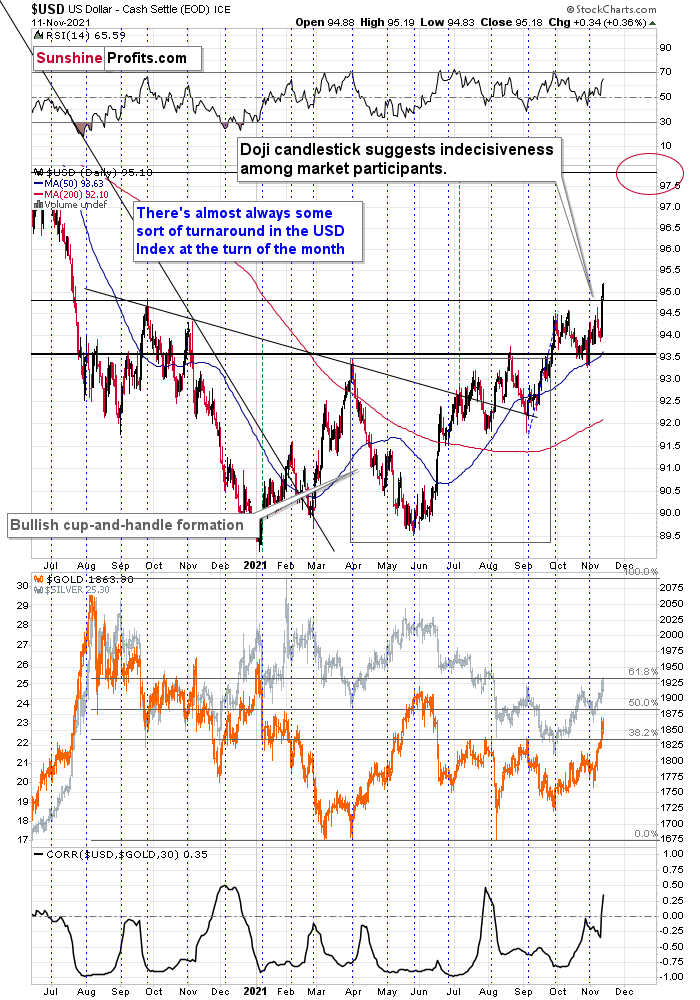
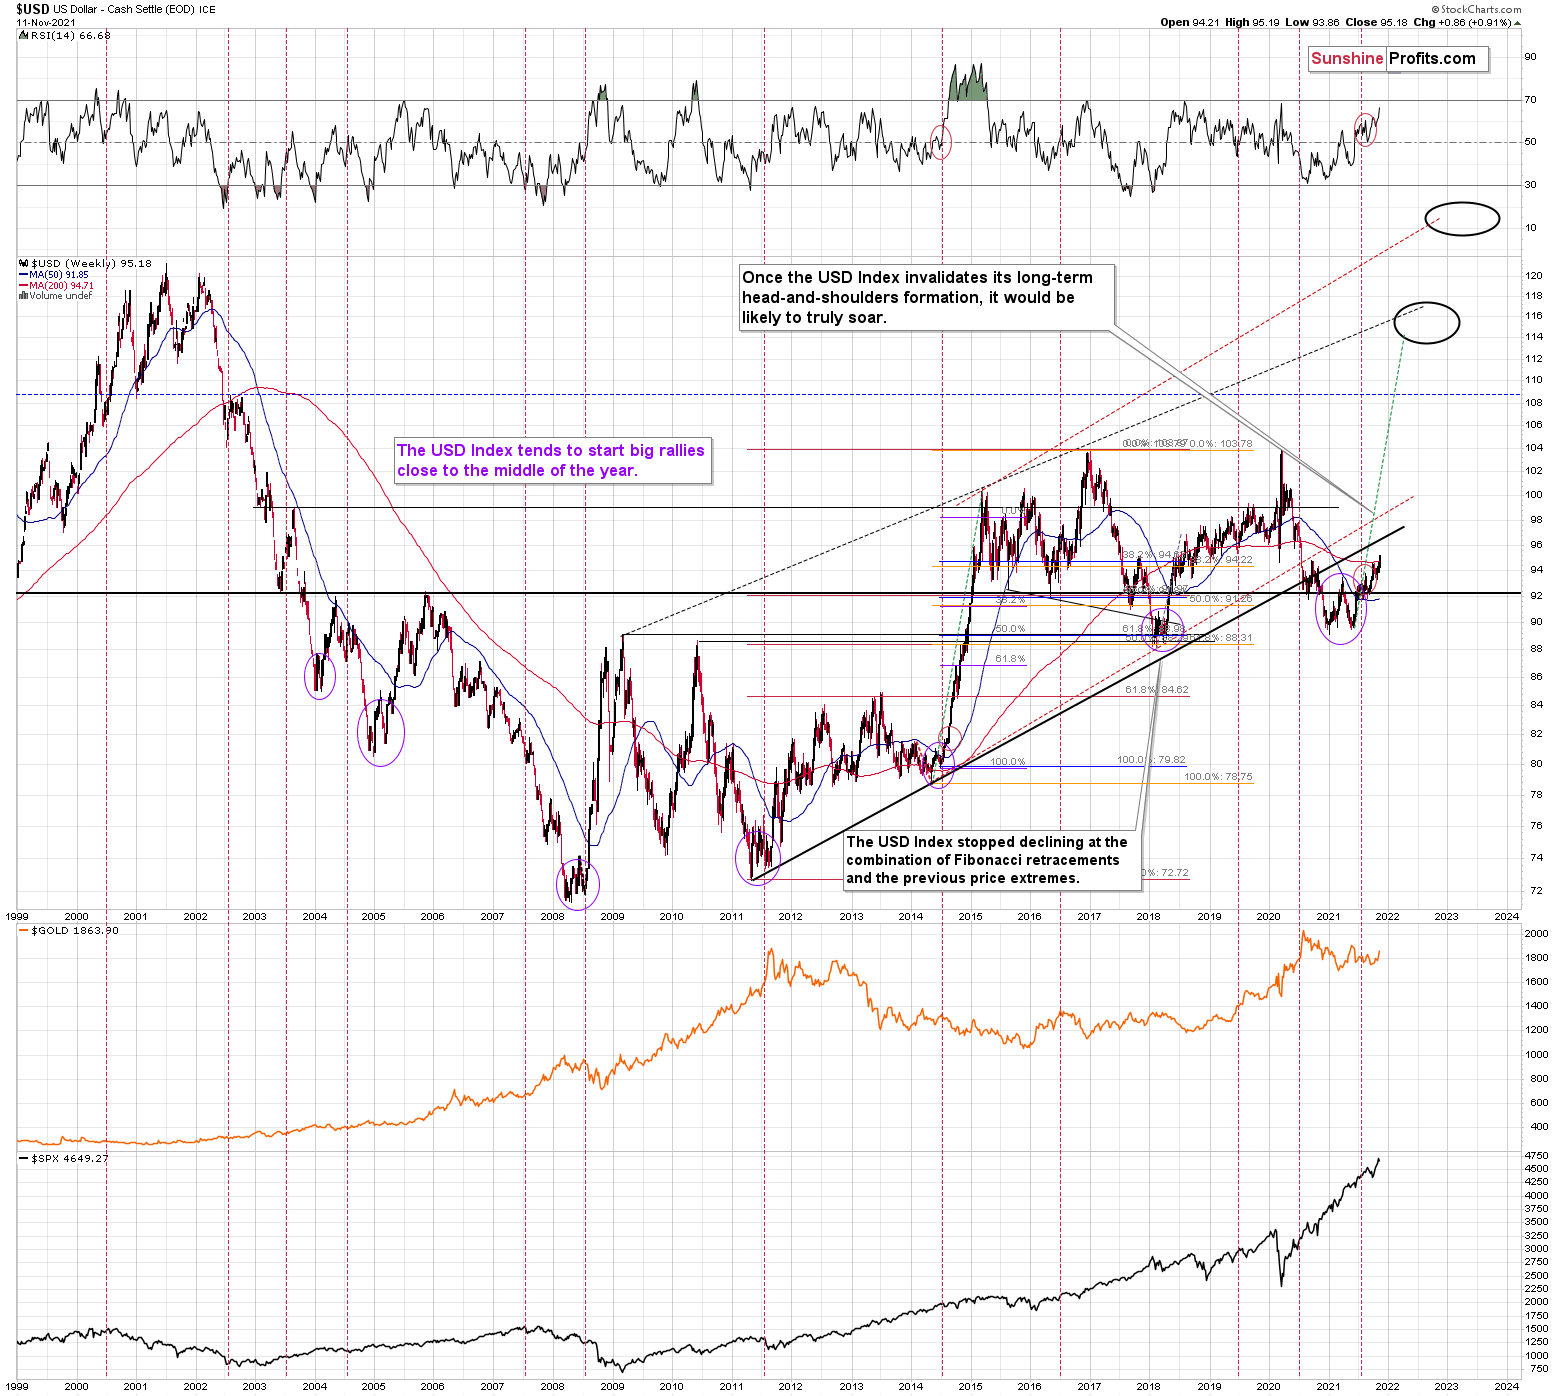
Still, based on the USD Index’s decisive breakout to new yearly highs (first chart) and given the self-similarity in it to what happened in 2014 (second chart), it seems that we might see a huge rally here.
Consequently, even though gold is not responding to USD’s rally yet, we’re likely to see a rally big enough to really trigger bigger declines in the prices of the precious metals. With the current value of the USD Index close to 95, and the next resistance above 97, we’re likely to see plenty of days when gold could either confirm its strength or invalidate it. Please remember the GDX-based countdown, too.
It is rarely the case that once can say WHY something is taking place in the markets, but it seems that what we have right now can indeed be explained. Namely, as I described earlier today and yesterday, the markets are focusing on higher inflation numbers, fearing hyperinflation, while not paying attention to the fact that the interest rates can be increased, and markets can start expecting them to be much higher in the following years. And if not “much” higher, then “high enough” to trigger a decline in gold, anyway.
Also, please note that one interesting thing happened on the markets yesterday, and that is that the Stochastic indicator based on the price of gold just flashed
The indication is not yet huge, and it’s true that there were quite a few fake sell signals from this indicator, but when we add the RSI (close to 70) to the mix, we the get a situation that’s similar to the late-May top, early January 2021 top, the August 2020 top, the April 2020 top, and the February 2020 top. We also get a situation that’s similar to just one case where this combination of factors didn’t trigger declines – in the second half of July, 2020.
But with 5 similar cases that were followed by bigger declines and just one that was not followed by bigger declines, it seems fair to say that the overall implications of this combination are bearish.
Overview of the Upcoming Part of the Decline
- It seems to me that the current corrective upswing in gold is about to be over soon, and the next short-term move lower is about to begin. Since it seems to be another short-term move more than it seems to be a continuation of the bigger decline, I think that junior miners would be likely to (at least initially) decline more than silver.
- It seems that the first stop for gold will be close to its previous 2021 lows, slightly below $1,700. Then it will likely correct a bit, but it’s unclear if I want to exit or reverse the current short position based on that – it depends on the number and the nature of the bullish indications that we get at that time.
- After the above-mentioned correction, we’re likely to see a powerful slide, perhaps close to the 2020 low ($1,450 - $1,500).
- If we see a situation where miners slide in a meaningful and volatile way while silver doesn’t (it just declines moderately), I plan to – once again – switch from short positions in miners to short positions in silver. At this time, it’s too early to say at what price levels this could take place, and if we get this kind of opportunity at all – perhaps with gold close to $1,600.
- I plan to exit all remaining short positions when gold shows substantial strength relative to the USD Index while the latter is still rallying. This might take place with gold close to $1,350 - $1,400. I expect silver to fall the hardest in the final part of the move. This moment (when gold performs very strongly against the rallying USD and miners are strong relative to gold after its substantial decline) is likely to be the best entry point for long-term investments, in my view. This might also happen with gold close to $1,375, but it’s too early to say with certainty at this time. I expect the final bottom to take place near the end of the year, perhaps in mid-December. It is not set in stone that PMs have to bottom at that time. If not then, then early 2022 would become a likely time target. The official start of tapering will serve as an additional indication or confirmation of the bottom.
- As a confirmation for the above, I will use the (upcoming or perhaps we have already seen it?) top in the general stock market as the starting point for the three-month countdown. The reason is that after the 1929 top, gold miners declined for about three months after the general stock market started to slide. We also saw some confirmations of this theory based on the analogy to 2008. All in all, the precious metals sector is likely to bottom about three months after the general stock market tops. The additional confirmation will come from the tapering schedule, as markets are likely to move on the rumor and reverse on the fact as they tend to do in general.
- The above is based on the information available today, and it might change in the following days/weeks.
You will find my general overview of the outlook for gold on the chart below:
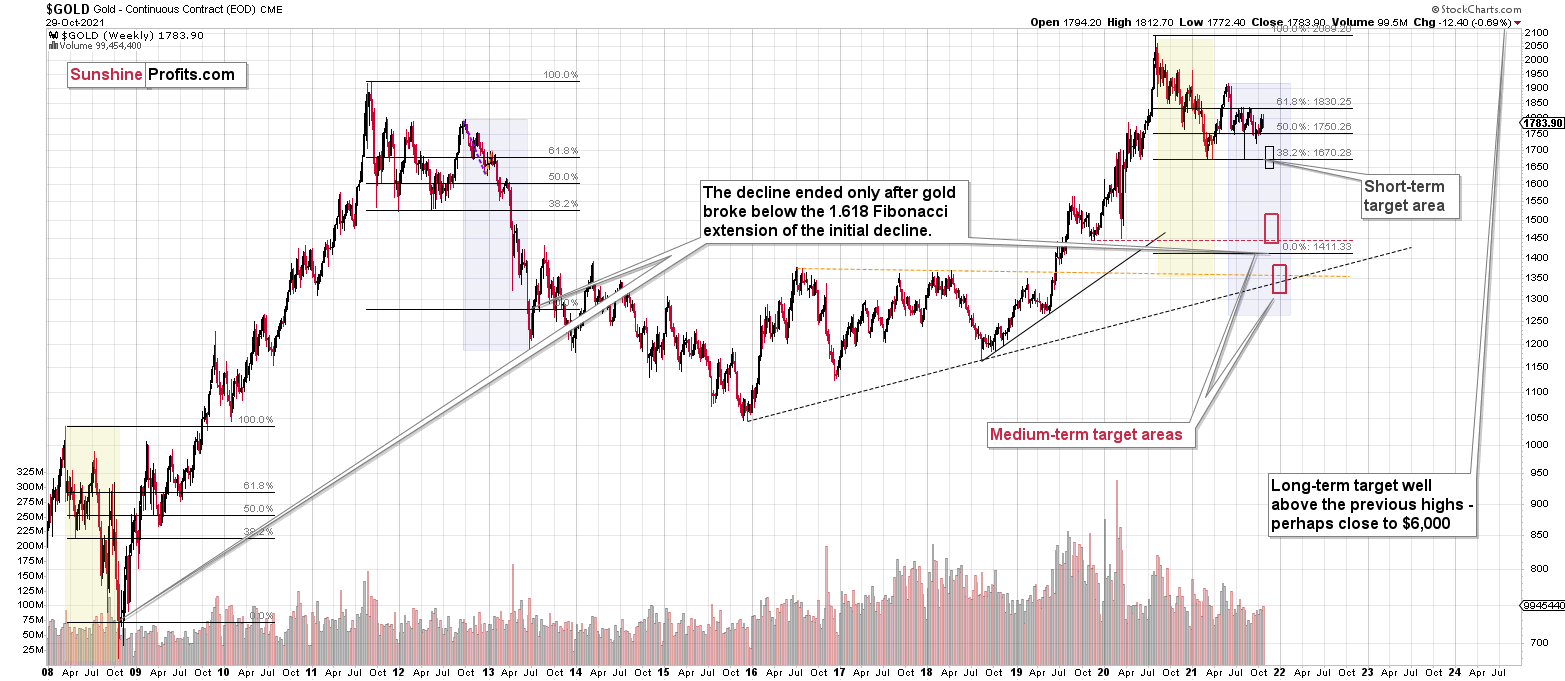
Please note that the above timing details are relatively broad and “for general overview only” – so that you know more or less what I think and how volatile I think the moves are likely to be – on an approximate basis. These time targets are not binding or clear enough for me to think that they should be used for purchasing options, warrants or similar instruments.
Letters to the Editor
Q: Hello PR,
We know you are doing your best, however, do you think it would have been from a R/R [risk/reward] basis for you to accept and/or rather suggest a countertrend rally (as you have done in the past) on this last rally all within the context of your med term bearish outlook on the PM's?
A: Thank you for your understanding and your support. With the benefit of hindsight, then naturally, it would have been better be ride this counter-trend move instead of waiting for the medium-term downtrend to return. However, at this time things don’t add up with regard to the bullish scenario in the medium term. Markets now seem to be overreacting to the inflation information, while downplaying the situation regarding long-term rates and possible hawkish surprises from the Fed.
If gold proves to be able to rally for longer along with rallying USD Index, then the outlook might change to bullish. But even if this is the case, then short-term corrections are likely to happen, and one will be due rather sooner than later (please note the GDX-based countdown). And the size of the upcoming decline will tell us a lot about the medium-term future. If it’s small, we’ll have a good sign of strength of the market. If the decline is big, well, we’ll know that it was all yet another counter-trend correction, like others that we’ve seen in the previous months. For now, the outlook remains bearish.
Q: I have a question about your recent analysis. You stated yesterday in the Trading Update No. 2 that you were seeing indications that were almost bullish for gold -- pending confirmation. So far today GDXJ is looking very strong still even in the face of a surging USDX. So my questions are related: (1) If you do decide that the outlook has become bullish for the PMs, would this likely be a short term thing before reverting to bearish, or do you believe this could possibly be the big turning point? (2) Your excellent analysis notwithstanding, I've been reading you several months and you've been telling readers you're looking for the point at which the PMs show significant strength in the face of a rising USDX. That's exactly what we see right now... so how does this relate to that part of your strategy?
A: It could be the case that what we see now in gold & USD Index is the major buy signal that I’ve been writing about for months, but it’s more likely in my view that it isn’t. It all (gold’s strength along with the one of the USD Index) started after erratic reactions to perplexing news coming from the eurozone, which added the euro to the mix. What we see now, is not necessarily based on gold being strong compared to the USD Index, but actually based on the euro being weak relative to both of them.
What I would like to see as gold’s true bottoming sign is a moment when nothing major is happening in the eurozone (markets don’t react profoundly in the immediate aftermath of any news / comments regarding the eurozone) and then gold shows strength while the USD Index continues to rally. To add credibility to it, it would be likely to happen AFTER gold declines, not after it’s consolidation or a rally. After all, bottoms, and especially key bottoms, tend to take place when everyone hates a given market or at least they are fearful that the price will never stop falling (and it then recovers nonetheless).
And to answer your first question, this could be the big turning point as well as a short-term turning point, but it seems much more likely to me that the current short-term strength will be proven to have been a counter-trend short-term (!) rally only.
Summary
The PMs rallied this week, and their momentum has teetered on euphoria. However, when prices diverge from fundamentals, sharp sell-offs often occur when sentiment shifts. As a result, caution is warranted, and the PMs’ recent bout of optimism will likely end in disappointment. This disappointment could start within the next few days, based on analogies to very similar cases in mining stocks. The decline in the GDX could start right away or once it moves to or slightly above $35.
Since it seems that the PMs are likely about to start another short-term move lower more, I think that junior miners would be likely to (at least initially) decline more than silver.
From the medium-term point of view, the key two long-term factors remain the analogy to 2013 in gold and the broad head and shoulders pattern in the HUI Index. They both suggest much lower prices ahead.
It seems that our profits from the short positions are going to become truly epic in the following months.
After the sell-off (that takes gold to about $1,350 - $1,500), I expect the precious metals to rally significantly. The final part of the decline might take as little as 1-5 weeks, so it's important to stay alert to any changes.
Most importantly, please stay healthy and safe. We made a lot of money last March and this March, and it seems that we’re about to make much more on the upcoming decline, but you have to be healthy to enjoy the results.
As always, we'll keep you - our subscribers - informed.
By the way, we’re currently providing you with the possibility to extend your subscription by a year, two years, or even three years with a special 20% discount. This discount can be applied right away, without the need to wait for your next renewal – if you choose to secure your premium access and complete the payment upfront. The boring time in the PMs is definitely over, and the time to pay close attention to the market is here. Naturally, it’s your capital, and the choice is up to you, but it seems that it might be a good idea to secure more premium access now while saving 20% at the same time. Our support team will be happy to assist you in the above-described upgrade at preferential terms – if you’d like to proceed, please contact us.
To summarize:
Trading capital (supplementary part of the portfolio; our opinion): Full speculative short positions (300% of the full position) in junior mining stocks are justified from the risk to reward point of view with the following binding exit profit-take price levels:
Mining stocks (price levels for the GDXJ ETF): binding profit-take exit price: $35.73; stop-loss: none (the volatility is too big to justify a stop-loss order in case of this particular trade)
Alternatively, if one seeks leverage, we’re providing the binding profit-take levels for the JDST (2x leveraged) and GDXD (3x leveraged – which is not suggested for most traders/investors due to the significant leverage). The binding profit-take level for the JDST: $16.18; stop-loss for the JDST: none (the volatility is too big to justify a SL order in case of this particular trade); binding profit-take level for the GDXD: $32.08; stop-loss for the GDXD: none (the volatility is too big to justify a SL order in case of this particular trade).
For-your-information targets (our opinion; we continue to think that mining stocks are the preferred way of taking advantage of the upcoming price move, but if for whatever reason one wants / has to use silver or gold for this trade, we are providing the details anyway.):
Silver futures downside profit-take exit price: $19.12
SLV profit-take exit price: $17.72
ZSL profit-take exit price: $41.38
Gold futures downside profit-take exit price: $1,683
HGD.TO – alternative (Canadian) inverse 2x leveraged gold stocks ETF – the upside profit-take exit price: $12.48
HZD.TO – alternative (Canadian) inverse 2x leveraged silver ETF – the upside profit-take exit price: $30.48
Long-term capital (core part of the portfolio; our opinion): No positions (in other words: cash
Insurance capital (core part of the portfolio; our opinion): Full position
Whether you already subscribed or not, we encourage you to find out how to make the most of our alerts and read our replies to the most common alert-and-gold-trading-related-questions.
Please note that we describe the situation for the day that the alert is posted in the trading section. In other words, if we are writing about a speculative position, it means that it is up-to-date on the day it was posted. We are also featuring the initial target prices to decide whether keeping a position on a given day is in tune with your approach (some moves are too small for medium-term traders, and some might appear too big for day-traders).
Additionally, you might want to read why our stop-loss orders are usually relatively far from the current price.
Please note that a full position doesn't mean using all of the capital for a given trade. You will find details on our thoughts on gold portfolio structuring in the Key Insights section on our website.
As a reminder - "initial target price" means exactly that - an "initial" one. It's not a price level at which we suggest closing positions. If this becomes the case (like it did in the previous trade), we will refer to these levels as levels of exit orders (exactly as we've done previously). Stop-loss levels, however, are naturally not "initial", but something that, in our opinion, might be entered as an order.
Since it is impossible to synchronize target prices and stop-loss levels for all the ETFs and ETNs with the main markets that we provide these levels for (gold, silver and mining stocks - the GDX ETF), the stop-loss levels and target prices for other ETNs and ETF (among other: UGL, GLL, AGQ, ZSL, NUGT, DUST, JNUG, JDST) are provided as supplementary, and not as "final". This means that if a stop-loss or a target level is reached for any of the "additional instruments" (GLL for instance), but not for the "main instrument" (gold in this case), we will view positions in both gold and GLL as still open and the stop-loss for GLL would have to be moved lower. On the other hand, if gold moves to a stop-loss level but GLL doesn't, then we will view both positions (in gold and GLL) as closed. In other words, since it's not possible to be 100% certain that each related instrument moves to a given level when the underlying instrument does, we can't provide levels that would be binding. The levels that we do provide are our best estimate of the levels that will correspond to the levels in the underlying assets, but it will be the underlying assets that one will need to focus on regarding the signs pointing to closing a given position or keeping it open. We might adjust the levels in the "additional instruments" without adjusting the levels in the "main instruments", which will simply mean that we have improved our estimation of these levels, not that we changed our outlook on the markets. We are already working on a tool that would update these levels daily for the most popular ETFs, ETNs and individual mining stocks.
Our preferred ways to invest in and to trade gold along with the reasoning can be found in the how to buy gold section. Furthermore, our preferred ETFs and ETNs can be found in our Gold & Silver ETF Ranking.
As a reminder, Gold & Silver Trading Alerts are posted before or on each trading day (we usually post them before the opening bell, but we don't promise doing that each day). If there's anything urgent, we will send you an additional small alert before posting the main one.
Thank you.
Przemyslaw Radomski, CFA
Founder, Editor-in-chief

