

Briefly: in our opinion, full (300% of the regular position size) speculative short positions in junior mining stocks are justified from the risk/reward point of view at the moment of publishing this Alert.
Let’s start today’s analysis with a question I just received. It was about whether I felt that GLD and GDX were forming a W-shaped bottom, and whether I would consider going long if the price kept moving up, at least for a short term.
Starting with the last part, it’s a definite “yes”. I would definitely “consider” going long. In fact, I consider going long each day (and I featured long positions in the precious metals sector earlier this year). My aim is to look at the charts as if I didn’t have any investment or trading position open, and to determine IF and what kind of position I would like to open on a given day based on what I see in the charts. This approach helps to avoid the so-called “conservatism bias”, which emerges when one sticks to a belief, outlook, opinion (or trading position in this case) just because they had them previously. People with strong conservatism bias might even not want to read / listen to anything that might challenge their original views.
Anyway, as soon as the bearish indications are either nullified or overwhelmed by bullish factors, I’ll be happy to go long the precious metals and/or mining stocks. However, most likely, the situation will have turned neutral before that happens or not bearish enough to justify keeping the short position intact.
At this time, I continue to think that the outlook remains bearish and the short position in the mining stocks remains justified. It’s not a feeling, it’s an analysis-based opinion.
Is gold or GDX forming a W-shaped bottom? I don’t think so.
Ultimately, whether something was a W-shaped bottom or a horizontal consolidation becomes clear only after a breakdown below the previous lows, or after a sizable rally that is accompanied by other bullish confirmations.
We haven’t seen a breakdown to new lows recently, but we haven’t seen meaningful bullish confirmations either.
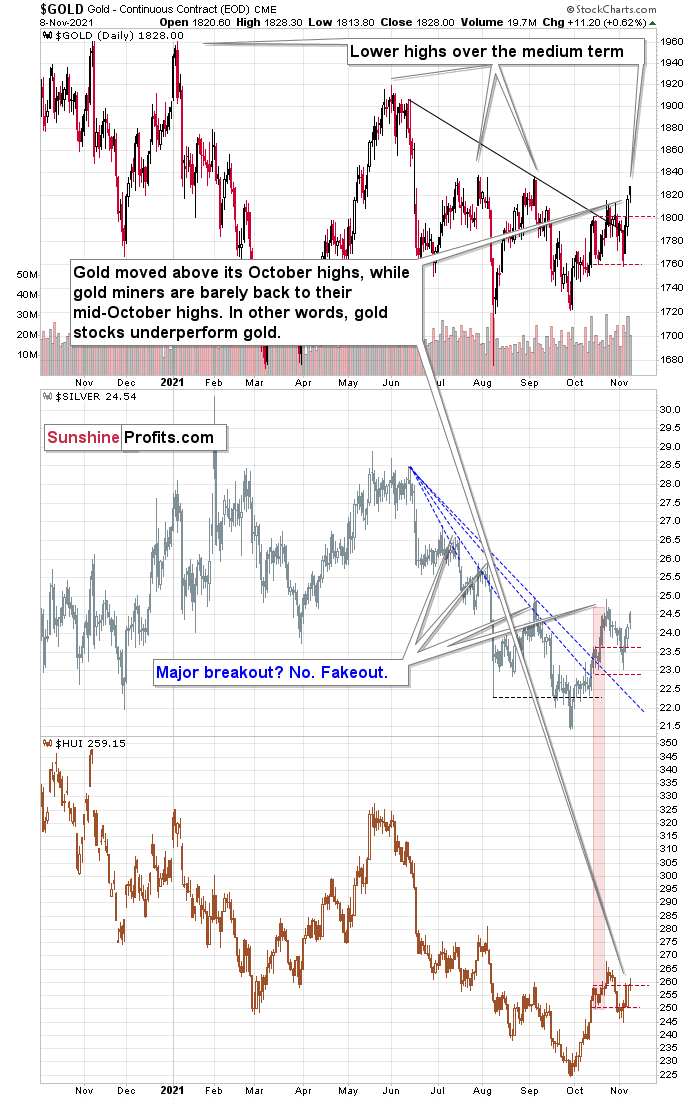
The key bullish ingredient that is missing, and something that provides us with clear bearish indications instead, is mining stocks’ relative strength.
The above charts clearly show how weak mining stocks are compared to gold, and it is particularly bearish given the support that miners have been receiving recently from the general stock market. The latter moved to new highs, helping the miners move up. And what did they do? They did move up indeed, but in a very weak manner.
From the short-term point of view, gold stocks are weak because they barely got back to their mid-October highs, let alone the October highs. Gold moved visibly above its recent highs, but the HUI Index – the flagship proxy for gold stocks – was barely affected. This is very bearish, and there’s no other way to call it.
Miners’ weakness doesn’t end there. Looking from a broader point of view, we see that miners are currently trading close to their March lows. Gold is now about $150 above its March low, so miners more or less ignored that move over the medium term. That’s not a small move, and the importance of this indication is not to be ignored.
Besides, let’s keep in mind that the USD Index remains above its previous 2021 highs, and the breakout above them was more than confirmed. This means that it’s likely to move to much higher values, even though it may seem that it will continue to hesitate and trade sideways “forever”.
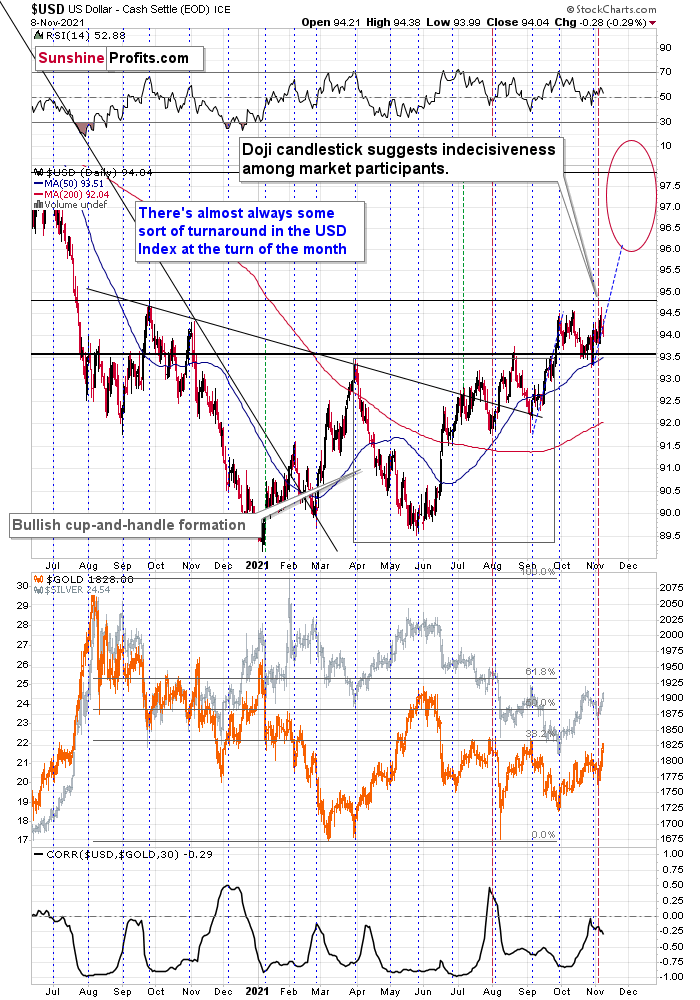
There’s a technical rule of thumb that says that the longer the base is, the bigger the following move is going to be. The post-breakout consolidation has been taking place for over a month, so it’s likely preparing the USD Index to move much higher. The implications for the precious metals sector are bearish.
Having said that, let’s take a look at the markets from a more fundamental angle.
A General Inquiry
With the Treasury General Account (TGA) moving from the penthouse to the outhouse, much has been made about its impact on the U.S. dollar, and, therefore, the PMs. For context, the TGA is akin to the U.S. government’s checking account. When tax receipts are collected and/or debt is issued, the proceeds end up in the TGA. Conversely, when fiscal outlays are made, the cash is withdrawn from the TGA.
Please see below:
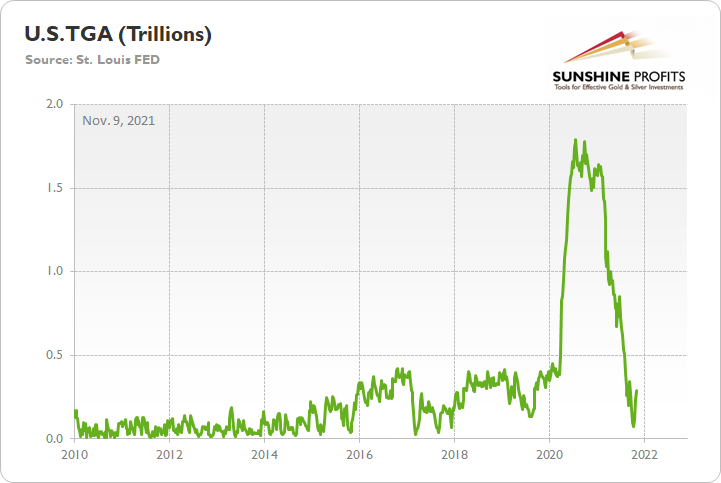
However, while investors search for narratives to explain the U.S. dollar’s 2021 ascent, the latest implies that the 2020 surge in the TGA resulted in less debt issuance in 2021. In turn, this strengthened the U.S. dollar.
In reality, though, currencies trade on a relative basis. To explain, when investors cite regional-specific data, it’s irrelevant when it’s not compared to the other currency’s region. For example, the EUR/USD quotes the number of U.S. dollars that can be obtained with one euro; for the euro to increase in value, the U.S. dollar must decline.
Despite that, though, Bitcoin enthusiasts cite the ‘death of the dollar’ as a major reason to own cryptocurrencies. However, what they together with other dollar bears miss is that the U.S. dollar can’t depreciate on its own. In real terms, sure, inflation can erode the U.S. dollar’s purchasing power. However, we’re focused on the exchange rate relative to other fiat currencies.
And if we run down the checklist:
- Interest rates are higher in the U.S. than in the Eurozone
- Inflation is higher in the U.S. than in the Eurozone
- Economic growth is higher in the U.S. than in the Eurozone
- The Fed has turned hawkish in advance of the ECB (and this should persist)
Thus, while some opine that the dollar is destined for devaluation, the reality is that if you’re short the dollar (USD Index), then you’re long the euro (approximately, it’s over 50% of the index). And with little to no fundamental data supporting a stronger euro, why should the U.S. dollar decline?
Second, the depletion of the TGA supported the fundamental outlook for the PMs. To explain, with the U.S. Treasury drawing down its cash hoard rather than issuing new debt, the supply of U.S. Treasuries hitting the open market declined. And with the Fed buying ~$120 billion worth of bonds per month, the combination of low supply and high Fed purchases made it easier to suppress U.S. nominal and real yields.
However, the dynamic has changed.
If new issuance helps increase the TGA, the Fed’s taper means that domestic and foreign institutions will have to pick up the slack. Moreover, with QE poised to hit net-zero in June 2022, market-implied interest rates will fund new Treasury issuance and the Fed’s influence will wane. More importantly, though, high Treasury issuance and low (finally zero) Fed purchases create a bullish fundamental environment for U.S. Treasury yields. This, in turn, creates a bearish fundamental environment for the PMs.
Circling back to the U.S. dollar, central bankers made the rounds on Nov. 8. And while I’ve mentioned this on numerous occasions, please remember that the EUR/USD and the USD/JPY combine to account for more than 71% of the USD Index’s movement.
Beginning with the latter, the Japanese Government changed its economic conditions index from “improving” to “weakening” on Nov. 8 – the first downgrade since August 2019. What’s more, its index of leading economic indicators – which is used to predict the direction of the Japanese economy in the months to come – decreased by 1.6 points in September and hit a seven-month low.
Please see below:
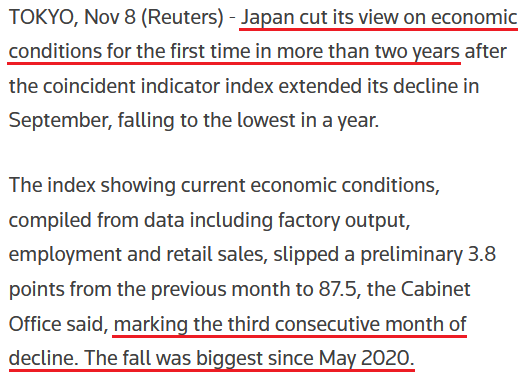 Source: Reuters
Now, turning to the former, ECB Chief Economist Philip Lane said on Nov. 8 that the Eurozone is in a “completely different” situation than other countries and that it would be “counter-productive to tighten monetary policy at the current juncture.” Moreover, he added that fiscal policy in Europe is “constrained by high aggregate national debt levels and the lack of a permanent central fiscal capacity.”
And what’s his solution to the problem?
 Source: the Financial Times
Thus, does the man leading the ECB’s economic projections sound like he expects a hawkish shift anytime soon? As a result, while the S&P 500’s eight-day winning streak has uplifted the PMs and kept a lid on the USD Index, the reality is that the U.S. dollar’s 2021 fundamentals have never been stronger. And looking ahead, more upside catalysts should emerge over the medium term.
To explain, while Fed Vice Chairman Richard Clarida said on Nov. 8 that the FOMC remains “a ways away from considering raising interest rates,” he added that a thorough recovery means that the “necessary conditions for raising the target range for the federal funds rate will have been met by year-end 2022.” For context, the FOMC’s original projections had the group tapering in 2023 and raising interest rates in 2024. However, the taper occurred in 2021 and an interest rate hike in 2022 has likely become the FOMC consensus.
Thus, with inflation surging and the Fed still materially behind the curve, a hawkish main event likely still awaits us.
For example, the U.S. Consumer Price Index (CPI) hits the wire on Wednesday. And while I wrote on Oct. 15 that we should expect another CPI print of roughly 5.25% to 5.75% when the data is released on Nov. 10, I also wrote the following on Sep. 24:
The only way for the Fed to control inflation is to increase the value of the U.S. dollar and decrease the value of commodities. However, with commodities’ fervor accelerating on Sep. 23 – a day when the USD Index declined – the price action should concern Chairman Jerome Powell. As a result, FOMC participants’ 2022 inflation forecast is likely wishful thinking and they may find that a faster liquidity drain (which is bullish for the U.S. dollar) is their only option to control the pricing pressures.
To that point, Clarida added on Nov. 8 that 2021’s inflation readings are “much more than a 'moderate' overshoot of our 2% longer-run inflation, objective and I would not consider a repeat performance next year a policy success.”
Likewise, Fed Governor Michelle Bowman said on Nov. 8:
“My main concern again is the outlook for inflation, which has remained elevated much longer than most of us expected earlier in the year.”
Philadelphia Fed President Patrick Harker said on Nov. 8:
“I don’t expect that the federal funds rate will rise before the tapering is complete. But we are monitoring inflation very closely and are prepared to take action, should circumstances warrant it.”
Chicago Fed President Charles Evans said on Nov. 8:
“I still tend to think we have time to be patient.” However, there is “greater upside risk to my inflation outlook than I had thought last summer.”
St. Louis Fed President James Bullard said on Nov. 8:
“If inflation is more persistent than we are saying right now, then I think we may have to take a little sooner action in order to keep inflation under control.”
The bottom line? While the rise and fall of the TGA may elicit theories about the U.S. dollar’s fundamental performance in 2021, the reality is that regional differentials are what matters. And with Japan’s economic outlook falling hard and the ECB sounding more dovish by the day, what are the fundamental catalysts for these currencies to appreciate relative to the U.S. dollar? As a result, the USD Index’s decline on Nov. 8 was likely a function of ‘risk-on’ sentiment. Outside of that, the U.S. dollar’s 2021 fundamental foundation is as strong as ever.
In conclusion, the PMs rallied on Nov. 8, and tracking the S&P 500 has become a popular trade. However, with momentum investors akin to investing tourists, they’re not buying the PMs for their technical or fundamental merits. They simply want to buy high and sell higher. However, once the gambit unravels (as it did numerous times in 2021), the PMs will likely suffer a sharp re-rating. As a result, the old adage of ‘stairs up, elevator down’ will likely confront the PMs over the medium term.
Overview of the Upcoming Part of the Decline
- It seems to me that the current corrective upswing in gold is over, and the next short-term move lower is about to begin. Since it seems to be another short-term move more than it seems to be a continuation of the bigger decline, I think that junior miners would be likely to (at least initially) decline more than silver.
- It seems that the first stop for gold will be close to its previous 2021 lows, slightly below $1,700. Then it will likely correct a bit, but it’s unclear if I want to exit or reverse the current short position based on that – it depends on the number and the nature of the bullish indications that we get at that time.
- After the above-mentioned correction, we’re likely to see a powerful slide, perhaps close to the 2020 low ($1,450 - $1,500).
- If we see a situation where miners slide in a meaningful and volatile way while silver doesn’t (it just declines moderately), I plan to – once again – switch from short positions in miners to short positions in silver. At this time, it’s too early to say at what price levels this could take place, and if we get this kind of opportunity at all – perhaps with gold close to $1,600.
- I plan to exit all remaining short positions when gold shows substantial strength relative to the USD Index while the latter is still rallying. This might take place with gold close to $1,350 - $1,400. I expect silver to fall the hardest in the final part of the move. This moment (when gold performs very strongly against the rallying USD and miners are strong relative to gold after its substantial decline) is likely to be the best entry point for long-term investments, in my view. This might also happen with gold close to $1,375, but it’s too early to say with certainty at this time. I expect the final bottom to take place near the end of the year, perhaps in mid-December. It is not set in stone that PMs have to bottom at that time. If not then, then early 2022 would become a likely time target. The official start of tapering will serve as an additional indication or confirmation of the bottom.
- As a confirmation for the above, I will use the (upcoming or perhaps we have already seen it?) top in the general stock market as the starting point for the three-month countdown. The reason is that after the 1929 top, gold miners declined for about three months after the general stock market started to slide. We also saw some confirmations of this theory based on the analogy to 2008. All in all, the precious metals sector is likely to bottom about three months after the general stock market tops. The additional confirmation will come from the tapering schedule, as markets are likely to move on the rumor and reverse on the fact as they tend to do in general.
- The above is based on the information available today, and it might change in the following days/weeks.
You will find my general overview of the outlook for gold on the chart below:
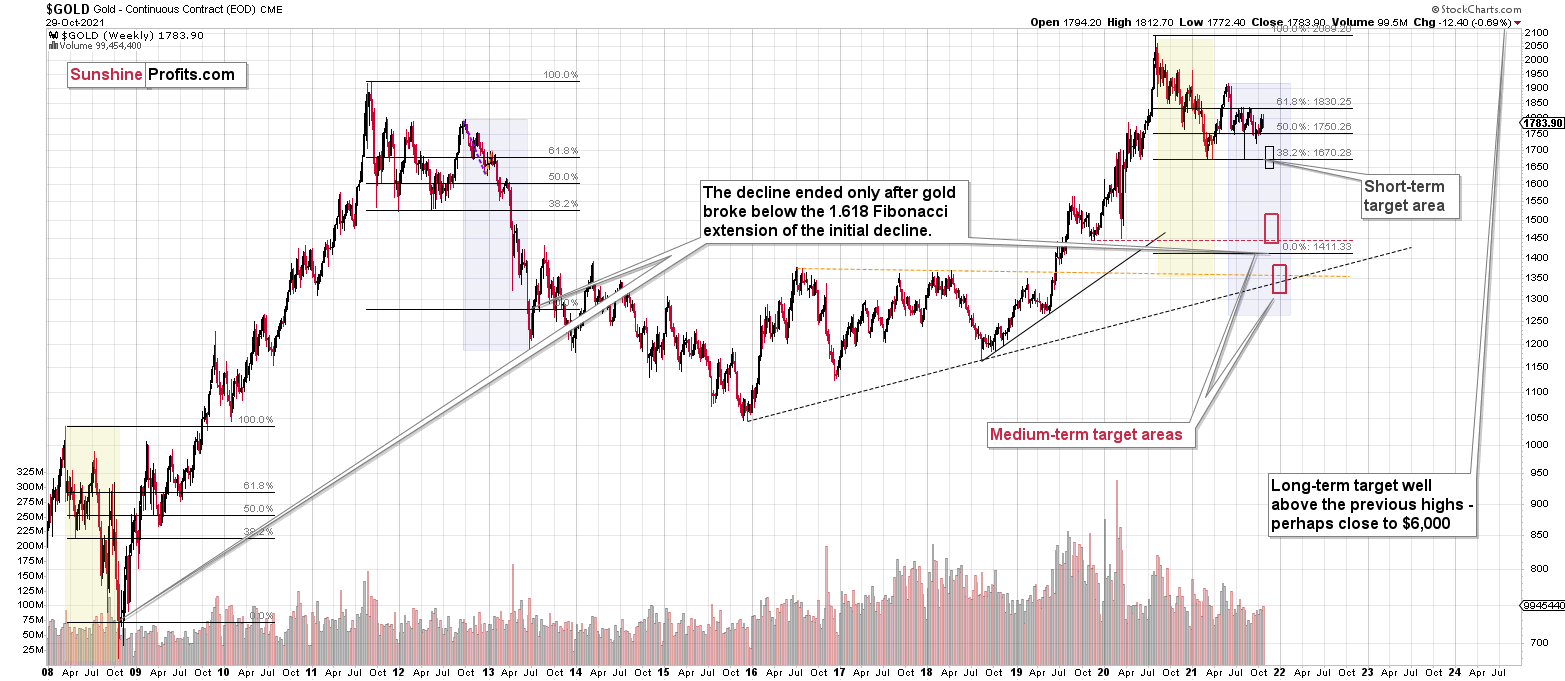
Please note that the above timing details are relatively broad and “for general overview only” – so that you know more or less what I think and how volatile I think the moves are likely to be – on an approximate basis. These time targets are not binding or clear enough for me to think that they should be used for purchasing options, warrants or similar instruments.
Letters to the Editor
Q: PR, Could you provide some detail on the equity markets (stock market)? It is very hard to understand the continuation of equity market rallies. The equity market will indeed affect the price of gold. I never thought this market would continue to this degree. There are a lot of forces at hand, and a great struggle of opposing forces is in play, the USD being one of them as well as global interest rates. When does the mania end?
A: If this is the final part of the upswing – and I think it is – then it is indeed difficult to understand the stock market rallies, and for a good reason. Markets are emotional in the short-run (not really logical), but the final stages of big upswings are the peak of this emotionality. Consequently, there might be no clearer explanation than just the fact that the markets tend to really get ahead of themselves at the tops and we’re seeing this play out right now in the stock market.
When will this end? It’s difficult to tell – that’s why I prefer to have a position in mining stocks that is likely to bring profits even if stocks continue their irrational rally, but it will benefit greatly if the irrational rally ends. The end of tapering or some hawkish surprises from the Fed might be the thing that triggers the declines.
Summary
To summarize, the outlook for the precious metals sector remains extremely bearish for the next few months. Since it seems that the PMs are starting another short-term move lower more than it seems that they are continuing their bigger decline, I think that junior miners would be likely to (at least initially) decline more than silver.
From the medium-term point of view, the key two long-term factors remain the analogy to 2013 in gold and the broad head and shoulders pattern in the HUI Index. They both suggest much lower prices ahead.
It seems that our profits from the short positions are going to become truly epic in the following months.
After the sell-off (that takes gold to about $1,350 - $1,500), I expect the precious metals to rally significantly. The final part of the decline might take as little as 1-5 weeks, so it's important to stay alert to any changes.
Most importantly, please stay healthy and safe. We made a lot of money last March and this March, and it seems that we’re about to make much more on the upcoming decline, but you have to be healthy to enjoy the results.
As always, we'll keep you - our subscribers - informed.
By the way, we’re currently providing you with the possibility to extend your subscription by a year, two years, or even three years with a special 20% discount. This discount can be applied right away, without the need to wait for your next renewal – if you choose to secure your premium access and complete the payment upfront. The boring time in the PMs is definitely over, and the time to pay close attention to the market is here. Naturally, it’s your capital, and the choice is up to you, but it seems that it might be a good idea to secure more premium access now while saving 20% at the same time. Our support team will be happy to assist you in the above-described upgrade at preferential terms – if you’d like to proceed, please contact us.
To summarize:
Trading capital (supplementary part of the portfolio; our opinion): Full speculative short positions (300% of the full position) in junior mining stocks are justified from the risk to reward point of view with the following binding exit profit-take price levels:
Mining stocks (price levels for the GDXJ ETF): binding profit-take exit price: $35.73; stop-loss: none (the volatility is too big to justify a stop-loss order in case of this particular trade)
Alternatively, if one seeks leverage, we’re providing the binding profit-take levels for the JDST (2x leveraged) and GDXD (3x leveraged – which is not suggested for most traders/investors due to the significant leverage). The binding profit-take level for the JDST: $16.18; stop-loss for the JDST: none (the volatility is too big to justify a SL order in case of this particular trade); binding profit-take level for the GDXD: $32.08; stop-loss for the GDXD: none (the volatility is too big to justify a SL order in case of this particular trade).
For-your-information targets (our opinion; we continue to think that mining stocks are the preferred way of taking advantage of the upcoming price move, but if for whatever reason one wants / has to use silver or gold for this trade, we are providing the details anyway.):
Silver futures downside profit-take exit price: $19.12
SLV profit-take exit price: $17.72
ZSL profit-take exit price: $41.38
Gold futures downside profit-take exit price: $1,683
HGD.TO – alternative (Canadian) inverse 2x leveraged gold stocks ETF – the upside profit-take exit price: $12.48
HZD.TO – alternative (Canadian) inverse 2x leveraged silver ETF – the upside profit-take exit price: $30.48
Long-term capital (core part of the portfolio; our opinion): No positions (in other words: cash
Insurance capital (core part of the portfolio; our opinion): Full position
Whether you already subscribed or not, we encourage you to find out how to make the most of our alerts and read our replies to the most common alert-and-gold-trading-related-questions.
Please note that we describe the situation for the day that the alert is posted in the trading section. In other words, if we are writing about a speculative position, it means that it is up-to-date on the day it was posted. We are also featuring the initial target prices to decide whether keeping a position on a given day is in tune with your approach (some moves are too small for medium-term traders, and some might appear too big for day-traders).
Additionally, you might want to read why our stop-loss orders are usually relatively far from the current price.
Please note that a full position doesn't mean using all of the capital for a given trade. You will find details on our thoughts on gold portfolio structuring in the Key Insights section on our website.
As a reminder - "initial target price" means exactly that - an "initial" one. It's not a price level at which we suggest closing positions. If this becomes the case (like it did in the previous trade), we will refer to these levels as levels of exit orders (exactly as we've done previously). Stop-loss levels, however, are naturally not "initial", but something that, in our opinion, might be entered as an order.
Since it is impossible to synchronize target prices and stop-loss levels for all the ETFs and ETNs with the main markets that we provide these levels for (gold, silver and mining stocks - the GDX ETF), the stop-loss levels and target prices for other ETNs and ETF (among other: UGL, GLL, AGQ, ZSL, NUGT, DUST, JNUG, JDST) are provided as supplementary, and not as "final". This means that if a stop-loss or a target level is reached for any of the "additional instruments" (GLL for instance), but not for the "main instrument" (gold in this case), we will view positions in both gold and GLL as still open and the stop-loss for GLL would have to be moved lower. On the other hand, if gold moves to a stop-loss level but GLL doesn't, then we will view both positions (in gold and GLL) as closed. In other words, since it's not possible to be 100% certain that each related instrument moves to a given level when the underlying instrument does, we can't provide levels that would be binding. The levels that we do provide are our best estimate of the levels that will correspond to the levels in the underlying assets, but it will be the underlying assets that one will need to focus on regarding the signs pointing to closing a given position or keeping it open. We might adjust the levels in the "additional instruments" without adjusting the levels in the "main instruments", which will simply mean that we have improved our estimation of these levels, not that we changed our outlook on the markets. We are already working on a tool that would update these levels daily for the most popular ETFs, ETNs and individual mining stocks.
Our preferred ways to invest in and to trade gold along with the reasoning can be found in the how to buy gold section. Furthermore, our preferred ETFs and ETNs can be found in our Gold & Silver ETF Ranking.
As a reminder, Gold & Silver Trading Alerts are posted before or on each trading day (we usually post them before the opening bell, but we don't promise doing that each day). If there's anything urgent, we will send you an additional small alert before posting the main one.
Thank you.
Przemyslaw Radomski, CFA
Founder, Editor-in-chief

