
- Euro & USD Indices
- General Stock Market
- Crude Oil Prices
- Correlation Matrix
- Gold
- Silver
- Platinum
- Mining Stocks
- Sunshine Profits Indicators
- Letters from Subscribers
- How soon could silver reach $77?
- Options pricing - time decay
- Printing money out of thin air
- Miners performance
- Lower initial margins to trade gold futures
- Summary
Last week the German Bundesbank, announced a surprising move to repatriate part of its gold reserves. Some gold analysts see this move by the world’s second largest holder of gold as a signal of growing mistrust among central banks. It is also a crystal clear signal that the central bank views gold as a precious asset, i.e. money, and wants it home in its own vaults in case of an economic catastrophe. Who’s next? Already Holland’s CDA Party has asked that the nation’s 612 tons of gold be repatriated from the U.S., the UK and from Canada. The Dutch are among the top ten holders of gold reserves with 612 tons, the bulk of which is in the U.S. This is all bullish news for gold.
One interesting aspect of the German move is the length of time—7 years-- that it will take to transfer 300 tons from New York back to Frankfurt. The inevitable question that arises is why it should take the Fed such a long time to deliver 300 tons when it holds 6,700 tons in its vaults (see: Gold in Fort Knox article), most of which is owned by foreign governments. We don’t have an answer to this question. It will be interesting to see what will happen if other countries ask to repatriate their gold.
Also this week, the president of the Bundesbank warned of the possibility of an impending currency war due to government interference in the independence of central banks around the world. This could also be bullish for gold. Will gold soar if dollar collapses as the governments seem to fear? Of course.
It is already possible to observe alarming infringements, for example inHungaryor inJapan, where the new government is massively involving itself in the affairs of the central bank, is emphatically demanding an even more aggressive monetary policy and is threatening an end to central bank autonomy, said Jens Weidmann in a speech in Frankfurt. Whether intended or not, one consequence could be the increased politicization of the exchange rate,” he said. “Until now the international monetary system got through the crisis without competitive devaluations and I hope very much it stays that way.
Germany is keeping part of its gold abroad with a split between London (13%) and New York (37%) both liquid markets for wholesale bullion. It’s pulling its gold completely out of Paris. In other words, if the proverbial stuff hits the fan, Germany wants to be able to sell its gold quickly. It would take the direst of circumstances to induce Germany to part with its shiny yellow metal. Germany, which has the world’s second largest reserves after the U.S., has made it clear that it has no intentions to sell its gold (to be honest, we doubt that they would indicate it anyway, because that would drive prices lower ahead of the sale – the Bank of England made this huge and costly mistake more than 10 years ago and we think that it won’t happen again soon). Even when prices were low more than a decade ago and other central banks were selling, Germany held on.
We see a continuing pattern of central banks in the U.S., Japan, and Europe creating trillions out of thin air (see today’s Letters section for explanation) to stimulate their economies. Last year China joined the others with an announced $156 billion stimulus package. This week the Bank of Japan announced that it would implement an open-ended, monthly purchasing program of about $11.28 billion of treasury bills and Japanese government bonds to begin in January 2014. This too is bullish for gold although this information may have already been discounted in the price of gold this week. As an exporting nation, Japan needs a weak yen to make its products competitive.
In other news impacting gold this week, India hiked import tax on gold by 2 percent to 6 percent effective immediately in an attempt to wean the people of India from their love of gold. The government hopes to curb gold purchases and rein in a growing fiscal deficit. It is unlikely that the hike will affect India's passion for gold. Government officials are alarmed by the mounting budget deficit, driven by large-scale gold imports, all that hard currency going out of the country to bring in more of that shiny stuff. Indians can still remember the 1991 balance of payments crisis, when the Reserve Bank of India had to ship 47 tons of gold to Europe as collateral for a loan to avert a painful sovereign default.
India vies with China as top global consumer of gold, and with nearly all demand covered by imports, the country's purchases are a major factor in global prices.
We sometimes like to bring you quirky little stories from around the world that have to do with gold. Here’s one from Down Under. Some people hit it big in Las Vegas, others win the lottery, but an Australian man made an extraordinary discovery this week when he found a 12-pound (5.5-kilogram) gold nugget, worth $300,000. The prospector found it in a place where hundreds had searched before and under only 23 inches of dirt. The nugget was found in a field near the city of Ballarat, site of a gold rush in the last century.
This week we also had President Barack Obama’s inauguration. His first term in office, was challenging, to say the least. There were revolutions in the Middle East, ongoing wars in Afghanistan and Iraq, an economy that was like a patient hooked up to life support and gasping for breath, destructive forces of nature that lashed out on U.S. coastlines and a crazy person who murdered children in a small town school.
We don’t pretend to know what the next four years will bring (higher gold and silver prices are extremely likely, though) but we can, however, look to see what will happen with precious metals in the coming few weeks. Let's begin with an analysis of the US Dollar Index (charts courtesy of http://stockcharts.com.)
USD & Euro Indices
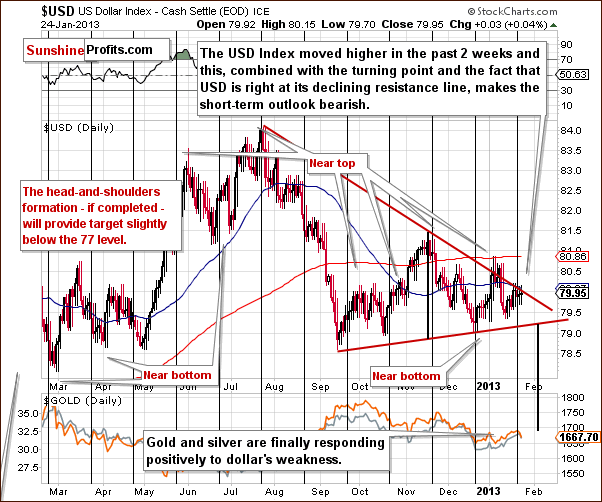
We begin the currency section with the short-term USD Index chart since this chart is the biggest factor this week and determines most of what will be said in this Premium Update. The index is now at its declining resistance line and cyclical turning point. With the previous short term move to the upside, there is a bearish combination in place and index values are likely to reverse right now since the resistance line has been reached. This means that declines are likely to be seen in the days ahead or at least very soon.
In Thursday’s Market Alert, we discussed how at the beginning of the year, when the index failed to breakout above the declining resistance line, it triggered a rally in gold prices:
At the beginning of the year, the USD Index moved to the declining resistance line - breaking it temporarily. The breakdown was then invalidated, which caused gold and silver to soar. The USD Index is once again at this resistance line and metals and miners once again declined. The difference is, however, that the dollar index is now lower and metals are higher. Miners are more or less at the same level.
Are metals likely to rally once again, just like it was the case after Jan 4? Yes - the USD Index will likely decline shortly and take the precious metals market higher.

In this week’s medium-term USD Index chart, the bearish short-term picture could easily turn into a bearish medium-term outlook if the head-and-shoulders pattern is completed here. A breakdown below the 79 level would accomplish this.
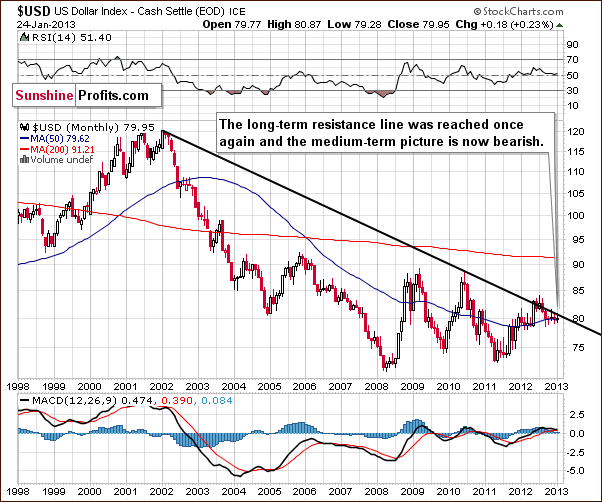
In this week’s very long-term USD Index chart, we see that the USD Index is also at its very long-term resistance line. This chart shows that we could very well see a bigger decline if the index level does move below 79 and a move as low as 74 would not be all that surprising. Such a move would be very much in tune with this very long-term chart.
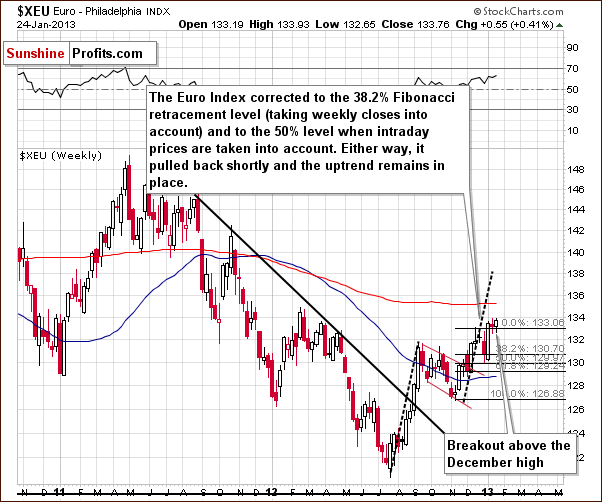
We now look at the long-term Euro Index chart. Here we would expect a bullish situation based on what we saw in the USD Index, and this is precisely what we have. The Euro Index consolidated above its December high and will likely close the week above it which will make three consecutive weeks of doing so. The breakout will then be confirmed and higher Euro Index values will likely follow.
Summing up, the short and medium and long-term outlooks are bearish for the USD Index. The implications for the precious metals sector are bullish and will likely lead to higher prices for quite some time.
General Stock Market
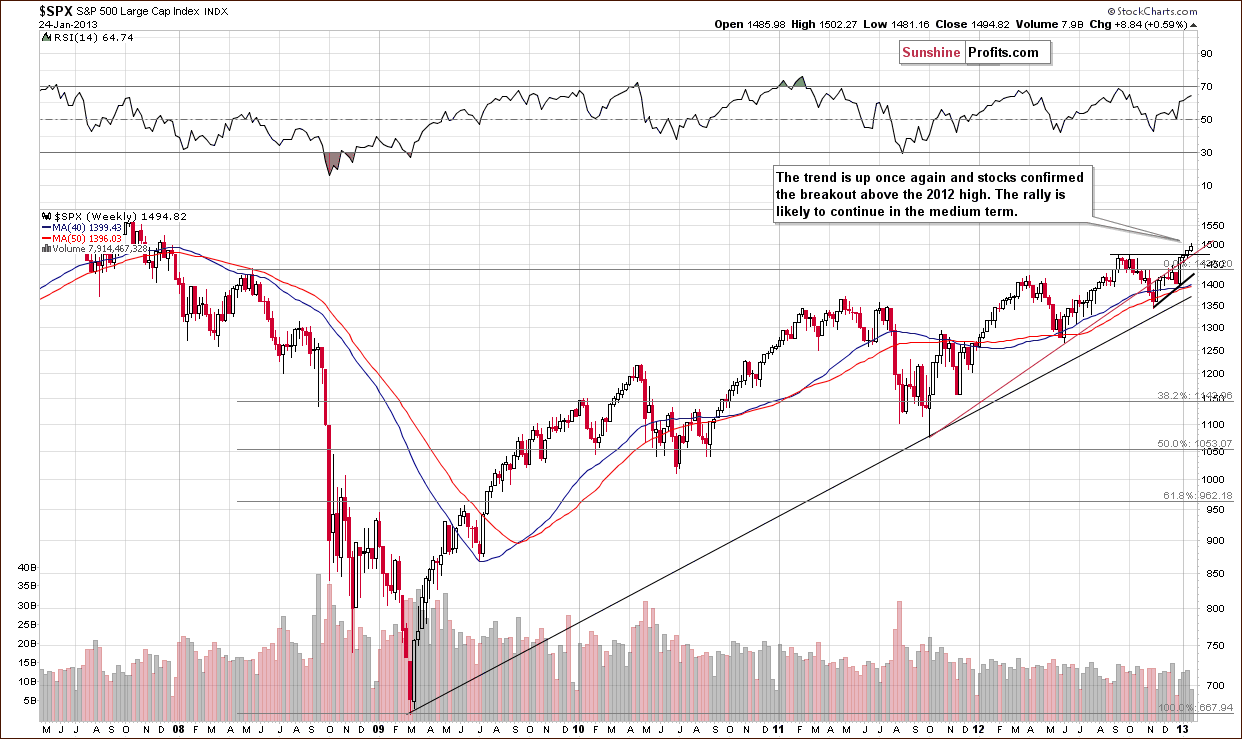
In the long-term S&P 500 Index chart this week, prices are now significantly above the 2012 highs so the breakout is now confirmed. Ideally, we would like to see one more week close above this high, but it still seems that higher stock prices will follow in the coming months anyway based on today’s analysis.
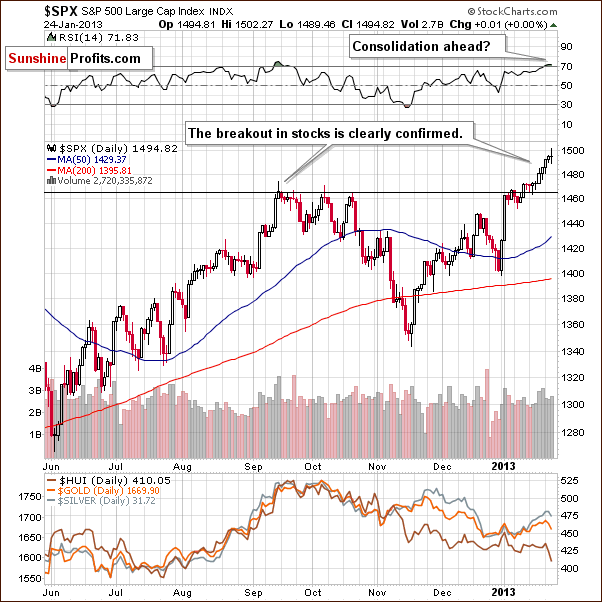
In the short-term S&P 500 Index chart, the RSI level this week suggests an overbought situation. A consolidation of a week or so is therefore not out of the question. The downside appears to be limited, and it seems unlikely that prices will fall below the 2012 highs. It’s likely that stocks will decline only slightly and then continue their rally.
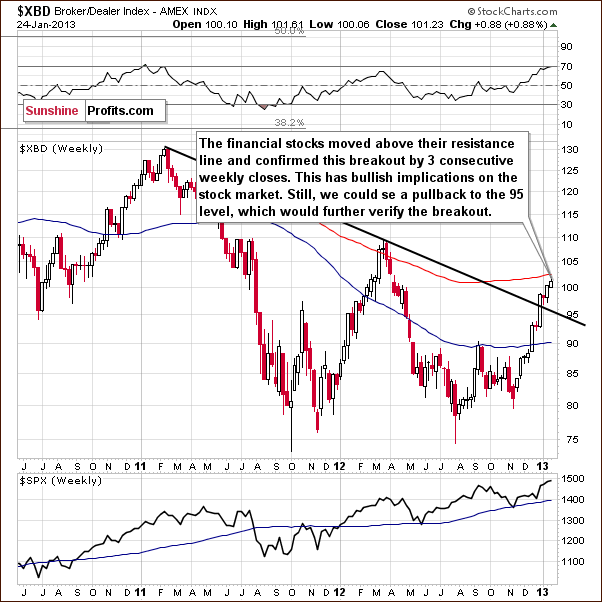
In the financial sector (Broker/Dealer Index serves as a proxy here) chart, we see that prices could correct to the 95 level which would verify the breakout. This would also confirm the bullish medium-term picture for the sector. Consequently, a small decline here would not be bearish at all.
Summing up, the medium-term outlook for stocks is quite favorable although some short-term consolidation is possible. Any large declines in stock prices seem unlikely. However, correlations are somewhat mixed up at this time so the true implications are a bit unclear and will be discussed further in the Correlations section.
Crude Oil Prices
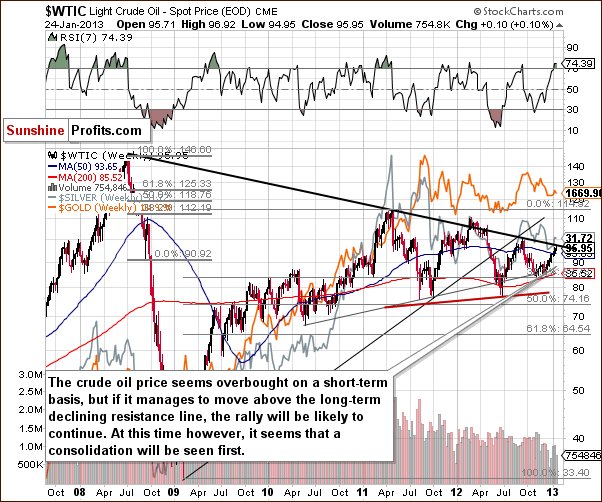
In looking at crude oil prices, a chart which we have not included for some time since the market hasn’t done very much; prices are now at the long-term resistance line. Another attempt to break out is possible, and such an attempt could be successful this time since crude oil prices have been consolidating for about two years now. This is enough time to cool the situation and make higher prices more likely.
RSI levels are significantly overbought on a short-term basis and in 2012 this meant lower prices in the following weeks for gold. This is somewhat of a concern to us, but is not a clear sell signal for crude oil nor for the precious metals sector, as this signal was not really effective prior to 2012. So it seems at this time that either a correction could be seen here, or some consolidation could take place after a breakout. Overall, this chart does give us some concerns but is not conclusively bearish.
Gold & Silver Correlations
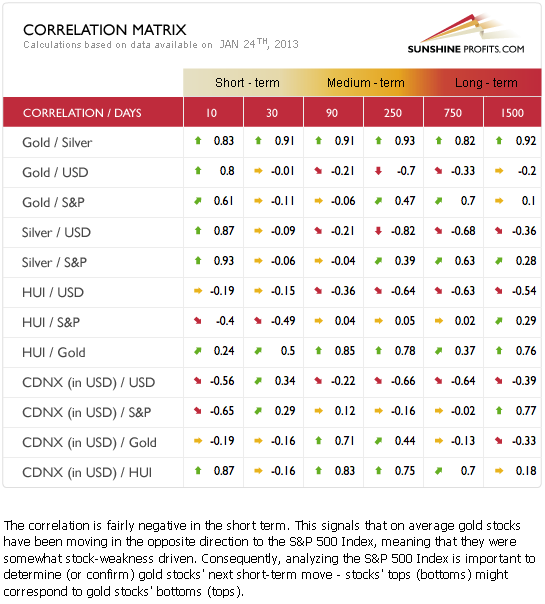
The Correlation Matrix is a tool which we have developed to analyze the impact of the currency markets and the general stock market upon the precious metals sector. This week we see some very specific strange values. The most interesting is the correlation between the mining stocks and the general stock market, which is negative for the past 30 days. What this means is that higher stock prices have coincided with lower mining stock prices on average. A consolidation in the general stock market therefore could contribute to higher mining stock prices. At this time, the implications for the precious metals are a bit unclear from the general stock market, but with more significant medium-term coefficient values, the situation in the USD Index (bearish) has bullish implications for the metals.
Gold
Just like it was the case with the USD section, let’s take a look at the more relevant chart first.
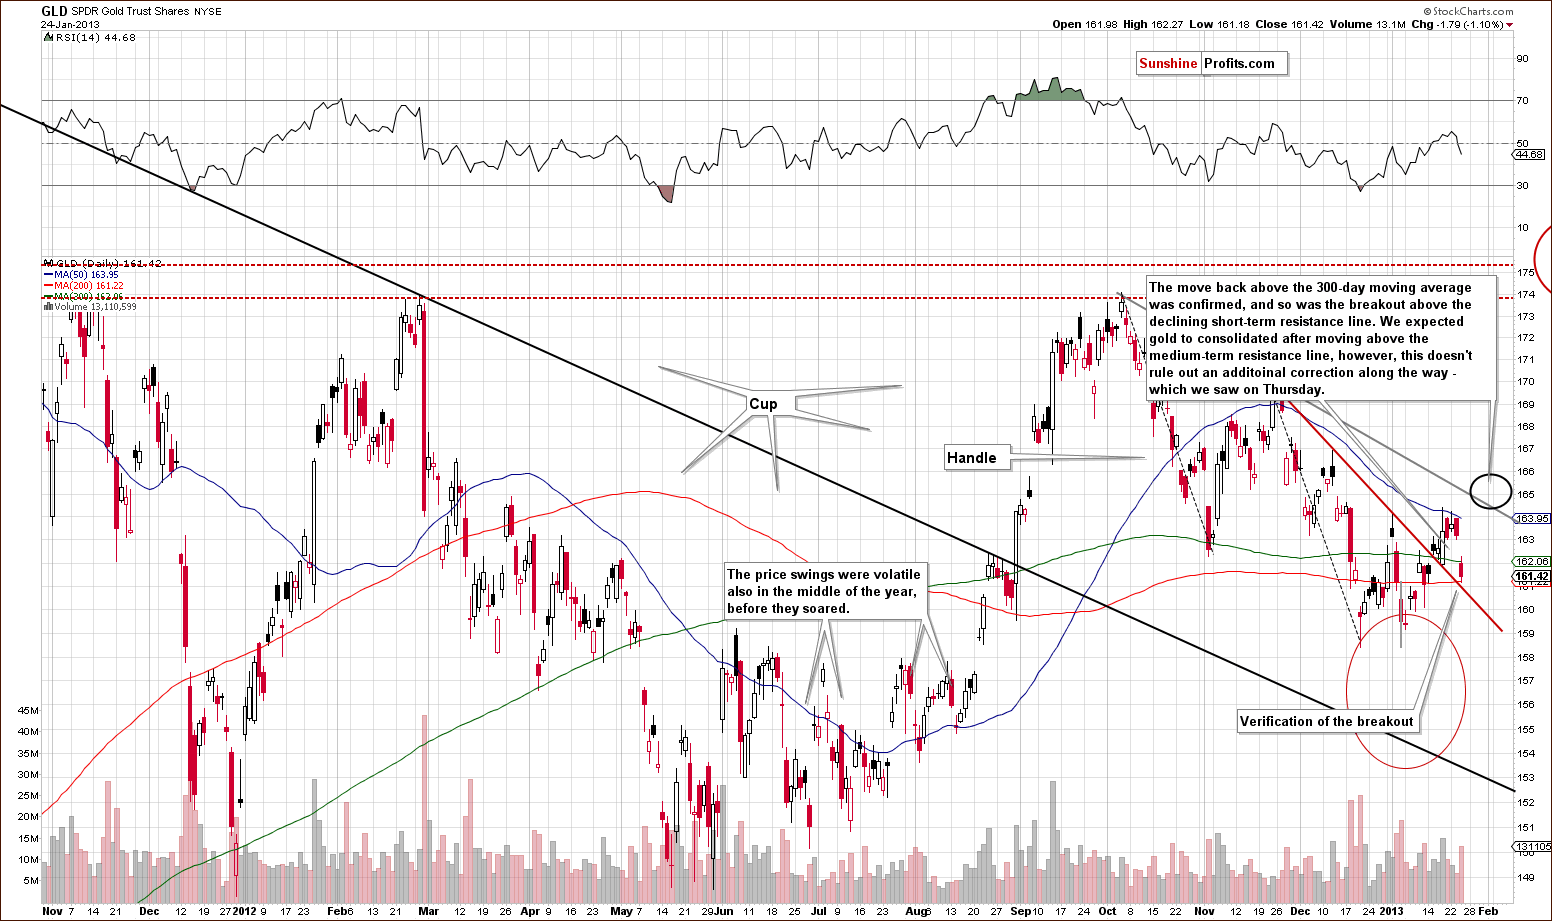
In the medium-term GLD ETF chart, we see that prices declined on Thursday, but this actually verified the previous short-term breakout. So no change is seen to the bullish situation here for the gold market. The recent price action seems to be simply a consolidation and there are no signs which suggest that bigger declines will be seen. We continue to expect higher gold prices for the short, medium and long term. There will probably be a bit of consolidation when prices move above the medium-term resistance line to a target area illustrated by the black ellipse in the chart. Prices would likely then rally once again after consolidating.
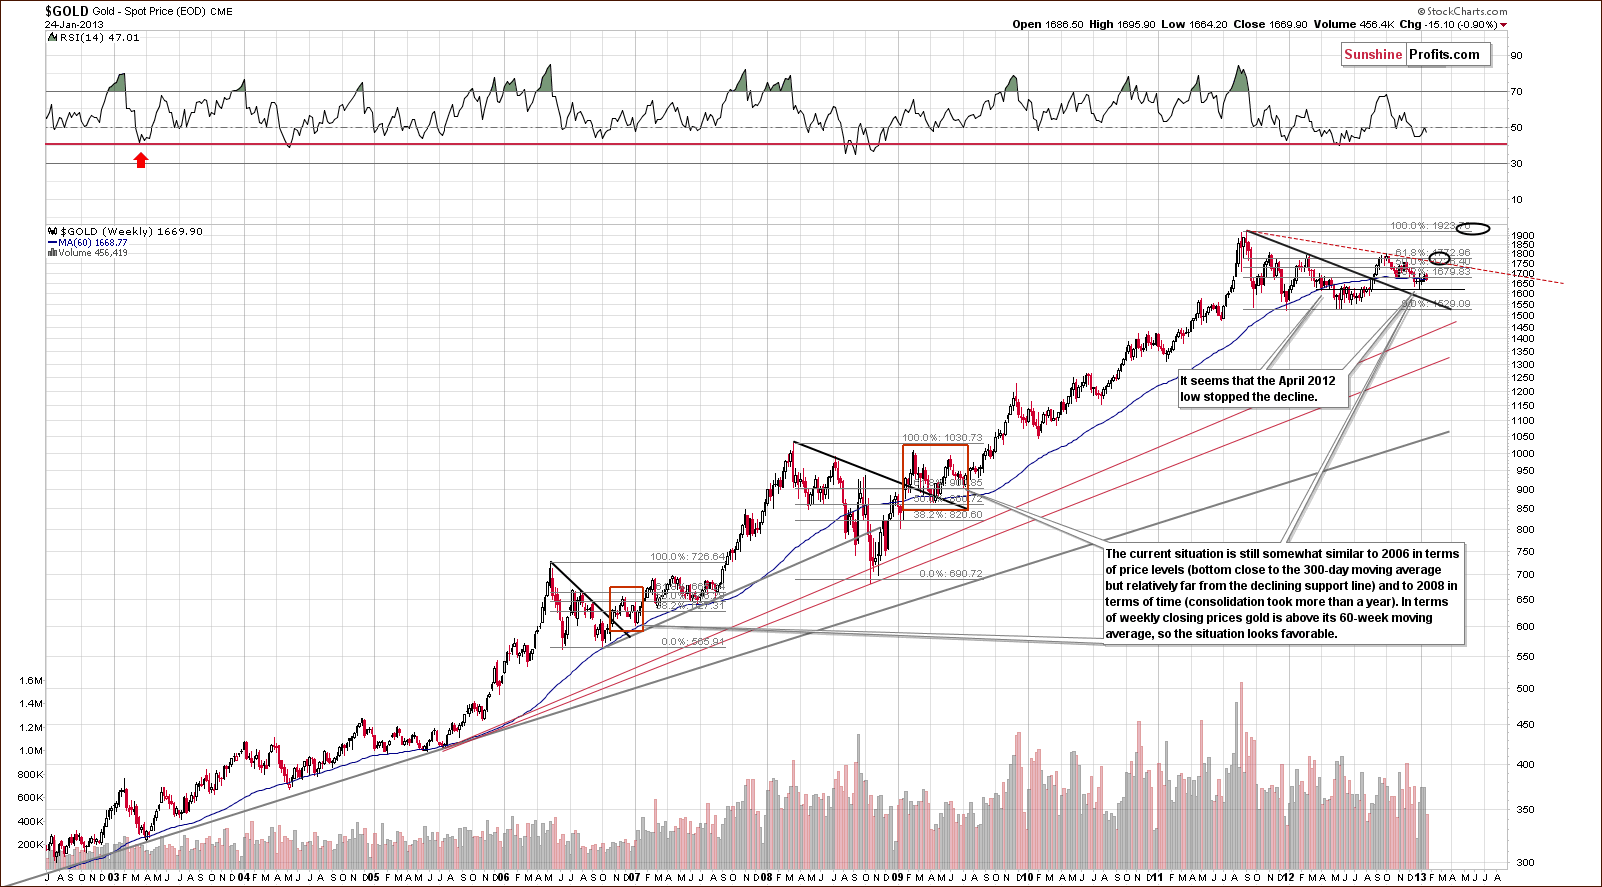
This week’s very long-term gold chart has no real changes. If you look at previous times when gold bottomed close or slightly below the 300-day moving average, you will see that the post-bottom rally was accompanied by small, local declines as well. Consequently, what we’re looking at today remains in tune with the previous bullish patterns. The major fact is that gold pulled back after moving temporarily below the 300-day MA. The medium-term picture remains bullish.
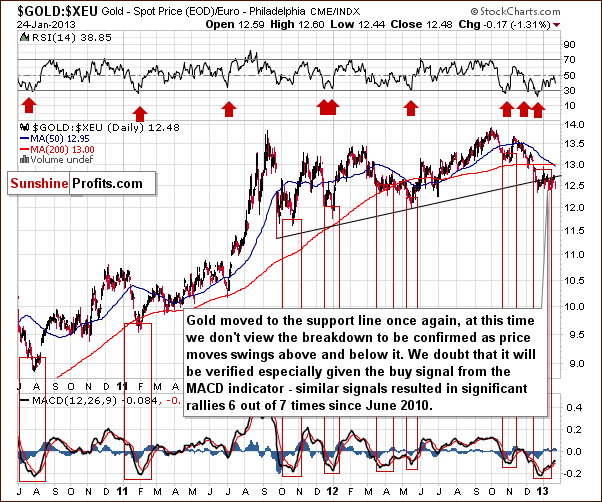
In the chart of gold from the perspective of the euro, we see gold prices moving lower but within the trading range of the past few weeks. In recent days, moves above and below the rising support line have been seen, but no breakdown seems to be in, especially in light of the breakout above the 2012 high from the Japanese yen perspective.
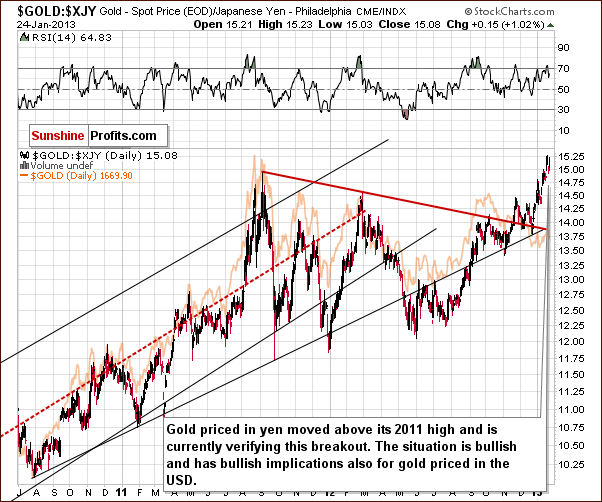
In this week’s chart of gold from the Japanese yen perspective, gold consolidated above previous highs and prices seem ready to continue their rally here.
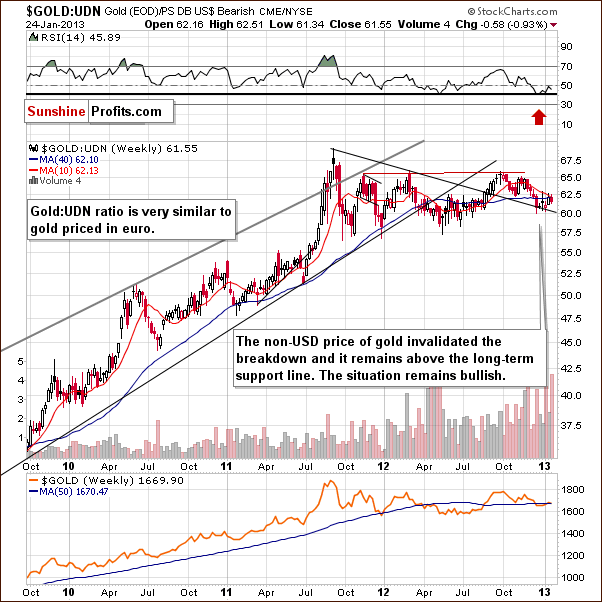
In this week’s chart of gold from the non-USD perspective, we see that prices on average performed well. They bottomed at the declining support line thus verifying the breakout and perhaps ending the lengthy consolidation period. After that, they moved higher and this week they appear to be simply taking a breather.
Summing up, even though Thursday’s prices declined, it seems to be simply a correction and not the beginning of a period of declining gold prices. No meaningful clues with bearish implications are seen especially given the positive impact of the USD Index.
Silver

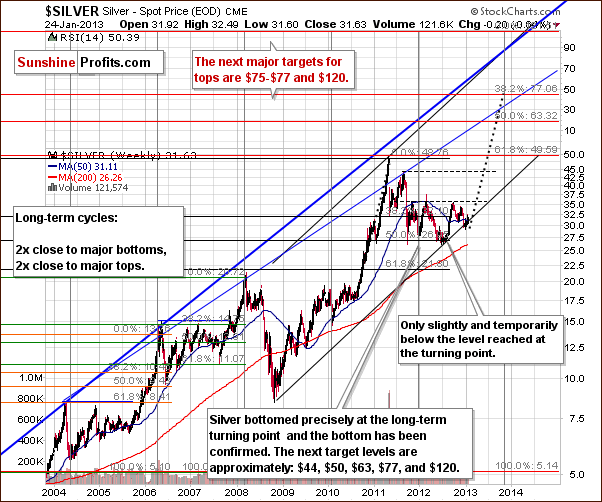
We begin our silver section with a look at the white metal’s very long-term chart. This week’s chart still shows that what we see today is similar to what was seen in early 2010 and the implications remain bullish. An attempt to move above the 10-week moving average was made this week but silver moved back below it. Just a small move higher on Friday will see the week close above this important resistance line and, in our view, further confirm the bullish picture for the medium term.
We include a second very long-term silver chart this week but there are no changes here. We feature it because it will be referenced later in our “Letters” section. Here’s what we wrote about the above chart last week:
We include a second very long-term silver chart this week because if this is the final bottom (the long-term support line suggests so) and if after a prolonged consolidation, we get a rally similar to 2010-2011, we could be looking at a rally to the $77 level. This may not happen, but several technical tools align and such a move is not out of the question. Now, there could be a breakdown, weakness or consolidation and the indications do not say the rally is very likely to happen, but such a rally would not be out of tune with historical patterns. In other words, it would appear quite normal. This is a very early heads-up and something to keep in mind, the next time you hear that silver can’t move so high – it can and it can do it quickly.
Those new to the market may think this is impossible, but $10 silver was impossible when its price was less than $5 for many years. Now, $10 seems impossible because it’s too low a price. If you are long silver for the long run as we are, this picture should make holding silver easier.
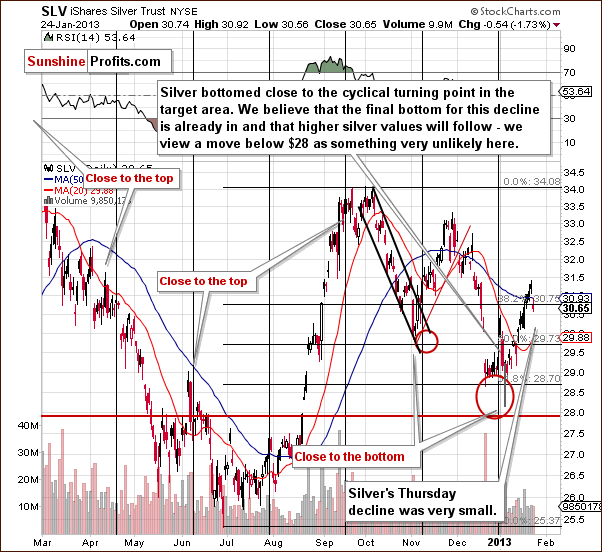
In the short-term SLV ETF chart, we see one important thing worth discussing. Thursday’s decline was very small compared to the size of the recent rally. It was so small, in fact, that it was barely visible and nothing to worry about. Silver has been rallying without a bigger pullback, so a small one at this time is quite natural and not something with bearish implications.
Summing up, the situation for silver is similar to that of gold and remains bullish for the short, medium and long term. Even if additional weakness is seen here, it is unlikely to last more than a few days.
Platinum-Gold
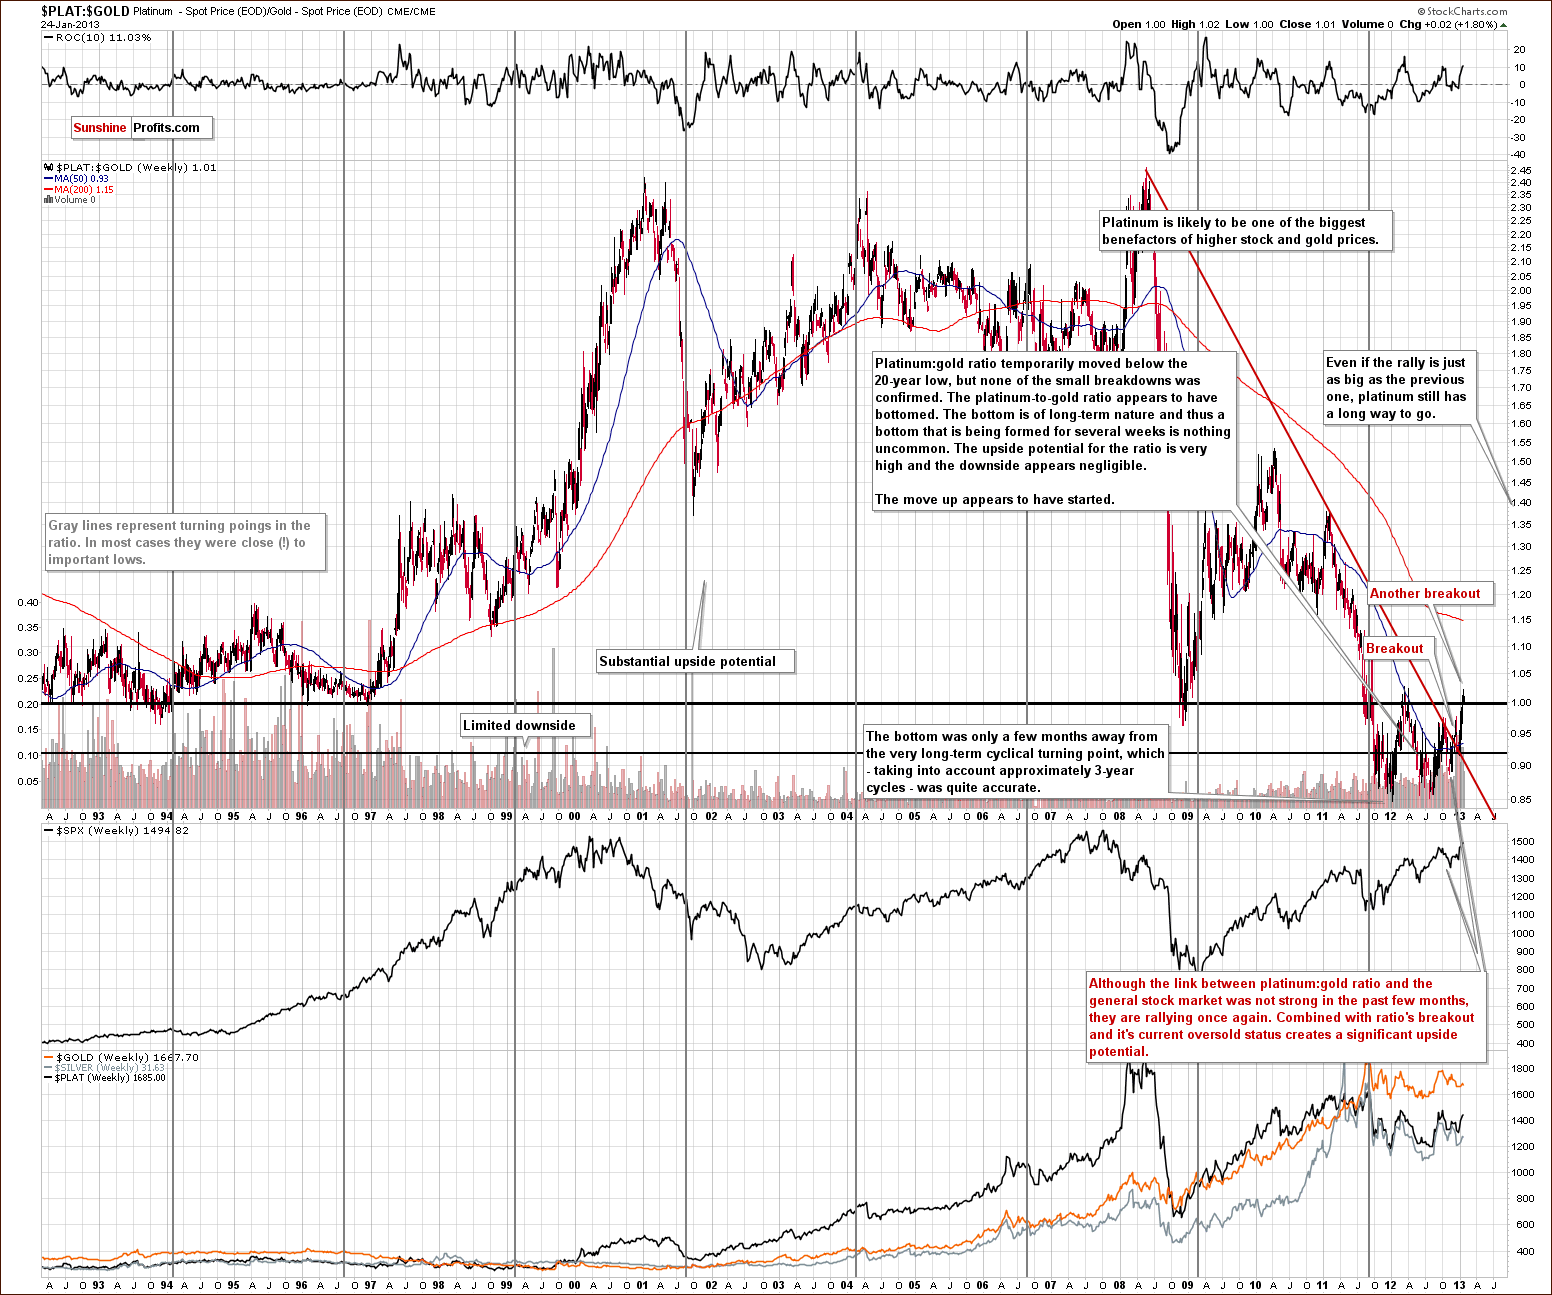
In this week’s platinum to gold ratio chart, there is really no change and we are providing it simply to show that platinum is outperforming gold right now. The ratio is now slightly above 1.0 which means platinum is more expensive than gold. Its price also held well on Thursday despite the weakness in gold and mining stocks. We continue to favor platinum over gold for the medium term and for long-term investment. It is still not too late to enter this market in our view.
Gold & Silver Mining Stocks
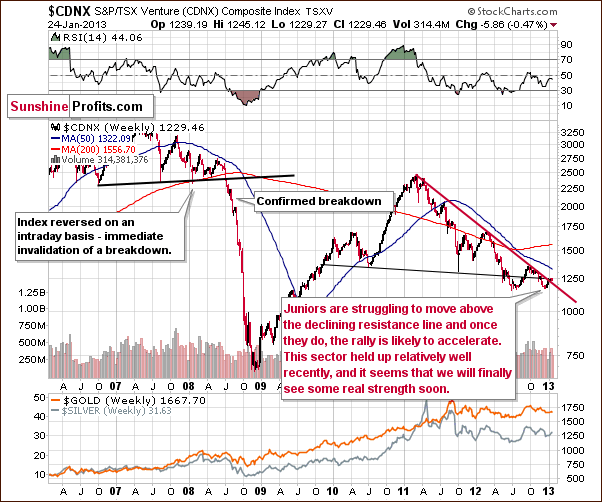
In the Toronto Stock Exchange Venture Index (which is a proxy for the junior miners as so many of them are included in it), we don’t see any changes, but we provide the chart this week to show that the index is on the verge of a breakout. It has been moving back and forth close to the declining resistance line based on several long-term tops. No breakout has been seen yet and the situation has likely been discouraging to investors, who – which is a natural reaction – expect prices to rally soon after putting their money in. The past few months or even years have truly not been encouraging, but it seems that the wait is almost over and that the patience will prove beneficial.
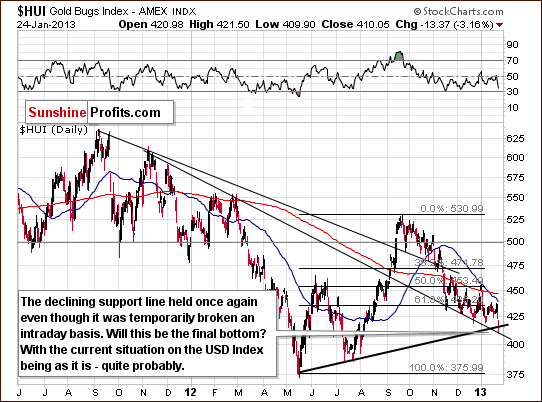
In this week’s HUI Index chart, prices declined on Thursday and moved to the declining support line and the rising one as well. Since the former was not broken, and the move below lower one was not confirmed, higher prices should still be expected here because of the bullish situation in gold and silver, even though it’s hard to be bullish when looking at lower lows.
The situation is particularly exhausting for gold stock bulls. We look at each small rally as possibly the end of declining prices but then, no, prices move lower once again. This has been the case for a couple of months now. The situation is simply not encouraging from a short-term point-of-view. When combining the above with the outlook for gold and with the USD Index picture, it becomes clear that the bullish case will likely prevail here. The timing is unclear, however, and we suggest keeping the faith in the mining stocks based on analysis and not on the short-term emotions that you get when looking at the short-term chart. Patience will likely pay off “big time” in the future.
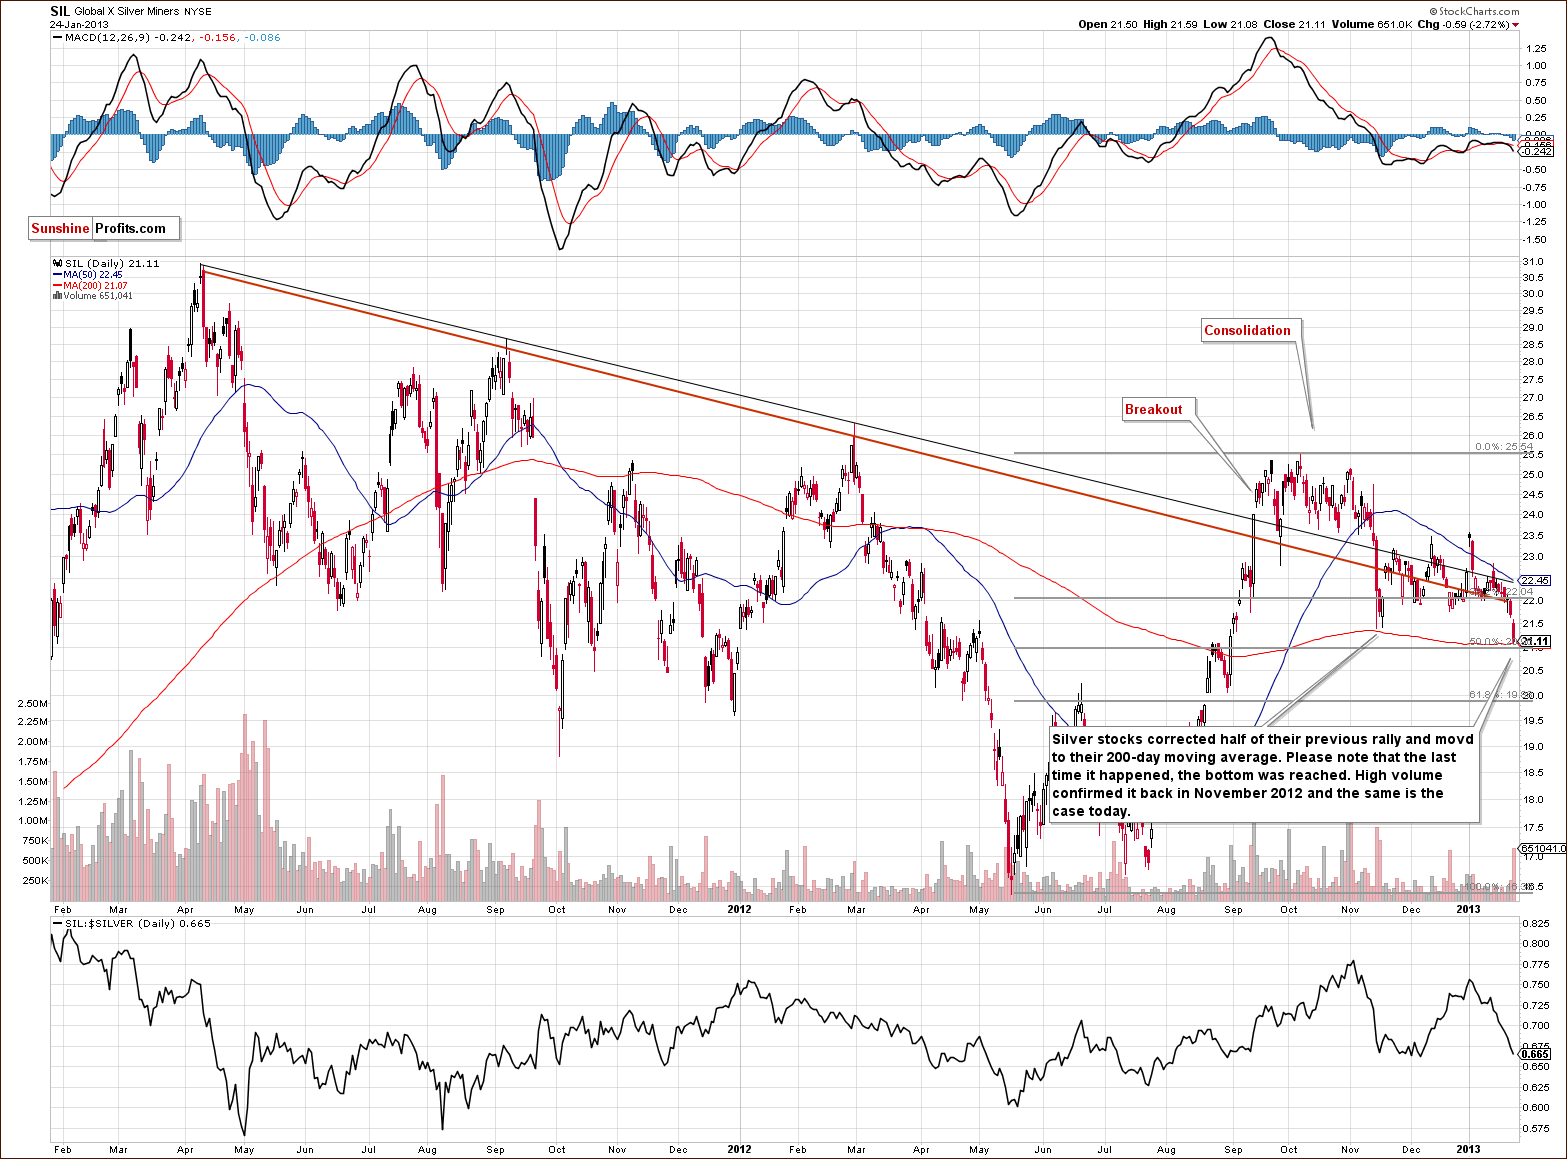
In this week’s silver mining stocks (SIL ETF) chart, we see bigger declines on significant volume and this could signal the end of the current period of declines. The silver mining stocks have been among the strongest parts of the precious metals sector and still are. Strong stocks or sectors decline sharply at the very end of sector declines and this could be the case right now. Strong fundamental sectors hold up well to the very last point, plunge and recover quickly. This could be the case now and the high volume levels make it a good possibility.
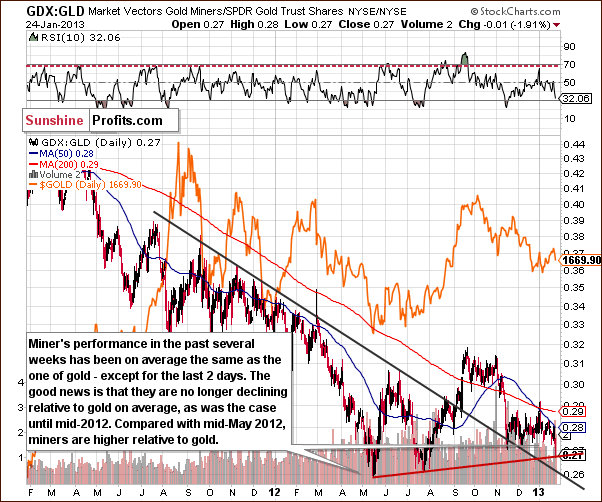
In this week’s miners to gold ratio chart, we see that the ratio hit the support line after declining significantly. The RSI level is close to 30 and has flashed a buy signal on its own. This sometimes indicates a local bottom as in December 2011. The mining stocks have been underperforming recently on a daily and weekly basis but for the past half year or so not so badly. They performed strongly last fall and all-in-all, the situation is not as bad as at first sight. It’s not good, but it’s not extremely bad either.
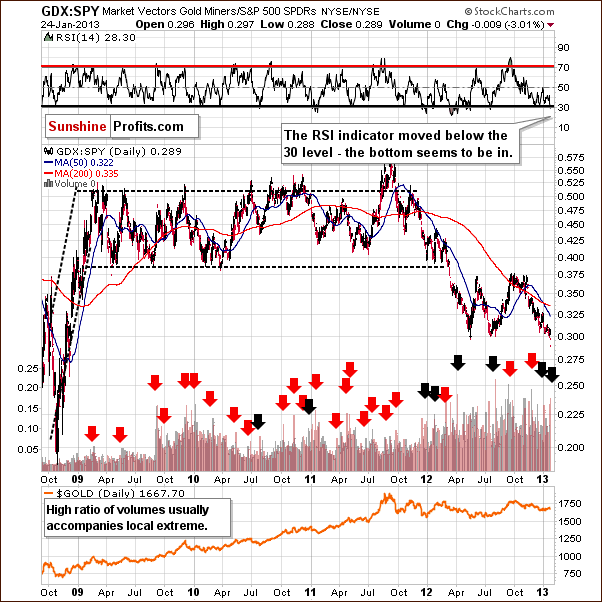
In this week’s miners to other stocks ratio chart, the RSI level flashed a buy signal on Thursday’s decline. In other words, miners underperformed other equities so badly that the situation has become extreme.
We saw a significant decline in the ratio and a high ratio of volumes between the miners and other stocks. It’s possible that a local bottom has been reached and the implications are bullish.
Summing up, the situation is truly not as bad as it appears at first glance especially when combined with the bullish outlook for stocks and the bearish situation in the USD Index.
Sunshine Profits Indicators

Based on Thursday’s closing prices we saw a buy signal in the SP Gold Stock Extreme #2 Indicator. As a reminder, the signal is flashed when the indicator crosses its signal line (dashed, horizontal line). In short (for details see: details and performance page), this is a buy signal for gold, silver and mining stocks without a stop-loss order. There is a time-limit for this signal which is 2 weeks – that is unless another signal prolongs it, which will likely be the case, as the SP Gold Stock Extreme #2 Indicator tends to move back above the signal line shortly after it moves below it.
All in all, this means that we suggest doubling you speculative long position in gold and silver.
Letters from Subscribers
Q: How soon could silver reach $77? Is this several years away, or maybe just one year? Best wishes.
A: Two months ago we replied to a similar question. Back then we wrote the following:
Yes, $75 (or $77) is a very good target and one that could be reached in 2013 (in all likelihood - 80% or so - it will be reached no later than 2014 in our view). There is one more important stop between this level and the 1980 high: $63. We are providing the very long-term silver chart this week to better illustrate.
Even though 2 months have passed, we think the odds are still in favor of a big silver rally and the above is generally up-to-date. Our best guess is that silver will move to the $50 level once again this year, but whether it will manage to move above it or not at next attempt is not so clear. We think it's safe to say there is about a 40% probability for silver moving above the $50 level this year, and a 45% chance of silver moving above the $50 level in 2014. This leaves us with 10% that it will happen at a later date and 5% that it will not happen at all. These are simply our guesstimates based on our analysis and experience; we did not calculate these numbers with a specific formula.
Q: First question: When is the time decay of an option calculated, given that the underlying asset has 0.00 change: in the first seconds when the exchange opens, in the last seconds, other?
Is the time decay constantly calculated throughout the day? How? Given the underlying asset has 0.00 change.
For example: I'd like to buy a call option which expires in 10 days (so time decay is huge) because I know the volatility is also huge and the underlying asset is going to jump much higher. Is it better to buy at the end of previous day (final seconds?), at the beginning of the next day (first seconds), or when the jump is expected?
If you have any other thoughts/suggestions/considerations regarding options pricing please include them in the answer.
Second question:
Could you elaborate a little more about "printing money out of thin air"? Everyone is talking about the Fed buying the t-bonds for money generated from air. I am that strange type of person who likes to know "the guts". I mean you don't want to tell me there is a Bob sitting at the keyboard typing in $1 billion in the "currently available funds" because the Fed wants to buy t-bonds for $1 billion today. So how is the money "generated"? I know maybe it's a naive question but please try to explain.
A: As far as options' time decay is concerned, it's calculated continuously, meaning that there should really be no visible difference between the last second of one trading session and the first second of the next day's trading session, if the price of the underlying asset doesn't change.
In the scenario that you described, it seems better to buy the option slightly earlier, because waiting for the purchase means missing the move in case you are just a little wrong about the time the move starts.
Please keep in mind that we have 3 investment tools dedicated to option trading: Option Calculator (the most convenient option price calculator for traders - for making quick simulations - that we've ever seen; if you have seen anything more convenient, please let us know), Pyramid Optimizer (for choosing options’ strike prices) and the Position Size Calculator (for choosing or diversifying between options’ expiration dates).
---
As far as printing money out of thin air is concerned, this is generally a phrase that summarizes a quite complex process. Generally, this is done through "debt monetization".
We're assuming that you'd prefer a simple down-to-earth explanation, because there are multiple "academic" explanations available out there. Here's how debt monetization works:
The gov't needs money (building roads, paying firemen, providing "free" healthcare, occupying other countries, etc.). When you need money and you don't have it, you can go to a bank to borrow it. You wouldn't be able to borrow it from anyone, because not everyone knows you and trusts you. Governments borrow money too, but since they are so big, they can actually borrow from everyone. Lenders receive bonds in exchange for lending the government their money. Governments can therefore finance everything using bonds. They are not spending money that they have, but rather money that they have borrowed. No money has been created out of thin air yet, because these loans will have to be paid back eventually, right? Wrong. There's actually a joke that we can recall related to this situation that will help to put it into perspective:
- I want a tank.
- Well then, why don't you get one?
- Because they cost several million dollars, not including floor mats. I don't have that kind of money.
- Now wait a second. You're a consumer. You have credit cards, right?
- Yes, but how am I going to pay the credit card company? They'll come after me.
- Don't be silly. You have a tank!
The governments initially borrow money to finance their spending, however, when they can't pay it back, they can either borrow some more or ask their friends in the central bank to help them out. The government asks if the central bank can buy some of their bonds. You could also ask your friends to take over your debt for a price. In this case, you would have to pay exactly the amount you owe for this to make sense for both you and your friend.
However, unlike your friends (unless you have some powerful friends), central banks can simply create money to buy these bonds. They can run the printing press or they can "add" a zero to the amount visible in the banking system. This is what monetary authority means - they can create money. You don't see this money at the time. What happens is that the government no longer has to pay back its bonds, and this is when the money is really created. It was spent earlier, but everyone thought that it would be returned, so they didn't think the money was worth less. However, when it becomes clear that the debt will not be repaid, it also becomes clear that the money that was spent earlier will not be paid back by someone and that the supply of money has actually increased. Consequently, the value of money will decrease.
Again, just like spending and money creation don't have to happen at the same time; inflation doesn't have to emerge instantly. There are multiple tools used by monetary authorities - like managing inflationary expectations - to restrain inflation. After all, if central banks tell everyone that inflation will not increase, and hundreds of experts featured in the mass media confirm that, will most investors discount higher inflation in the coming years? No. Only some of them will and some of those will purchase precious metals to protect themselves. But it will take a lot of time for others to realize this and the process will be complex.
That's why the price doesn't immediately move up after the money supply increases dramatically - because not everyone really realizes the implications. The way investors realize and react to certain things creates a bull market and the shape of that bull market is not based purely on the fundamental picture. In the short term it's based on investors’ and traders’ emotions and perceptions. That's why we take a lot of time and effort to analyze charts and develop tools that will help you in this type of environment - because in the short- and medium-term, there are better means to analyze the market and profit on it than focusing on several fundamental factors.
Of course, central banks should be independent from political parties and governments. Are they? Realistically, we don't think so ("don't be silly, they have lots of tanks").
Q: Back in early November of last year, with gold at 1685 and the Dow at 13,100, GDX was at 50. Compared to today, GDX has to gain $5 just to return to that status, where miners were already beaten down.
With long-term investments, I am now just about where I was in late 2009. If gold returns to the lower 1600's, miners could take years to recover, assuming the bull market is not over. Worse, stocks are pushing historic highs. A correction now, and any decline in gold will decimate miners. And that could come any day. Please comment.
A: Generally, if you look at miners’ performance in another timeframe, they don't look that bad, they look average. A lot happened in 2009, especially in terms of mining stocks and depending on which month you take into account, your portfolio might be up, down or unchanged from 2009 given that you focused on mining stocks.
In general, we're with you regarding how it feels. I think that there are very few people who are happy with their performance - maybe JP Morgan and others shorting the metals. We'll see. The corrections are supposed to make people discouraged. If they have managed to do that, they might just be over. About 30 years ago gold had to correct much more than it has so far before it really rallied. Perhaps this time the time factor was enough to cool everything down. And the fact that we haven't seen a decline similar to the pre-79-80 spike is because the fundamentals (especially the money supply) are much better this time. This would imply that the real high of 1980 will very likely be exceeded. Generally, the more we think about how big the correction is, the more confident we become that the precious metals market is the place to be.
Moreover, if we can suggest something, adding gold, silver, and platinum should prove useful even if miners do outperform metals in the coming months. With the diversification you would gain, you would greatly limit the risk of not participating in the bull market at all if the selected part of the sector lags the rest (like miners have in the previous months).
Q: Effective as of January 3, CME Group lowered initial margins to trade gold futures and iron ore futures contracts.
A: We would like to get back to the topic of margin changes and their impact on gold & silver prices.
It's been some time since we wrote about it, as not much has happened with them. Gold plunged in mid-2011 shortly after an increase in the margin requirement. Silver plunged earlier in 2011, also shortly after an increase in the margin requirement. No wonder - rising margins mean that holding long speculative positions in futures are more expensive because they require more capital as collateral for the position. This means that the short-term bullish case for an asset deteriorates right after the margin hike.
Since margin changes are important for all PM investors and traders to understand and be aware of, we have examined the situation very thoroughly. You can read our report on the margin hikes in gold and silver in the reports section. Basically, the effect is strong in the short-term and practically nonexistent in the long-term, and it's stronger for silver than for gold.
However, what we saw at the beginning of the year was not a margin hike. The margin, meaning the deposit requirement, was lowered for gold. This means that being long gold with futures is now less expensive. Actually, gold has been rallying since that time. We're not saying that it's the only reason for a rally. It's not. The situation is complex and many factors are in play at the same time. However, this tells us that the current rally is sustainable and that the medium-term outlook looks really bright for gold. We expect this to benefit the rest of the precious metals sector as well.
Summary
The most important factor this week is the USD Index situation. It is at the long-term and short-term declining resistance line and also at a cyclical turning point after a short rally. Lower values are implied for the weeks and months ahead, and the implications are bullish for the medium term across the whole precious metals sector.
The outlook for the general stock market is also bullish for the medium term, but a short-term consolidation could be seen too. The impact of stocks on the precious metals may not be strongly bearish because both the short and medium term correlations are rather weak right now. In fact, the correlation between the miners and other stocks is actually negative at this time.
The situation in the mining stocks does not look encouraging for the short term but combined with all other factors in this week’s Premium Update and analyzing it along with the support lines reached in the HUI and SIL makes the situation more bullish than not. We believe that betting on higher gold, silver and mining stock prices is still a good idea with speculative capital and we believe that being long in the precious metals with long-term investment capital is also the right place to be at this time.
Trading – PR: Long position in gold, silver, and mining stocks
Trading – SP Indicators: Long position gold, silver and mining stocks
Long-term investments: Remain in the market with your precious metals holdings
| Portfolio's Part | Position | Stop-loss / Expiry Date |
|---|---|---|
| Trading: Mining stocks | Long | $42.5 GDX (half) / Feb 8, 2013 (half) |
| Trading: Gold | Long | $1,629 (half) / Feb 8, 2013 (half) |
| Trading: Silver | Long | $28.94 (half) / Feb 8, 2013 (half) |
| Long-term investments | Long | - |
This completes this week’s Premium Update. Our next Premium Update is scheduled for February 1, 2013.
As always, we'll keep you updated should our views on the market change. We will continue to send out Market Alerts on a daily basis (except when Premium Updates are posted) at least until the end of February, 2013 and we will send additional Market Alerts whenever appropriate.
Thank you for using the Premium Service. Have a profitable week, a great weekend!
Sincerely,
Przemyslaw Radomski, CFA

