
Before you start reading today’s update, please note that you can do so in the reader-friendly mode that we just introduced after receiving a few requests from you last week. Please click the book icon slightly above this paragraph on the right side of the text (on the right side of the “PREMIUM UPDATE” title). The printing mode has been enhanced as well based on your requests (click the printer icon right next to the above-mentioned book icon).
Gold prices fell more than 1 percent Wednesday pressured by a stronger dollar and weaker stocks markets along with profit-taking. Gold struggled to maintain gains after hitting six and a half month highs this month after the Federal Reserve, the European Central Bank and the Bank of Japan announced steps to loosen monetary policy.
Meanwhile, scenes of large-scale protests against anti-austerity measures in Spain and Greece rekindled fears about the eurozone’s three-year-old debt crisis. Gold and the euro have been moving in tandem for quite a while now (they both arenegatively correlated with the dollar). Gold is still over 4 percent higher for September. The Fed's pledge to buy $40 billion in mortgage-backed securities each month as long as job creation remains sluggish should protect gold from crashing.
But will a serious flare up of the eurozone crisis damage gold’s upward trajectory? The New York Times reported that in Spain, where there is more than 50 per cent unemployment among youths, people are rummaging through garbage cans for food. Spain has been forced to embark on the same path as Greece, introducing one austerity measure after another, cutting jobs, salaries, pensions and benefits.
The gold market was kept afloat early this week by news that South Korea and Paraguay both significantly added gold to their reserves in July, highlighting strong interest in gold in the official sector. Data from the International Monetary Fund showed South Korea raised its holdings of gold by nearly 16 tons in July. The country has doubled its bullion reserves in just one year after being one of the largest purchasers of gold in 2011. The Bank of Korea has indicated that it will continue to bolster its gold holdings going forward.
It is interesting to note the sharp contrast with its impoverished sister to the north, which has very few ways to earn foreign currency. North Korea has sold more than 2 tons of gold over the past year as its economy continues to deteriorate. Cash-strapped North Korea raised roughly $100 million. Its leader, Kim Jong Un, went on a spending spree after his father’s death, erecting a $40 million statue of his father, among other extravagances.
Paraguay also raised its reserves in July from a few thousand ounces to more than 8 tons. So far this year, central banks have added a net 262.1 tons to their reserves, compared with 203.4 tons in the first eight months of 2011. Turkey has added the most to its holdings, having raised its reserves by 100.2 tons in the first eight months of the year, followed by Russia, which has added 53.75 tons.
Mining executives met this week in a MINExpo convention in Las Vegas and the talk was mostly bullish. They heard Newmont CEO Richard O’Brien say that gold is presently trading more like a currency than a commodity. O'Brien told the audience that investment is the largest growing component of the gold market, currently comprising about 40% of demand. As more currencies weaken, such as the U.S. dollar and the Euro, O'Brien suggests the current bull market for gold will continue well into the future.
According to O’Brien, mine production is actually a miniscule part of overall gold supply, accounting for only 2% of above ground stocks, he said, estimating that a grand total of only 2,900 tons of gold will be mined this year compared with 2,818 tons last year.
However, gold supply will eventually be challenged as it becomes more and more difficult to find gold; it now takes an average of 17 years to mine gold from exploration to discovery. There has not been a significant discovery of five million ounces or more in reserves in 10 years.
The numbers tells us that annual global demand is considerably more than the amount of gold extracted from the ground. Demand was about 3,500 tons in 2000 and rose to 4,486 tons by 2011. Simple mathematics shows a deficit. In the past central banks were happy to sell some of their gold holdings and there is even an international treaty limiting the amount that they can sell each year so as not to undercut prices. But in the past few years instead of sellers, central banks have been net buyers.
The cost of exploration expenditure has gone up but the number of major discoveries has been falling. In addition, the average size of major deposit discoveries is declining as well as the average grade of discovered gold. Less gold in the rock makes it more expensive to extract. If it takes an average of 17 years to mine gold from exploration to discovery, the lack of major recent discoveries points to a production shortfall in the next decade with the gap between demand and production yawning wider.
Speaking of mines, Chinese and Venezuelan officials signed an agreement to jointly develop one of the world's largest gold mines. The agreement on Las Cristinas gold mine was signed Friday by Venezuelan government officialsand the state-run China International Trust & Investment Corp.The mine in southern Bolivar state is estimated to hold about 17 million ounces of gold.
Summing up, there are some steps that are made in order to increase the supply of gold, but they will not really come into play (increase the supply substantially) in the near future. With higher demand and unchanged supply, the price should eventually move higher. Will it take place soon? Let's turn to charts and find out. We will start with the USD Index very long-term chart (charts courtesy by .http://stockcharts.com)
USD and Euro Indices
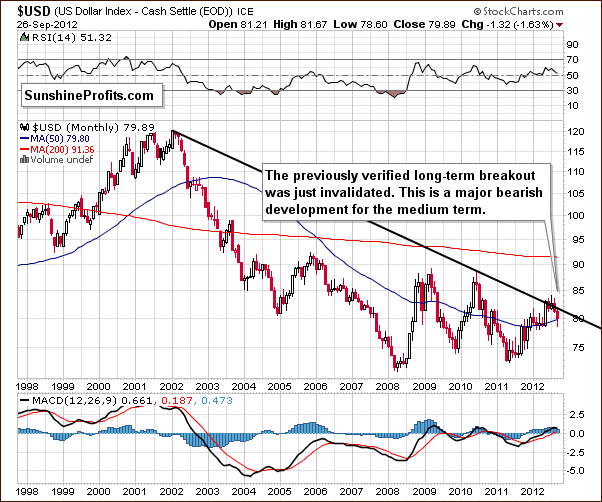
There were no long-term changes this week and the picture remains bearish because of the invalidation of the previous breakout. In last Week’s Premium Update, we stated “we continue to see an invalidation of a major breakout. This is an important bearish phenomenon for the medium term, and the implications for the month ahead are quite bearish.” This still accurately describes the situation in the USD Index at this time.
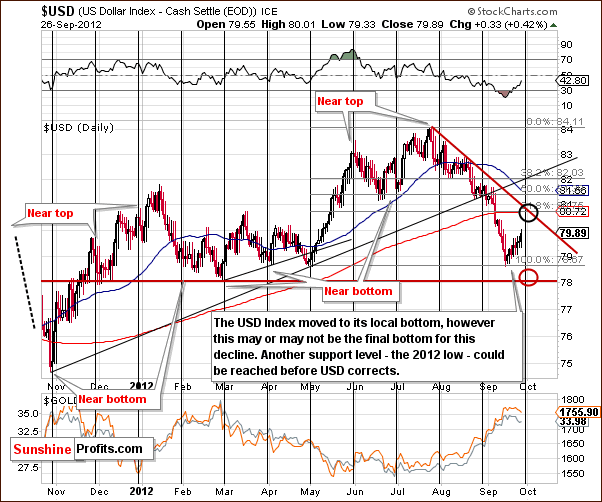
A look at the short-term chart this week shows us that there have been some changes. We have created two price targets: one for a rally and one for a decline. A decline appears slightly more probable since the medium-term trend has been and remains bearish. The downside price target is slightly above the 78 level (78.10).
We will very likely see a reversal here quite soon, as the cyclical turning point is upon us. The question is if it will be a local top or bottom.
If the USD Index moves higher, to the 80.70 level, we will likely see another move lower in the precious metals along with dollar’s rally. Please note, however, that the upside (in USD) is quite limited. When the top in the USD is reached, there will be a good opportunity for traders to go long precious metals.
If a decline is first seen, then we will probably see another rally in the precious metals and perhaps an opportunity to short term precious metals market.
At this time it seems that the odds are a bit higher for a continuation of declines here. In any case, it seems that a favorable entry position for a trade in the precious metals will likely be at hand soon.
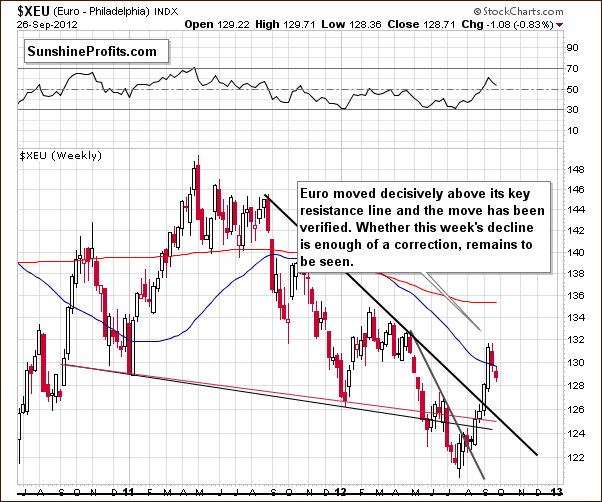
In the long-term Euro Index chart this week, the picture is pretty much unchanged. Some correction has been seen from a medium-term perspective, and it may or may not be enough at this point. Further moves to the downside could continue, but higher prices are also a possibility. Overall, the picture is pretty unclear this week.
Summing up, analysis of the USD Index shows that an opportunity for entering a trade in the precious metals will likely be seen very soon. The question is whether it will be an opportunity to open a short or long position, but this is something which cannot be determined at this time. The odds favor another move lower in the dollar, but since this is based on just continuation of the trend, we don’t view it as a signal that’s reliable enough to open a trade just yet.
General Stock Market
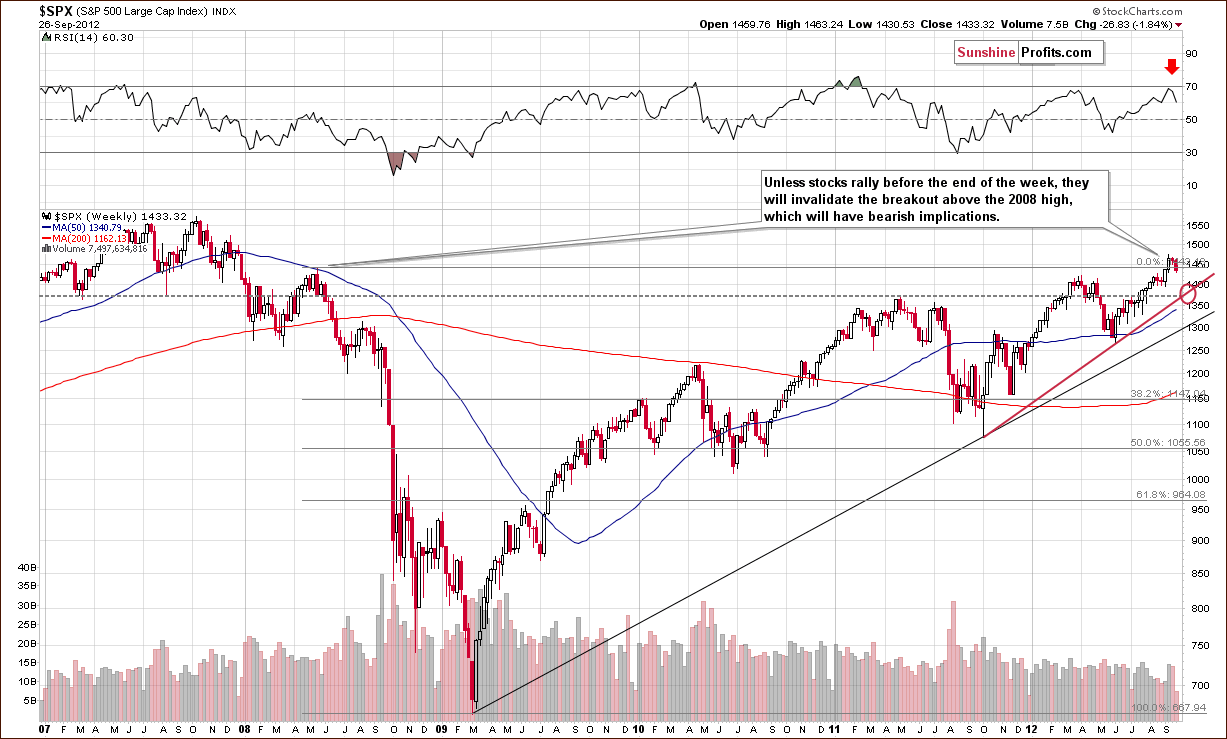
In the long-term S&P 500 Index chart (please note that you can click on this or any other chart to enlarge it), we have an interesting situation this week. We will have an invalidation of the breakout if prices close the week below the level of the 2008 high. So, a couple of possible scenarios appear to be in place: the consolidation period could be over, or much bigger declines could be ahead – no clear call can be made on this chart alone. Consequently, we’ll look at another part of the market for more details.
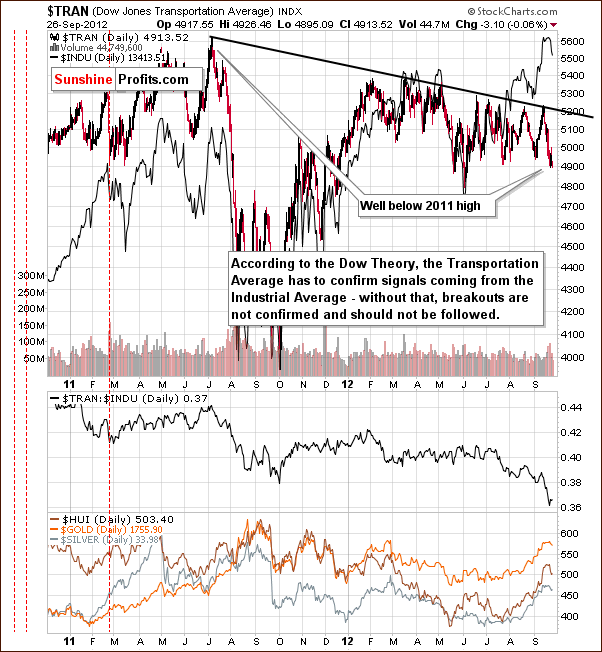
The additional details of the price action in the general stock market come from analysis of the Dow Transportation Average Index. According to the Dow Theory, the transportation stocks have to confirm any breakout or breakdown in the Industrials for the move to be deemed reliable.
So far, no such confirmation has been seen, and while the Dow Jones Industrials are well above last year’s high, the Transportation Average Index is well below that. So, no confirmation has been seen due to the underperformance of the transportation stocks. In short, the situation is unclear and unconfirmed, and the previously seen bullish signals for stocks are less important.
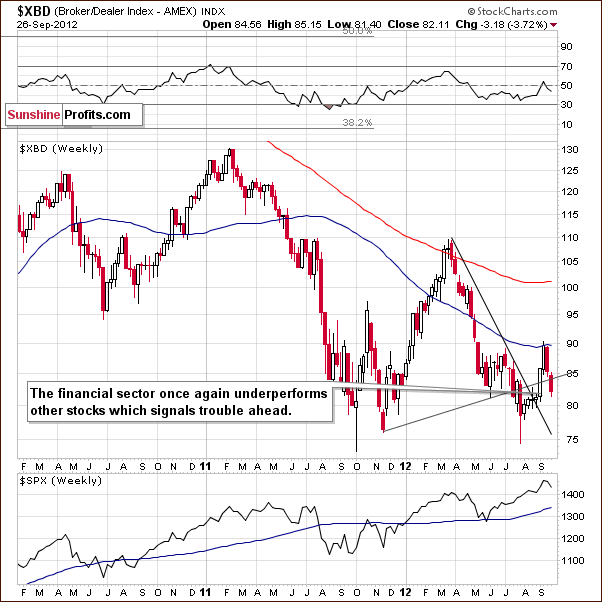
In the Broker Dealer Index chart (a proxy for the financial sector) we see that prices are below the rising support line indicating that the financials have been once again underperforming other stocks. The early September rally has been almost negated and the picture painted here this week is bearish.
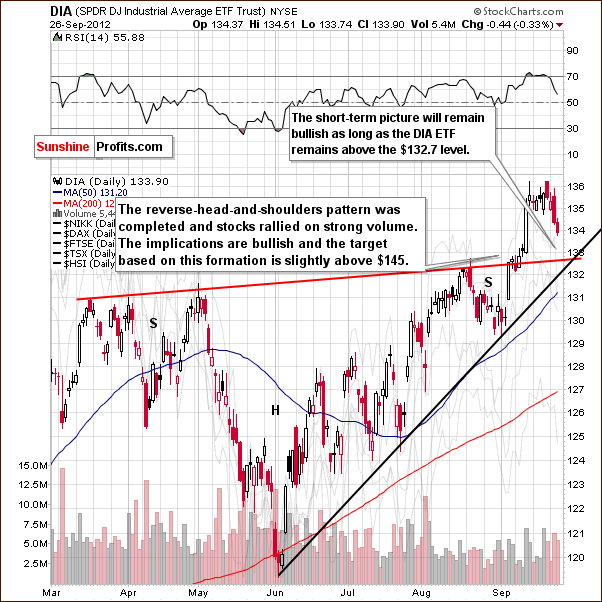
In the short-term DIA (a proxy for the Dow Jones Industrial Average), we see that prices declined this week on relatively significant volume but prices are still above key support lines. If the support is broken and the DIA moves below $132.70, further declines will likely be seen from there.
Summing up, the situation in the general stock market deteriorated this week as we have seen an invalidation of a price breakout on an intra-day basis. The strength of the S&P 500 has not been confirmed by the transportation stocks nor the financials. The short-term DIA suggests that a confirmed move below $132.70 will likely be followed by bigger declines. At this point, it seems that market’s reaction to the open-ended QE3 might have been buy the rumor, sell the fact. The markets might have been waiting for a confirmation to end the rally. At this time the situation in the general stock market is rather unclear, we should know more at the end of the week.
Crude Oil Prices
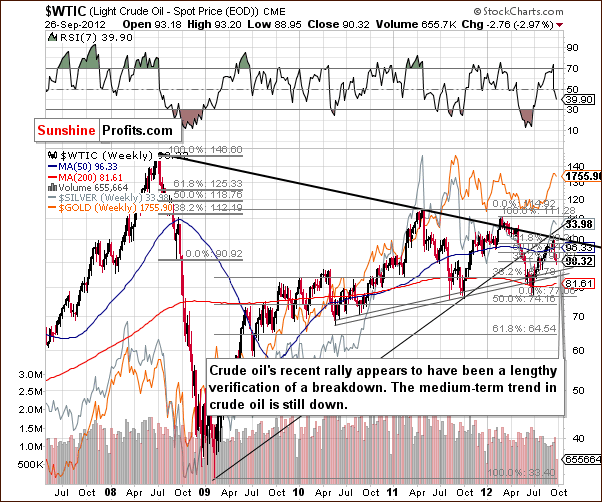
Turning to the crude oil price chart, we have an interesting situation where prices were recently at the intersection of two most important resistance lines. The medium-term situation remains bearish as the previous breakdown has not been invalidated. This is a slight indication that commodities in general may need to correct some more before another rally emerges.
Precious Metals Correlations
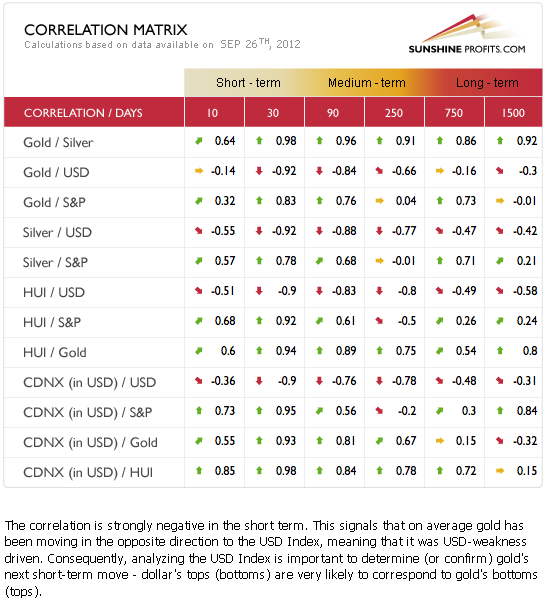
The Correlation Matrix is a tool which we have developed to analyze the impact of the currency markets and the general stock market upon the precious metals sector. The classic coefficients are in place for the medium term. The USD Index action is likely the opposite of what will be seen in the precious metals (negatively correlated) whereas stocks and the metals generally move together.
An interesting development is seen with the USD Index and gold at an almost zero correlation today. For the past few days gold prices have simply not followed all the negative signals from the USD Index – they followed some, but not all of them. This is actually a positive development and makes us reluctant to bet on lower prices in the short run right now.
Gold
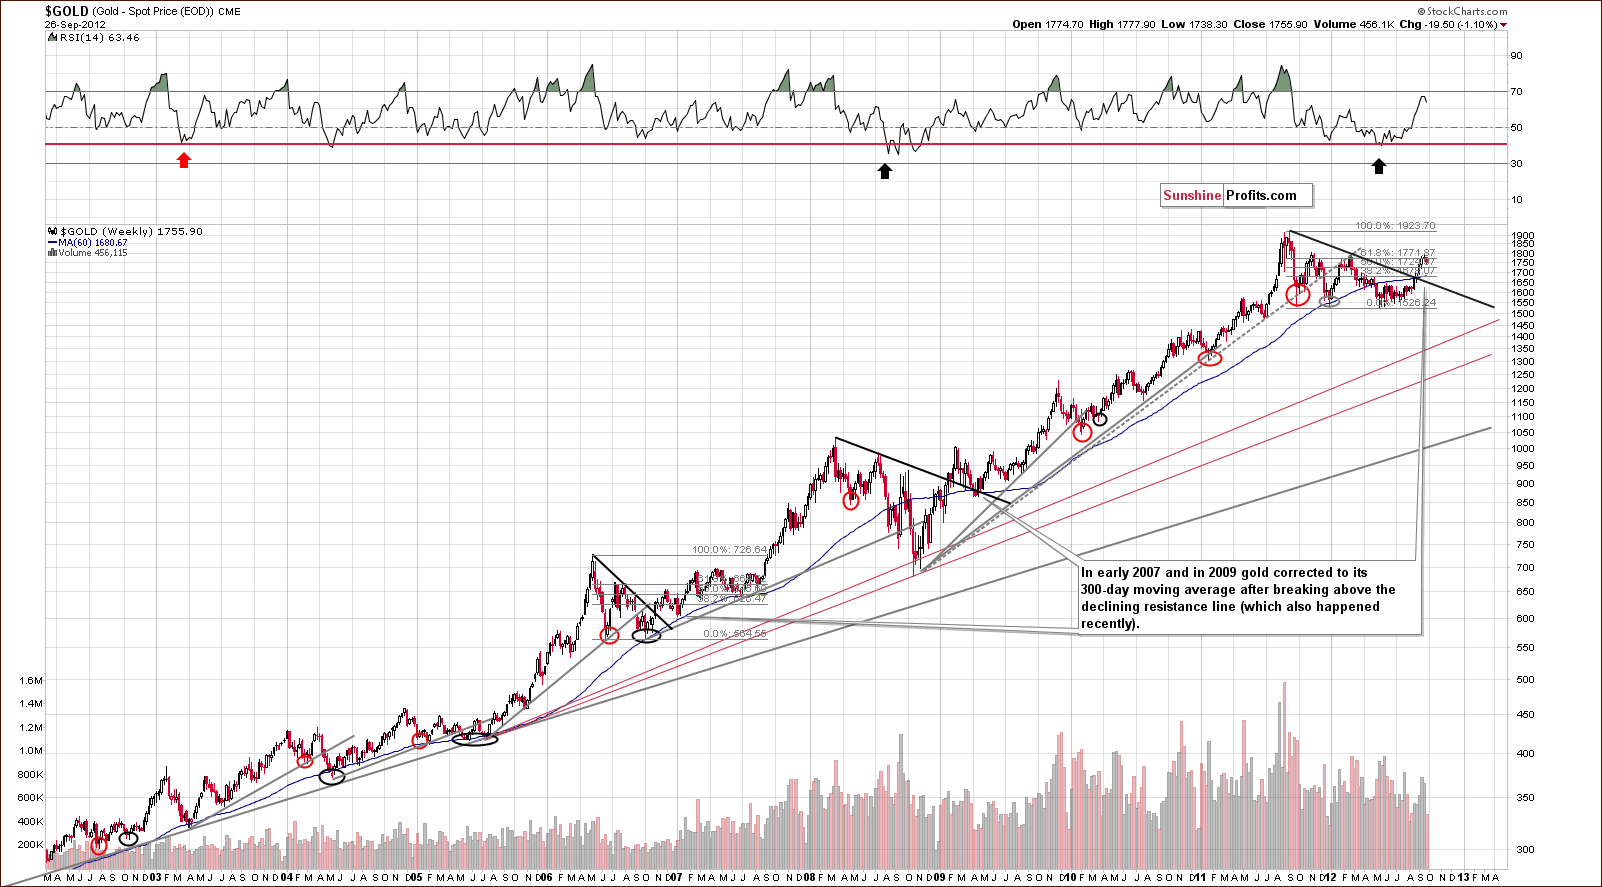
In gold’s very long-term chart (please note that you can click on this or any other chart to enlarge it), there is basically no change as gold’s rally stopped at the level of previous highs. According to an analogy with 2009 and 2006, we should see gold correct to its 300-day moving average before the rally continues. This would mean a decline to below the $1,700 level for the yellow metal.
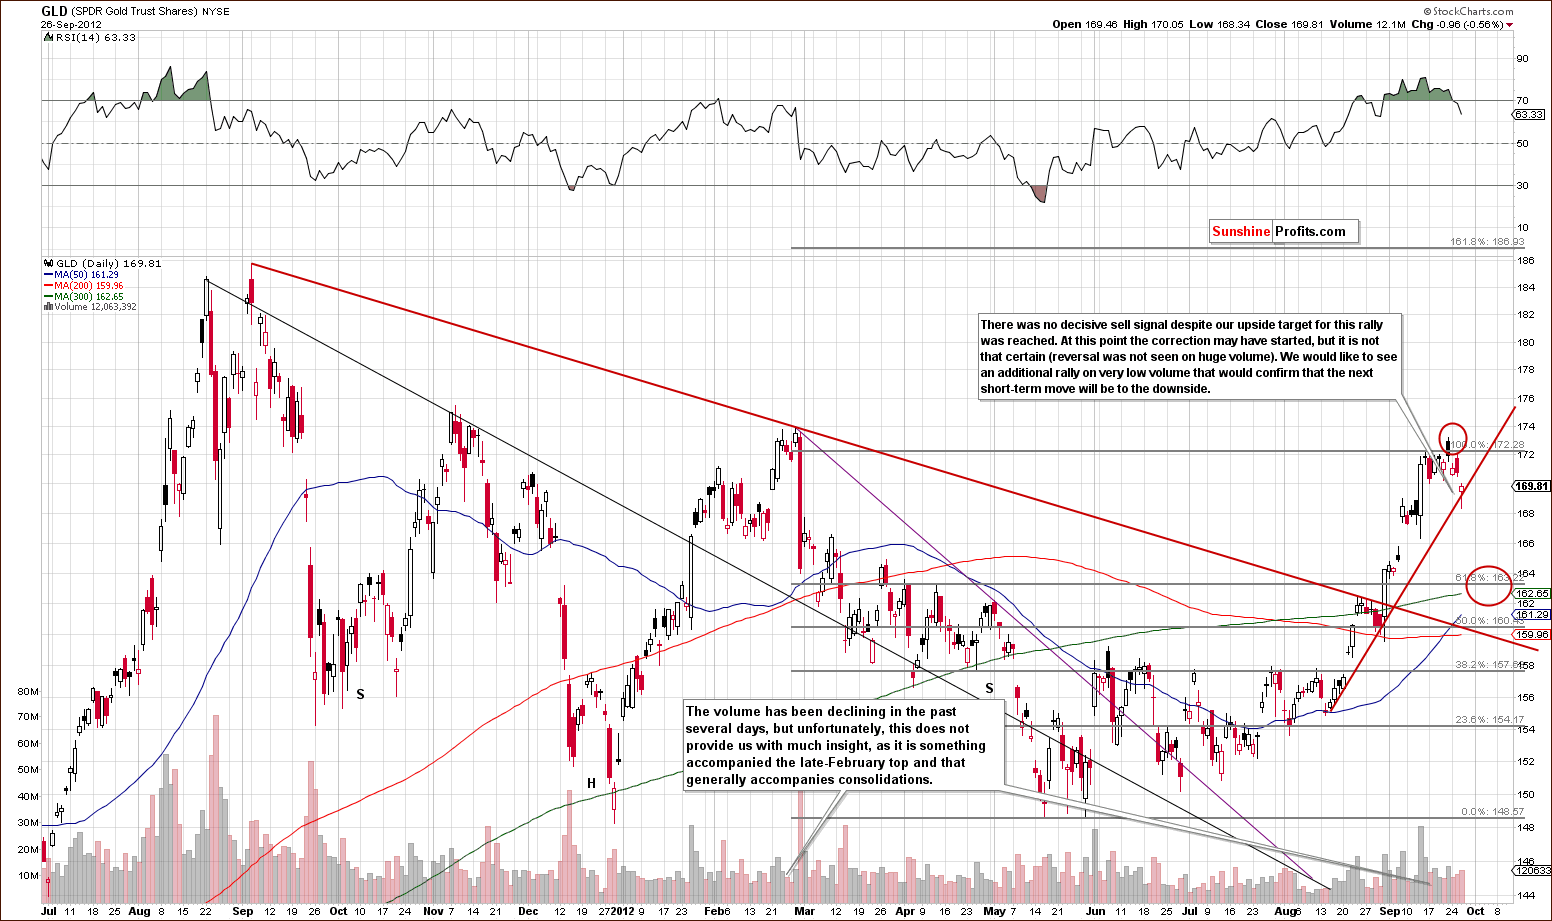
In the GLD ETF chart, we see some declines, but prices have not moved as low as expected. Is this simply a beginning of a decline? It’s really too early to say. We did not have a convincing sell signal, and even though gold price formed a top right in our target area, the reversal was on average, not huge volume levels, so going short appeared too risky. The decline that we saw in gold was relatively small - the short-term support line was not broken.
It seems that we could see another rally similar to what was seen in late February this year – especially if the USD Index declines. Back then, gold prices rallied and then plunged, and this is possible once again. Previous target levels are still up to date. Quoting from last week’s Premium Update:
The GLD ETF is likely to fall to $164 or so and this would create a bullish cup-and-handle pattern. The March to September period forms the cup, and the coming correction would form the handle of the pattern. This would be a bullish price pattern and after the correction, another strong rally would likely follow.
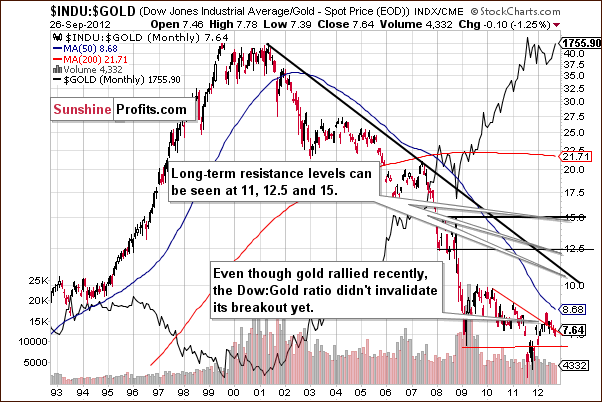
In the Dow to gold ratio chart, there is really no change to speak of this week. What was stated in last week’s Premium Updateis still up-to-date: “We have not seen an invalidation of the breakdown. We are rather seeing the ratio more or less at the declining support-resistance line based on previous important tops. The situation is mixed here.”
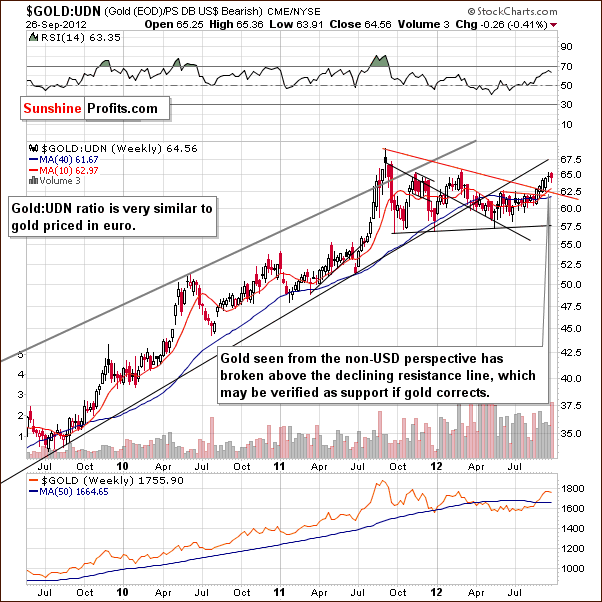
In this week’s chart of gold from the non-USD perspective, we have seen some insignificant correction this week. It seems that a bigger correction could be seen though this is not inevitable. The rally here was not as sharp as from the USD perspective, so the short-term outlook here is slightly bearish, nothing more. The medium- and long-term situation, however, remain bullish also from this perspective.
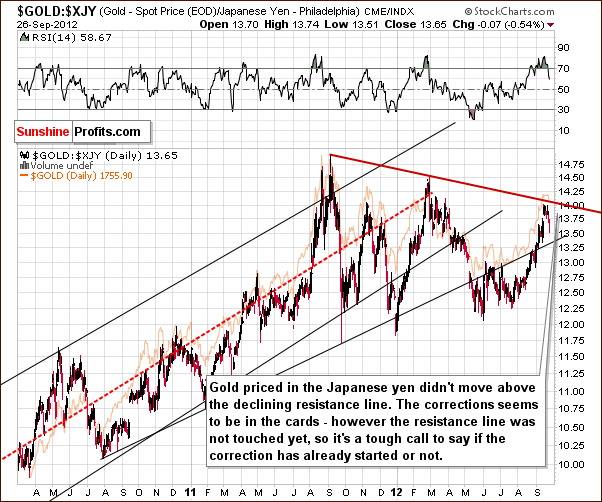
In this week’s chart of gold from the perspective of the Japanese yen, we see an outcome similar to our USD price analysis. An important resistance line was almost reached here, and it seems that it could be engaged one more time. Sell signals are not crystal clear from this perspective. Traders should wait for a better risk-reward ratio before opening short positions.
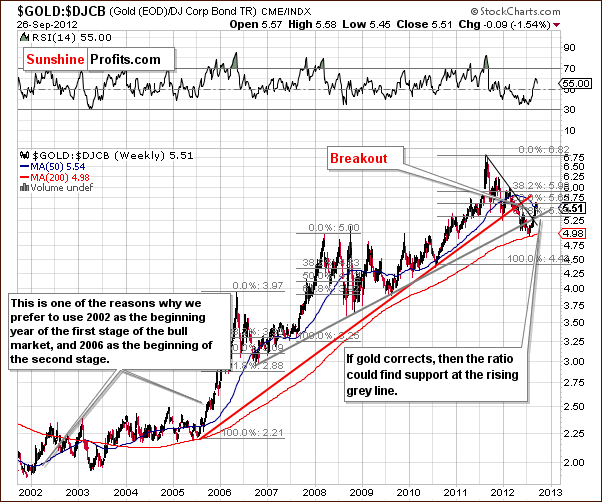
In the gold to bonds ratio chart, some kind of consolidation has been seen this week. The RSI reflects this, and right now a move could be seen to the rising grey support line as yet another verification of the move above this level.
Summing up, the situation remains bullish for the medium term and rather mixed in the short run. Prices could move a bit lower or higher before correcting below the $1,700 level. Opening speculative positions is not a good idea right now as the market appears somewhat indecisive. (“When in doubt, stay out”). The analysis of the USD Index implies that we will have some kind of trading opportunity soon. We might get an opportunity to trade the correction, but whether it comes or not, we will still have the opportunity to gain from the following rally.
Silver
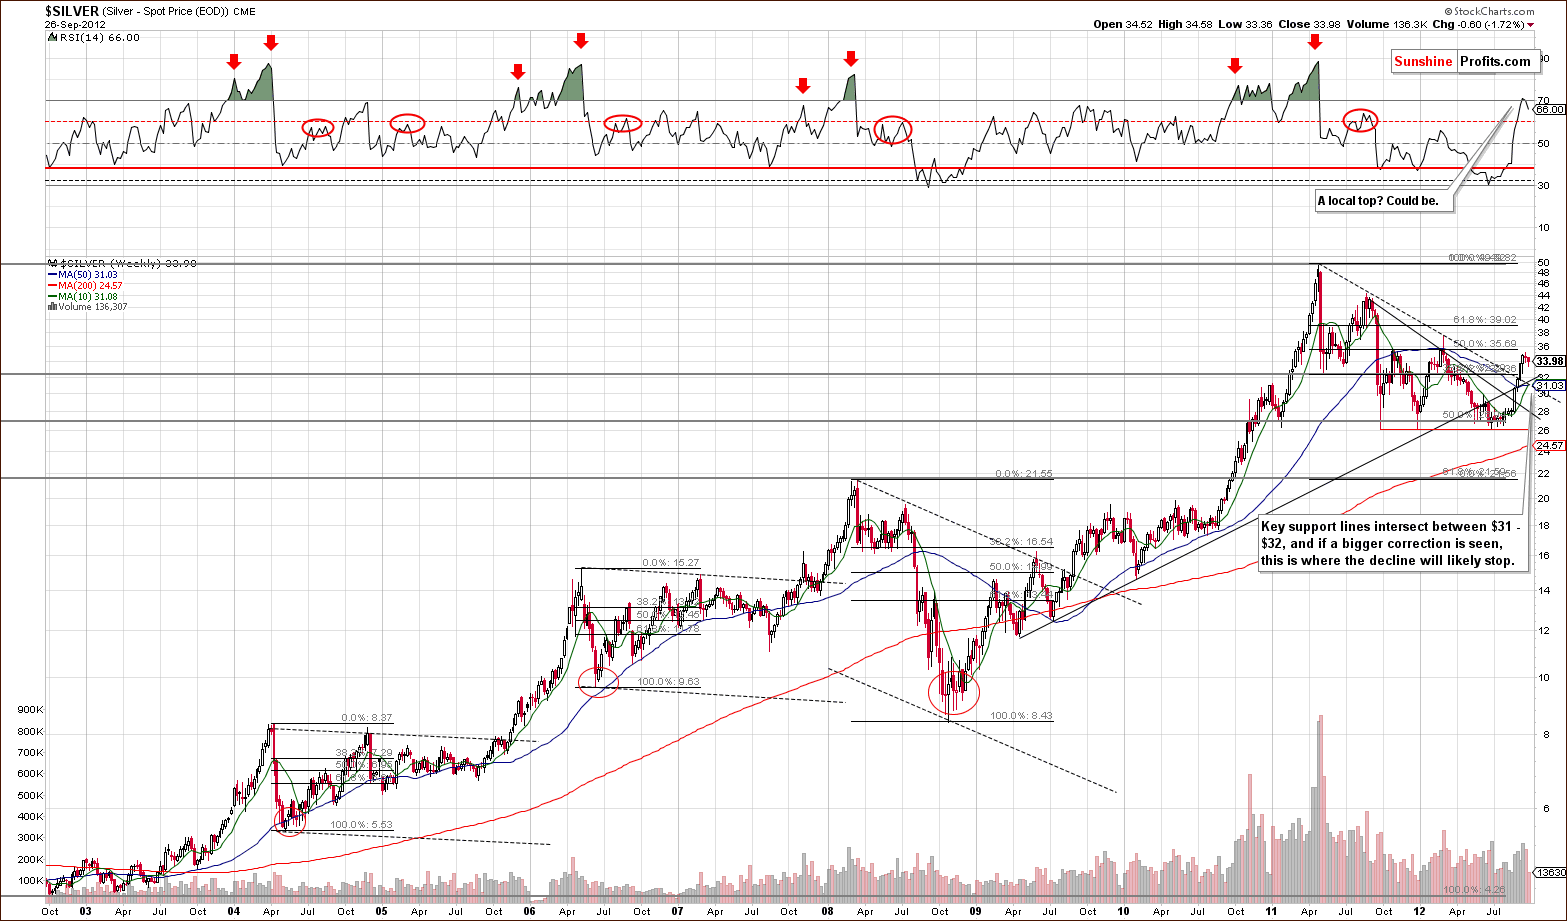
In the long-term chart for silver this week, a brief consolidation is seen with prices then correcting somewhat. The decline has not been nearly as spectacular as past declines and it is barely visible when compared to the size of the previous rally. We could very well see additional price declines before the next powerful move to the upside.
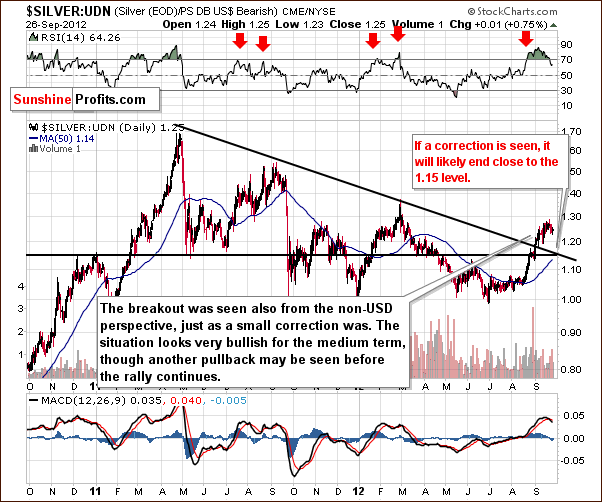
In this week’s chart of silver from the non-USD perspective, we have similar implications. We could see a verification of a breakout by a move to 1.15 here which would likely correspond to a correction in silver prices as well.
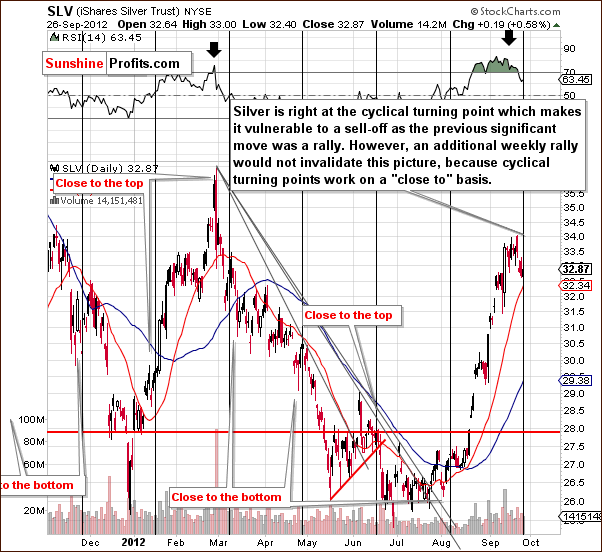
In the short-term SLV ETF chart, a cyclical turning point is seen suggesting that silver is vulnerable to a short-term sell-off. A small correction was already seen. Silver could still reverse and a double top could form which would be in tune with the cyclical turning point and the scenario in which the USD Index moves quickly lower before really correcting.
The presence of the cyclical turning point does not exclude one of the outcomes we get from an analysis of the USD Index. So a move higher here could be seen on low volume which would confirm that a bigger correction was likely to follow.
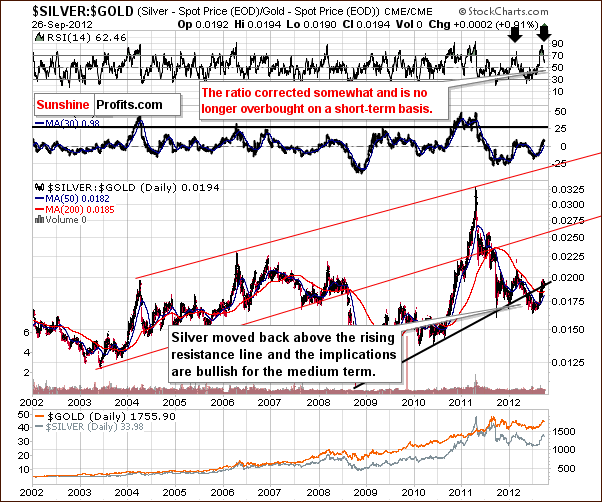
In the silver to gold ratio chart, the medium-term picture has improved greatly this week. The RSI level is no longer overbought, and the ratio moved to a support line without breaking it. The medium-term picture is bullish.
Summing up, silver looks like it’s about to correct, and this correction may or may not be seen immediately. A few days of consolidation is possible before a price correction, and it seems best to wait before entering any positions at this time.
Platinum & Palladium

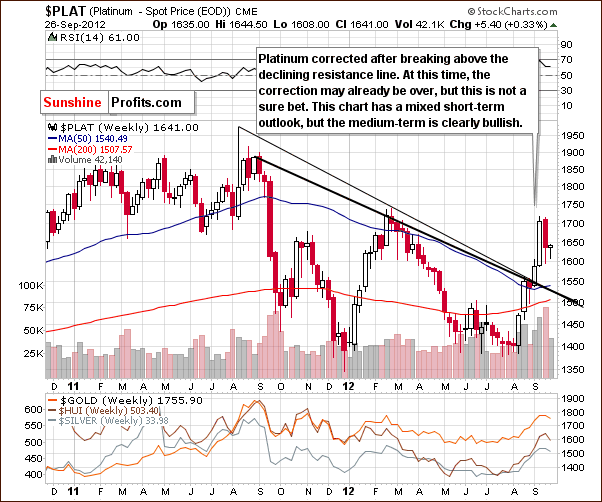
In the platinum chart this week, there was very little change as prices rallied less than one half of one percent. The correction may or may not be over here and the situation is best described as uncertain.
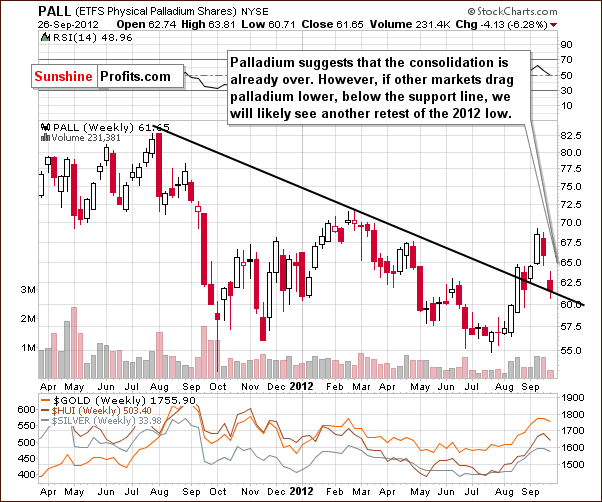
In this week’s palladium chart, we see that – unlike what we saw on the platinum chart - prices have corrected, suggesting that the consolidation is over. This is quite a small market so this signal alone carries very little weight. If palladium confirms or invalidates other markets, it really has very little impact. On the other hand, if it suggests something different, it’s really not regarded as a reliable indicator.
Summing up, not very much changed this week. The situation is somewhat unclear based on the platinum chart. Palladium however suggests a move to the upside could very well be seen but since it is not confirmed by other metals, we don’t put much weight to this indication.
Mining Stocks
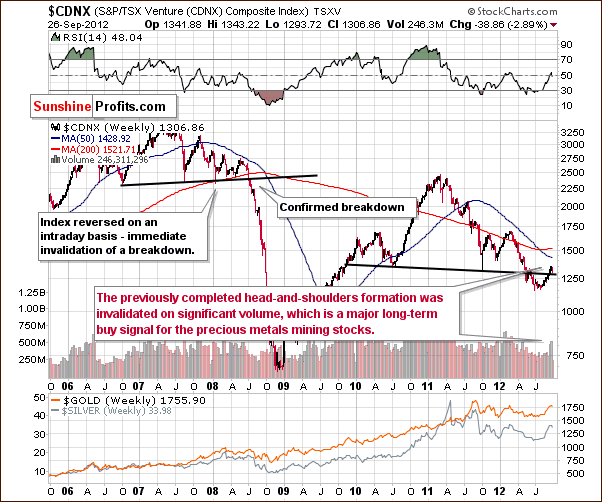
In the Toronto Stock Exchange Venture Index (which is a proxy for the junior miners as so many of them are included in it), last week’s rally above the neck level of the head-and-shoulders pattern was seen on huge volume. The implications from this chart support a bullish outlook for mining stocks in the medium term and very bullish for the long term.
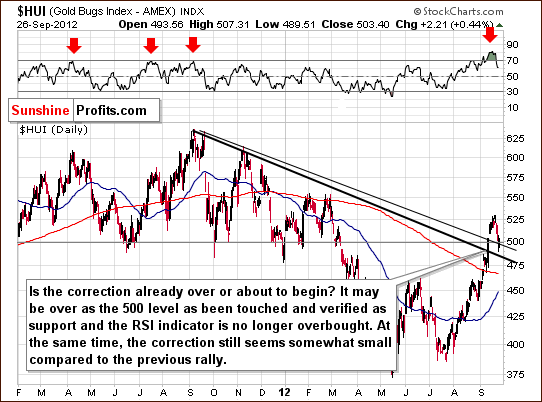
In this week’s medium-term HUI Index chart, the situation is no longer overbought on a short-term basis. Since one of the support levels was just reached we may not see additional correction here. This would correspond to a situation in which the dollar continues to decline without any additional correction. This is not the most likely outcome in our view. The correction in miners was quite small so far relative to the size of the previous rally and combining that with the fact that miners often top in a double-top fashion (actually, all of the tops visible on the charts above took this form) makes us believe that the real correction will start after additional small rally.
How low can HUI go if gold goes to or below $1,700? Prices could move to the 450-460 range. Please note that a move to $1,700 for gold would mean the recent decline would more than double. If this relative valuation is applied to gold stocks, we see that the 450-460 range is more or less where miners should go. Since this where the support level is seen (previous local tops) this target is quite realistic.
In the GDX ETF short-term chart, we see that the uptrend has not been broken, so the situation remains rather bullish for the short run. The previous signal did not indicate a major top, but we may see some sort of confirmation if another local top emerges.
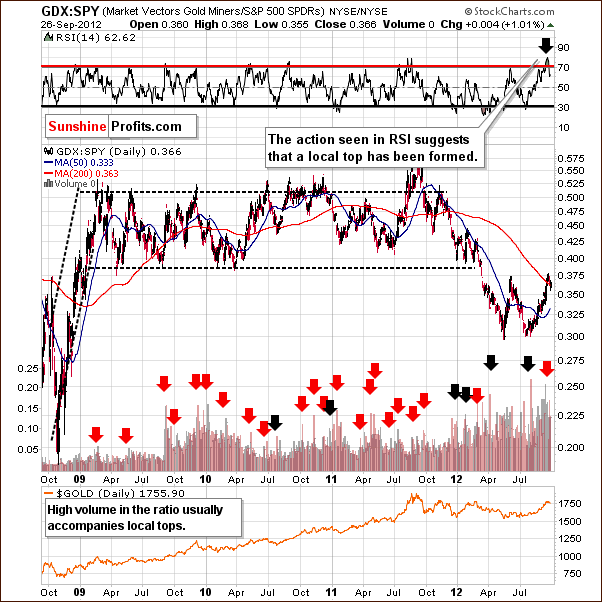
In the miners to other stocks ratio chart, we see a suggestion that the decline is underway. Now it could be the case that the second local top will be seen within the decline so the correction could very well be underway right now. This chart does not tell us if another move to the upside will be seen. A move higher on low volume, however, should make us more certain that declines will follow.
Summing up, the situation in mining stocks is rather uncertain, much as is the case with gold this week. It’s likely that the next buying opportunity will be seen quite soon, and we may get a chance to trade the correction in the days ahead as well. The latter will not be a recommended action unless a confirmation is seen, perhaps in the form of an additional rally on low volume.
Letters from Subscribers
Q: Rick Rule is fairly skeptical on gold and silver stocks. Regarding gold juniors, his perspective seems to be that they've brought investor skepticism on themselves by underperforming and under-delivering. His idea is that the bottom 70 percent or so regularly deliver a loss that is aggregately in the billions. Rick believes the political outlook for resources is "dim" because the mining industry has defrauded investors by misstating total production costs. By using write-offs creatively, the industry as a whole is able to understate how much it really costs to produce gold and silver in the 21st century. Regarding hospitable mining countries, he basically starts and ends with Chile. "I could perhaps broaden the list to include Brazil," he adds, and perhaps Nevada, too. His idea is that most of the rest of the world, governments certainly, are looking on successful mineral deposits as a license to steal. This is partially because the world itself is struggling in the grip of sluggish performance. What is your take? Thanks.
A: We discussed the demand side (at least the official demand) in the first part of today's update - the demand for gold will likely go up. The supply of gold is limited and there were no major discoveries recently. This implies that senior mining companies will likely fight over those that are not that prominent. This means takeovers of junior mining companies and substantial increases in prices.
We agree that juniors brought investor skepticism on themselves by underperforming and under-delivering. This makes the situation very bullish for juniors. A great time to buy an investment asset is when everyone and their brother hates it and this is the case for the junior sector.
Technically speaking, juniors invalidated a clear long-term head-and-shoulders pattern that was verified. This was an unlikely development and a very bullish one - it shows a "hidden potential" in this market.
Q: Could you please post a comprehensive listing of all ETFs that actually hold precious metals? Thanks.
A: We will not be able to verify with 100% certainty that all ETFs that claim to hold precious metals actually do. However we can provide a list of the 5-star ETFs for investment purposes based on our analysis. The list may change slightly in the future as we are still fine-tuning our selection criteria, but it is not likely to change very much.
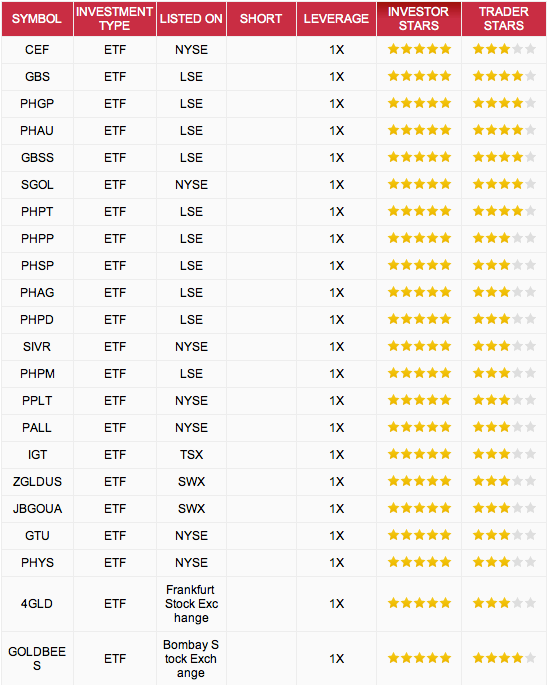
What you see above is the top of the precious metals ETF/ETN ranking based on over 100 precious metals ETFs/ETNs when ranked in order of their usefulness for long-term investors. This is one of the tools that required many weeks of work and that will be made available to you shortly. Of course, you will then be able to see the whole list, as well as apply different filters to it. For instance you will be able to rank ETFs/ETNs according to their usefulness for trading purposes or leverage. Each of the above 100 funds will be accompanied by a description and also a description of the entity governing it (reputation is one of the many factors that determine a fund’s ranking).
Q: I think what would be helpful right now would be the odds of the dollar continuing to 80.70 or so. It certainly looks like that would precipitate a drop to at least 1700, maybe taking GDX to 48 or so.
I don't know what you consider a significant correction (and maybe you should start defining that in each situation?) but depending on “the odds”, a $3 move in GDXmight be significant for some of us to take some action.
(…)
I'm not talking about day trading long term stuff, but suffice it to say that a $1.50 move in GDX can be worth $9K to me, which I consider 'significant'. So try to help us out here if you can.
A: I would estimate the odds of the dollar continuing to 80.70 or higher before the decline resumes at 45%. And I'd give a 55% probability for the move lower (below 78.5) to be seen before a rally to 80.70 is seen.
All in all, the situation is pretty much 50/50 right now, and the odds don't favor an open speculative position.
I understand that making some quick profits here is a desirable outcome, but we simply can't allow this desire to make us open a speculative position when the risk/reward ratio is not very favorable. The more probable and less risky bet will be on the coming rally, because this rally is very likely to emerge, the only question is at what price we should enter. When the USD Index is higher, at 80.70, we should have a good entry price for long positions. I suggest focusing on this move as the main next trade and treating the possible short position right before that as optional. If we get a favorable situation, we will enter the short position even before going long and we will strive to catch both moves. However, if the situation doesn't get clear enough, we will simply skip the short position as too risky, and focus on the next long trade. The next long position will probably be confirmed by at least one of our indicators, which means that the size of the position will be relatively large (double the size of the position without a confirmation from our indicators).
If you haven’t done so, please read our essay about gold & silver portfolio structure for details, especially the part about “Trading / Cash”. On a side note, it implies that we will never hold a short position if one of our indicators flashes a buy signal (having this approach earlier would have, for instance, caused you and us to get out of the speculative short positions at significant profit when the HUI Index traded close to 400 level.)
Additional Information
I just received a letter from the CFA Institute along with an attachment that I am supposed to show to my employer. Since I work exclusively for you, I’m reporting accordingly. Please click on the image below to expand it.
Once again, thank you for your support.
In other news, as you read in the opening paragraph, we made some improvements to the website. In addition to providing the reader-friendly mode and enhancing the printing mode, we also completed configuring your account with us – as you noticed the e-mail once again refers to you by name, and not by e-mail. Also, your account now shows the proper subscription plan. As you requested, we will be bringing the little charts with live prices back. We used them ourselves and we miss them as well.
There’s also been a major improvement in terms of security and privacy. Have you noticed the green bar in your web browser (right next to the address of the website) when you're reading Premium Updates or doing anything else on the website? That's something that you may know from log in or payment pages on some websites (those that decided to purchase the top level of certificate; the cheaper, lower quality ones won’t show you the green bar). This means that what you see or do on that page is encrypted and safe. As our premium subscriber, you have this protection enabled at all times - no matter if you read updates, reports, watch videos in the multimedia section or use tools, as long as you are logged in to your premium account, your connection will stay encrypted and you will remain safe. On a side note, we purchased the most prestigious package (called extended validation) for you from our SSL provider and it comes with a $1,000,000 warranty.
Of course, the payment page is also properly encrypted. Speaking of payments, another feature that many of you requested in the past years was the ability to subscribe to a quarterly or yearly plan (which are cheaper on a monthly basis) without the PayPal system – that’s another thing that was introduced. We moved from a rather complicated system that involved 2 external payment systems to a brand new one that does not require you to leave our page during the subscription process at all. Right now all it takes is to select the payment plan and enter card details on the following page. Because of this change, we need to ask you toupdate your account so that we can fully move to this new, better solution.
This is very important for us and for you. It’s important for us because right now we have to monitor 3 separate payment systems (the new one, fully-integrated with the new website) and 2 old ones (including the PayPal system), which is quite time consuming for the several members of the SP Team, including your Editor. We would much prefer to spend this time on analyzing markets, sending extra alerts, providing new features to you, upgrading existing ones and similar. It’s important to you because the sooner we are able to implement new features, the sooner you will be able to use them and make more money on them. So, please help us help you make more money sooner by updating your account as soon as possible. We will individually check each premium account to see if everything was updated successfully and if so, we will take care of cancelling the subscription that you had using the previous payment system. So, all we ask you to do right now is to select the payment plan and to confirm the choice on the following page using your card. Naturally, the payment will be made after the already-paid-for period comes to an end, but providing details now is necessary to ensure the continuity of your subscription at that time. We ask you to proceed now, because the sooner we can completely move to the new payment system (meaning that everyone has to update their account), the sooner we will be able to fully focus on new profitable features for you.
On a side note, this may be a good moment to switch to a quarterly or yearly plan – it’s convenient, because you will need to select a payment plan anyway to update your account, so you can simply choose the bigger plan and save some money with no extra hassle (technically there is no difference between signing up for the same or bigger plan on the selection screen). This will also allow us to provide you with more features faster, so it seems beneficial for everybody.
After you update your account today, we suggest that you take a few moments to watch both videos dedicated to our Golden StockPicker and Silver StockPicker tools – these are our daily-updated, and tailored gold and silver stock rankings that we will strongly encourage you to use if miners decline and if you are still not invested with your long-term capital. If you are, they you should still be sure you are on top of these tools because mining stock holding should be rebalanced regularly to maximize your profits. We also encourage you to read the detailed report that we written regarding the mining stock rankings and the rebalancing principles. If you’re short on time right now, please watch these videos now (be ready to use these tools, because it seems they will become indispensable quite soon – when miners:gold ratio confirms the breakout) and move to the report at a later date.
Summary
The situation in the USD Index will likely develop in one of two ways: a small move to the upside could be followed by a period of decline, or prices could move lower and then have a bigger bounce. If a decline is seen to the 78 level or so, we will likely see a favorable shorting opportunity in the precious metals market. If, however, a rally is seen in the USD Index, gold would move lower and an opportunity to go long would emerge.
The outlook for the general stock market continues to be mixed for the short term. The picture deteriorated this week as stocks moved below the 2008 high in terms of the S&P 500 Index. Also, the Transportation Average did not confirm the bullish move in the market. The implications for precious metals are a bit more bearish than not for the short term generally because of the price action seen in stocks this week.
Interestingly, gold did not respond to all the bearish signals coming from the USD Index this week. A reversal was seen in gold and mining stocks on Wednesday and a possible small move higher may be seen in the precious metals. If such a move is seen on low volume, it will suggest a top to be followed by a bigger correction with gold possibly moving below $1,700. This would likely allow us to take short positions. This is by no means a sure bet however, as the risk-reward ratio is not yet favorable. Waiting on the sidelines with one's speculative capital is justified at this point. Staying in the market with long-term precious metals investment capital remains a good idea. If you are not entirely sure what we mean by speculative and investment capital, please refer to updated version of Gold & Silver Portfolio Structure.
Thank you for using the Premium Service.
This completes this week’s Premium Update. Our next Premium Update is scheduled for Friday, October 5, 2012. Of course, we will continue to send out Market Alerts whenever appropriate.
As we asked above – please update your account as soon as possible.
Przemyslaw Radomski, CFA

