
Crude Oil
Without a doubt, the previous week was quite hard for the market players. When we take a closer look at the chart of crude oil we clearly see that the price of light crude remains in the narrow range between $100 and $104 per barrel. Since the beginning of the month oil bulls and bears have pushed it above or below the 38.2% Fibonacci retracement level, however, neither the buyers nor the sellers have had enough strength to win and trigger another bigger move.
At this point, it’s worth mentioning that oil bears managed to push crude oil to its new monthly low of $100.60 on Friday, after the International Energy Agency warned in its monthly oil-market analysis that the U.S. fiscal crisis could harm demand and said that supplies were rising faster than previously thought.
Although the IEA said that a relatively short government shutdown would have a "negligible" impact on the oil market, it warned that concerns over the impending debt ceiling could have a greater detrimental effect on oil demand. The IEA said that a significant deterioration in business and/or consumer confidence could potentially undermine the macroeconomic momentum required to drive the additional oil demand growth in 2014.
And speaking of the government shutdown, it’s worth noting that weekend talks to avert a U.S. debt default showed signs of progress on Sunday, but there were still no guarantees that a government shutdown was about to end. According to Reuters, failure to raise the debt ceiling would leave the world's biggest economy unable to pay its bills in the coming weeks. Banks and money market funds are already shunning some Treasuries normally used as collateral for short-term loans, a sign that a deadlock over the debt ceiling could disrupt a key source of day-to-day funding in the financial system.
What’s interesting, on Friday the Energy Information Administration said it was halting its release of weekly oil supply and demand data due to the government shutdown. The oil market instead will have to focus on similar data from the American Petroleum Institute. Taking these circumstances into account, it seems that this would be another tough week for oil investors. We will need to stay focused as a breakout or breakdown below critical resistance/support levels could be followed by a significant price move.
Additionally, there is one more important factor, which will likely have an impact on crude oil in the coming days. Tomorrow, negotiations will start in Geneva about Iran's nuclear program. In the past weeks any easing of tensions and the fact that Iran wants to negotiate about its nuclear program have had some downward effect. This could be the case once again and creates a bearish bias for this week.
Having discussed the above, let’s now move on to the technical part of this week‘s Oil Investment Update and focus on the technical changes in the crude oil market. Just like a week ago, we take a look at charts in different time horizons to have a more complete picture of the current situation in the oil market.
Let’s start with a look at the monthly chart of light crude (charts courtesy by http://stockcharts.com).
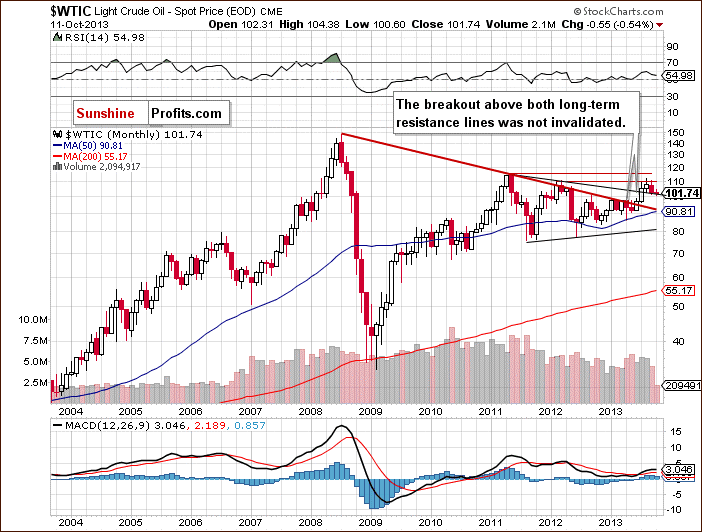
On the above chart we see that crude oil still remains above the long-term declining resistance line based on the July 2008 and May 2011 highs (bold red line). However, light crude reached the long-term declining support/resistance line based on the September 2012 and March 2013 highs (the upper black line). Despite this downward move, there was no breakdown below this line (in terms of monthly closing prices) and crude oil still remains above it.
From this perspective, the picture is bullish and the breakout above these two long-term declining resistance lines hasn’t been invalidated.
Now, let’s zoom in on our picture of the oil market and see the weekly chart.
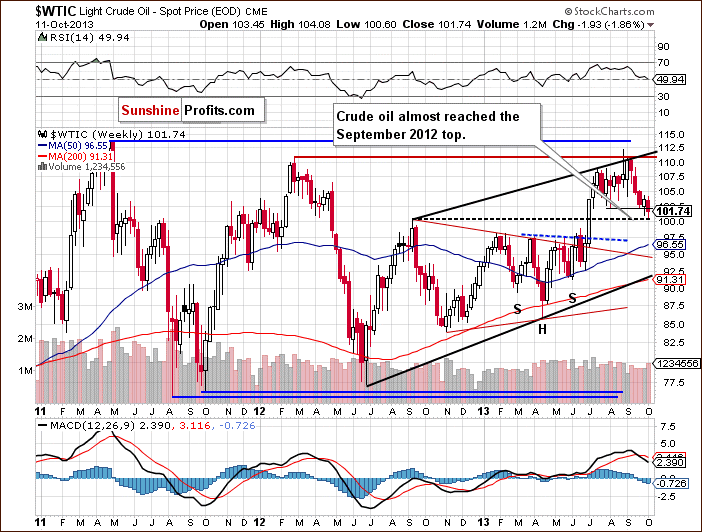
Looking at the above chart, we see that the price of crude oil declined once again in the previous week and dropped below the September low. In this way, light crude slipped to a new monthly low of $100.60 and closed last week below the August low. In spite of this downward move, the breakdown below this level is not confirmed at the moment.
As you can see on the weekly chart, crude oil almost reached the September 2012 top, which is a support level that may encourage oil bulls to act. If it happens, we will likely see a pullback to around $104. However, if it is broken, the next target level for the sellers will be close to $99.
From this point of view, the situation is still mixed.
Now, let’s check the short-term outlook.
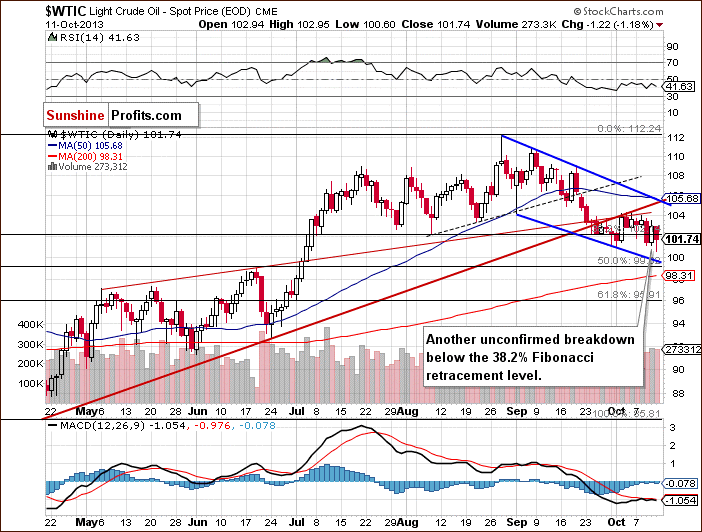
On the above chart, we see that the situation has deteriorated since our last Oil Investment Update was published. At the beginning of the previous week, after three unsuccessful attempts to move above the rising medium-term support/resistance line oil bears triggered a corrective move and tested the strength of the 38.2% Fibonacci retracement level once again. The price of crude oil dropped below $102 per barrel and slipped below the 38.2% Fibonacci retracement level. Although this deterioration was only temporary and light crude quickly rebounded, in the following days we saw more attempts to move below this level. Finally, oil bears won and closed the previous week below the 38.2% Fibonacci retracement level. However, the breakout is still not confirmed.
Looking at the above chart, we see that crude oil still remains in the declining trend channel. The upper line of this channel (based on the Aug. 28 and Sept. 19 highs – currently close to the $105.20 level) intersects with the medium-term support/resistance line and forms with it a strong resistance zone. Therefore, if the buyers manage to push the price above this resistance zone, we will likely see further growths. On the other hand, the above strong resistance may encourage oil bears to act. In this case, we may see a downward move to the lower border of the trend channel (currently slightly below $100). At this point, it’s worth mentioning that in this area there is also the next support zone based on the 50% Fibonacci retracement level and the June high.
Summing up, although there was a downward move in the previous week, which took the price of light crude to a new monthly low, technically, the situation hasn’t changed much in the short term. As long as there is no confirmed breakdown below the 38.2% Fibonacci retracement level further declines are unlikely. Please note that crude oil reached the long-term declining support/resistance line based on the September 2012 and March 2013 highs (the upper black line on the monthly chart) and almost reached the September 2012 top, which is a medium-term support level, which may encourage oil bulls to act and slow further declines.
Once we know the current outlook for crude oil, let’s examine the NYSE Arca Oil Index (XOI) to find out what the current outlook for the oil stocks is and to check if they confirm or invalidate the above analysis of the crude oil market.
Oil Stocks
We begin with the long-term chart.
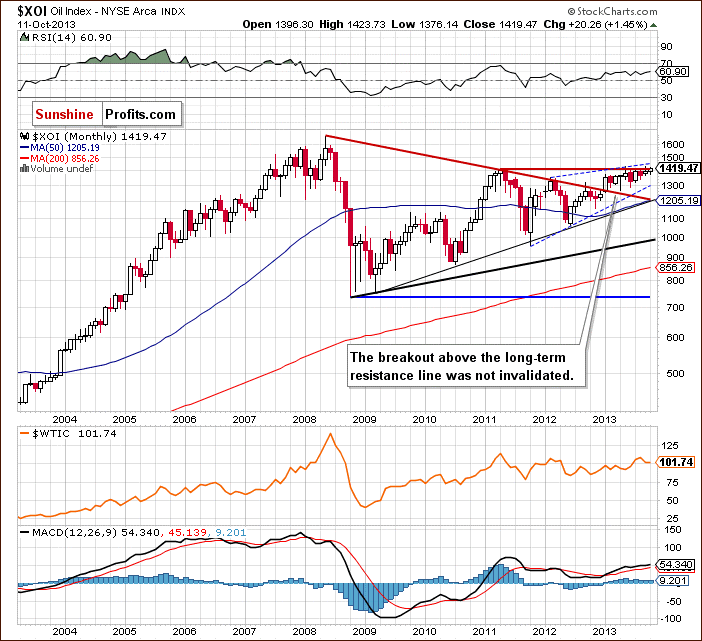
On the above chart we see that the XOI still remains above the previously-broken long-term declining resistance line based on the 2008 and 2011 highs and the breakout hasn’t been invalidated. The oil index also remains in the range of the rising trend channel.
At this point, it’s worth mentioning that the XOI came back above the May 2011 top. Therefore, taking these observations into account, the situation is still bullish.
To see this more clearly, let’s zoom in on our picture and move on to the weekly chart.
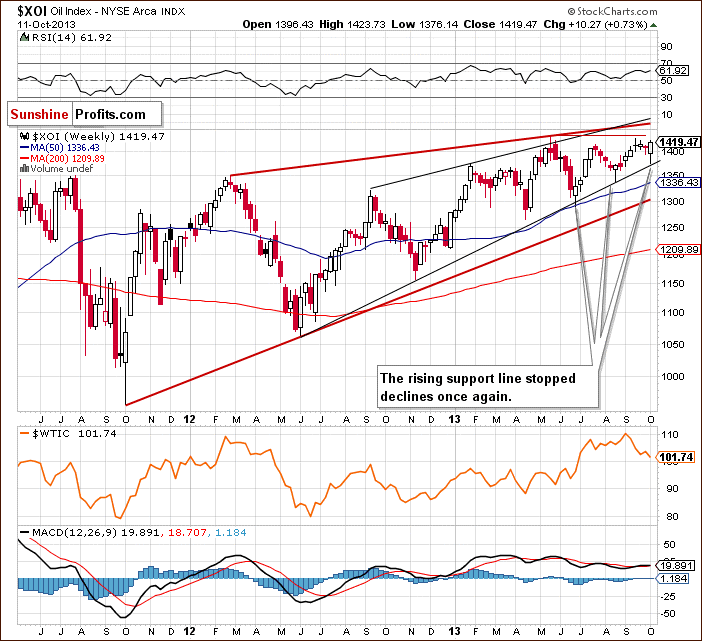
Looking at the above chart, we see that the oil stock index dropped to a weekly low at 1,376 in the previous week. However, this deterioration was only temporary and the XOI closed the whole week above 1,400 once again. On top of that, when we take into account weekly closing prices, we notice that this is the highest weekly close since June 2008.
Please note that the recent corrective move has taken oil stocks to the medium-term support line (marked in black), which is also the lower border of the rising wedge. As you see on the weekly chart this strong support line stopped declines once again. Taking this fact into account, further growth is quite likely.
However, keep in mind that the XOI is still close to the May top. The proximity of the above resistance level may encourage oil bears to go short once again and trigger a correction. In this case, the first support would be around 1,400 and the next one would be the medium-term support line (currently close to 1,380).
From this point of view, the medium-term uptrend is not currently threatened, and the situation remains bullish. It’s worth noting that even if the buyers manage to push the XOI higher, further increases may be restrained by the upper line of the rising wedge (currently close to 1,450).
At this point, we’ll focus on the relationship between light crude and the oil stocks.
When we take a look at the above charts and compare the price action in both cases, we clearly see that oil stocks were stronger in the previous week once again. Although, they dropped below 1,400, we saw a sharp pullback, which resulted in the highest weekly close since June 2008. What happened with the price of crude oil at the same time? Light crude declined and closed at its lowest level since June. Additionally, it dropped to a new October low, which clearly shows its weakness in relation to the oil stocks.
Now, let’s turn to the daily chart.
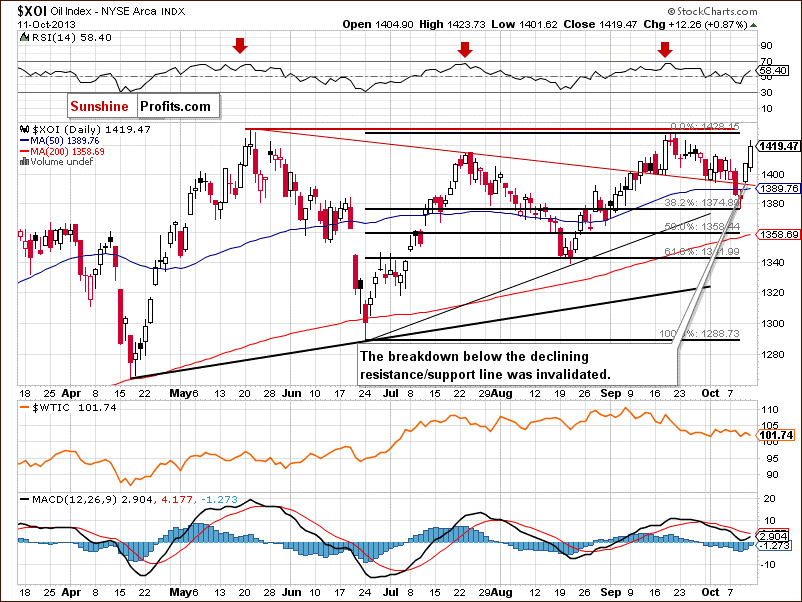
Looking at the above chart, we see that at the beginning of the previous week, sellers pushed the oil stock index not only below 1,400, but also below the declining resistance/support line based on the May and July highs. With this downward move the XOI reached the 38.2% Fibonacci retracement level based on the entire June-September rally (around 1,375).
This strong support level encouraged buyers to act and resulted in a pullback in the following days. In this way, the breakdown below the declining resistance/support line was invalidated. It’s worth noting that the recent increases took the XOI above its 50-day moving average, which is a bullish sign. Additionally, when we take a closer look at the above chart, we can see the morning star candlestick pattern.
Please note that the nearest support is the declining resistance/support line, which currently almost intersects with the 50-day moving average (currently around 1,390). This area is also reinforced by the already mentioned bullish candlestick pattern. The next support level is the 38.2% Fibonacci retracement level. Even lower, we have a support zone based on the Aug. 27 and Aug. 30 lows (1,361-1,364), and a further one based on the Aug. 21 bottom and the 61.8% retracement level (1,338-1,339).
Now, let’s comment on the relationship between the WTI and the XOI in the short term.
This time, we saw a negative correlation between light crude and the oil stocks. At the beginning of the previous week, there were declines, which pushed the oil index below the short-term declining support line, however, in case of crude oil we saw an upward move, which took it to the medium-term rising resistance line. On Wednesday, after the XOI reached the 38.2% Fibonacci retracement level, we saw a sharp rebound, which triggered a rally in the following days. At the same time, crude oil tested this Fibonacci retracement and finally closed last week below it.
Summing up, from the long-, medium- and short-term perspectives the outlook for oil stocks remains bullish and the uptrend is not threatened at the moment. Taking into account the relationship between light crude and the oil stock index in the previous week, we clearly see that the oil stocks still remain stronger in relation to crude oil.
Once we know the above relationship, let’s take a closer look at the chart below and check the link between crude oil and gold.
Crude Oil – Gold Link
Let’s examine the daily chart.
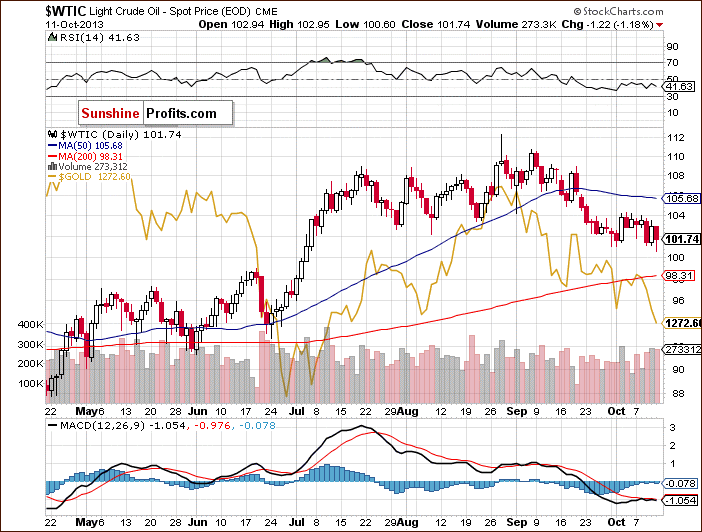
Looking at the above chart, we see similar price action in both commodities. At the beginning of the previous week they appreciated, but this improvement was only temporary and we saw declines in the following days. At this point, it’s worth noting that in the case of crude oil, buyers managed to push the price higher on Friday, which resulted in a pullback above the October low (in terms of daily closing prices). Meanwhile, gold declined and reached its new lowest level since the August top (also in terms of daily closing prices), which means that the yellow metal was weaker in relation to light crude in the previous week.
Before we summarize, let’s examine the medium-term outlook for gold. Let’s turn to its weekly chart.
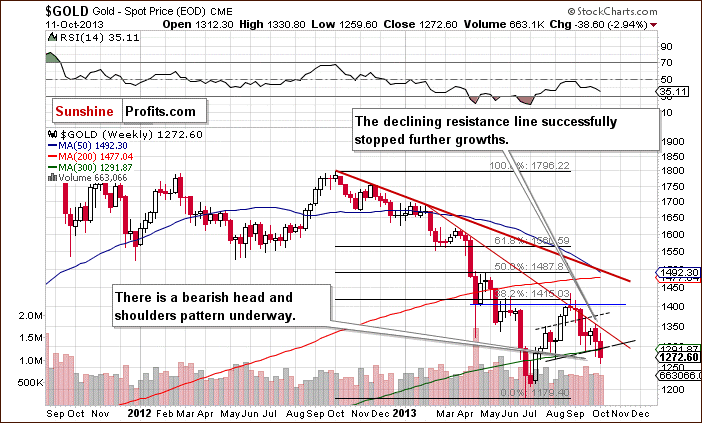
As you see on the above chart, in the previous week gold didn’t even reach the declining resistance line based on the October 2012 and February highs. Just like earlier this month, gold bears quickly noticed this weakness and took the opportunity to go short. They triggered a corrective move, which pushed the yellow metal below $1,300 an ounce.
At this point, it’s worth mentioning that with this move gold completed the head and shoulders pattern and went down below the neck level once again. According to theory, the price target for the pattern is around $1,140.
From this point of view, the medium-term outlook remains bearish.
Summary
In the previous week, the weakness of oil in relation to oil stocks was clearly visible. The oil stock index rebounded sharply after reaching the 38.2% Fibonacci retracement level and closed at its highest weekly close since June 2008. Therefore, further growth is quite likely. What happened with the price of crude oil at the same time? Crude oil not only dropped below this strong support level on Friday (the breakdown is unconfirmed), but also has hit its new monthly low. In case of the oil stocks, the medium-term declining support/resistance line encouraged buyers to act. Meanwhile, in case of crude oil, the medium-term rising support/resistance line still serves as strong resistance and keeps further growth in check. Additionally, light crude is still trading in the declining trend channel. Therefore, further moves in both directions are limited. Taking the above facts into account, it seems that oil stocks have greater upside potential than crude oil itself at this moment.
Looking at the relationship between crude oil and gold, we notice similar price action in both commodities in the previous week. However, on Friday, the yellow metal dropped to its new lowest level since the August top in terms of daily closing prices. At the same time, light crude showed some strength and oil bulls managed to close previous week above the October low if we consider daily closing prices. This means that the positive correlation between both commodities may change in the following days.
Please note that as long as there is no confirmed breakdown below the 38.2% Fibonacci retracement level in crude oil, further declines are unlikely and, from this point of view, the uptrend is not threatened at the moment. At the same time, the downtrend in gold remains in place and the yellow metal remains below the declining resistance line which has already successfully stopped buyers several times. Additionally, gold has completed the head and shoulders pattern and gone down below the neck level, which confirmed this bearish formation.
Very short-term outlook: bearish
Short-term outlook: mixed
MT outlook: mixed
LT outlook: bullish
Trading position (short-term): We do not suggest opening short positions yet. If we see a breakdown below the lower border of the declining trend channel (based on Sept. 3 and Sept. 30 lows), we will consider opening speculative short positions.
This completes this week’s Oil Investment Update. Our next Oil Investment Update is scheduled for Monday, Oct. 21, 2013. Oil Trading Alerts subscribers will additionally receive similar but shorter alerts on a daily basis (or more than once a day when the situation requires it).
Thank you.
Nadia Simmons
Sunshine Profits' Crude Oil Expert
Oil Investment Updates
Oil Trading Alerts

