
Crude Oil
Looking at the chart of crude oil from today’s point of view, we can say that the first week of a new month and a new quarter was quite good for oil bulls. Although we saw a drop below the August low and the 38.2% Fibonacci retracement level, buyers didn’t give up and stopped further declines, which resulted in an increase to a weekly high of $104.38. In the previous week, light crude gained 0.87% and closed higher for a first time in four weeks. Before we jump into the world of charts, let’s take a look at recent circumstances which may have had a great impact on the price of crude oil.
The first bearish factor, which pushed crude oil lower was the first U.S. government shutdown in 17 years. Light crude dropped to a new monthly low at $101.05 on concerns that this event would reduce demand for black gold in the world's largest oil consumer market.
At this point, it’s worth mentioning that crude oil was also under pressure from a surprise surge in U.S. crude stockpiles. The U.S. Energy Information Administration said in its weekly report that U.S. crude oil inventories rose by 5.5 million barrels in the week ended Sept. 27, missing market expectations for an increase of 2.3 million barrels. However, investors shrugged off the inventory data and also ignored soft numbers out of the labor market. They were focusing more on the U.S. government shutdown and the impact on the dollar. A weakening greenback supports prices as importing nations find it cheaper to buy dollar-priced oil using their own currency. Therefore, on Wednesday, light crude gained over 2% and reached $104.23. It’s worth noting that this is crude oil’s largest daily percentage gain since Sept. 18.
In spite of this growth, on Thursday further easing of tensions between Iran and the West over the Middle East country's nuclear program dragged on prices. The United States held out the possibility of giving Iran some short-term sanctions relief in return for concrete steps to slow uranium enrichment and shed light on its nuclear program. These circumstances resulted in a small drop, but oil bulls managed to hold the price of crude oil above $102 per barrel.
Before we finish this part of today‘s Update, we would like to mention one more factor which also influenced the prices. On Friday, crude oil gained 0.77% as energy companies in the Gulf of Mexico started shutting in production and were evacuating some workers as Tropical Storm Karen headed towards a crucial part of the basin. It is light crude’s first gain in three weeks as half of oil production in the U.S. Gulf of Mexico was offline.
According to EIA, storm disruptions to oil production in the U.S. portion of the Gulf of Mexico (GOM) and along the Gulf Coast have declined in recent years because of regional shifts in where production takes place; there are now greater levels of production taking place at inland basins, which are generally less affected by storms.
For example, the GOM share of crude oil production has declined, from 26% in 2007-11 to 19% last year.
Speaking of hurricanes… In 2008 two significant hurricanes affected oil and natural gas production: Gustav, which made landfall in Cocodrie, Louisiana, on September 1; and Ike, which hit Galveston, Texas, on September 13. Both of these hurricanes caused considerable damage and led to an average 1.1 million barrels per day (bbl/d) of shut-in crude oil production in September, according to EIA calculations. In 2012 a third hurricane, Isaac (Category 1 hurricane), made landfall on August 28. On that day, shut-in production totaled 1.3 million bbl/d. However, during the following week, the shut-in capacity came back on line.
Finishing this part of today‘s Update, please note that yesterday oil and gas production in the U.S. Gulf of Mexico was starting to ramp up toward normal after Tropical Storm Karen lost potency off the Gulf Coast, officials cancelled evacuation orders, and energy companies started to restaff offshore platforms.
Having discussed major factors which had an impact on crude oil in the previous week, let’s now move on to the technical part of this week‘s Oil Investment Update and focus on the technical changes in the crude oil market. Just like a week ago, we take a look at the charts in different time horizons to have a more complete picture of the current situation in the oil market.
Let’s start with a look at the monthly chart of light crude (charts courtesy by http://stockcharts.com).
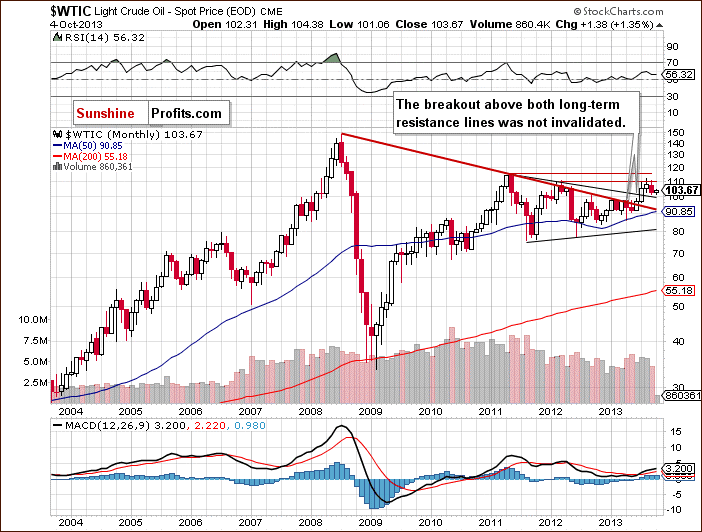
The situation in the long-term chart hasn’t changed much recently and most of what we wrote in our last Oil Investment Update is still up-to-date today.
(…) light crude still remains above the two long-term declining resistance lines: one of them (bold red line) is based on the July 2008 and the May 2011 highs, and the second one is based on the September 2012 and March 2013 highs (the upper black line).
From this perspective the picture is bullish and the breakout above these two long-term declining resistance lines hasn’t been invalidated.
Now, let’s zoom in on our picture of the oil market and see the weekly chart.
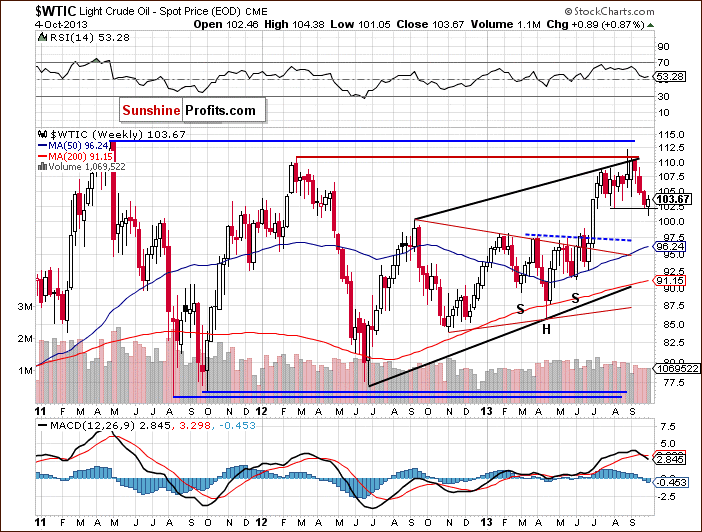
Looking at the above chart, we see that the price of crude oil declined once again in the previous week and dropped below the Aug. 5 low. In this way, light crude slipped to a new monthly low of $101.05. In spite of this downward move, oil bulls didn’t give up and pushed the price higher, which resulted in an increase above the August low.
Crude oil still remains in the upper part of the rising trend channel, but a new September low right before our eyes just doesn’t look too bullish. Therefore, from this point of view, the situation is still mixed.
Now, let’s check the short-term outlook.
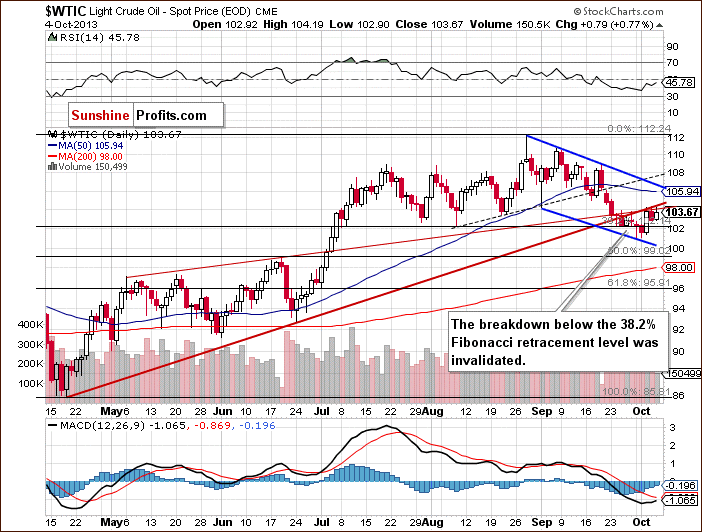
On the above chart, we see that the situation has slightly improved since our last Oil Investment Update was published. Last Monday, crude oil dropped to a new monthly low of $101.05 per barrel. With this move the price of crude oil declined not only below the August low, but also below the 38.2% Fibonacci retracement level. Despite this drop, we saw a pullback, which erased most of the losses late in the day.
In the following days, we saw further improvements as oil bulls managed to hold this level. This positive event triggered another pullback, which pushed light crude to the previously-broken rising medium-term support line on Wednesday. Additionally, the price of light crude came back above the 38.2% Fibonacci retracement level and the breakdown below this level was invalidated. Although crude oil closed Wednesday almost at the rising medium-term support/resistance line, buyers didn’t have enough strength to break above this resistance until the end of the previous week.
Looking at the above chart, we see that crude oil remains in the declining trend channel. Therefore, if we see a breakout above the medium-term support/resistance line, we could see a move up to the declining short-term resistance line based on the Aug. 28 and Sept. 19 highs – currently close to the $106.4 level (marked with blue).
Please note that the nearest support is the September low and the 38.2% Fibonacci retracement level. If it is broken, the next one support zone will be slightly below $100 per barrel where the 50% Fibonacci retracement level intersects with the June high.
Summing up, although there was a downward move in the previous week, which took the price of light crude to a new monthly low, technically, the situation hasn’t changed much. As long as crude oil remains above the 38.2% Fibonacci retracement level the uptrend is not threatened.
Once we know the current outlook for crude oil, let’s examine the NYSE Arca Oil Index (XOI) to find out what the current outlook for the oil stocks is and to check if they confirm or invalidate the above analysis of the crude oil market.
Oil Stocks
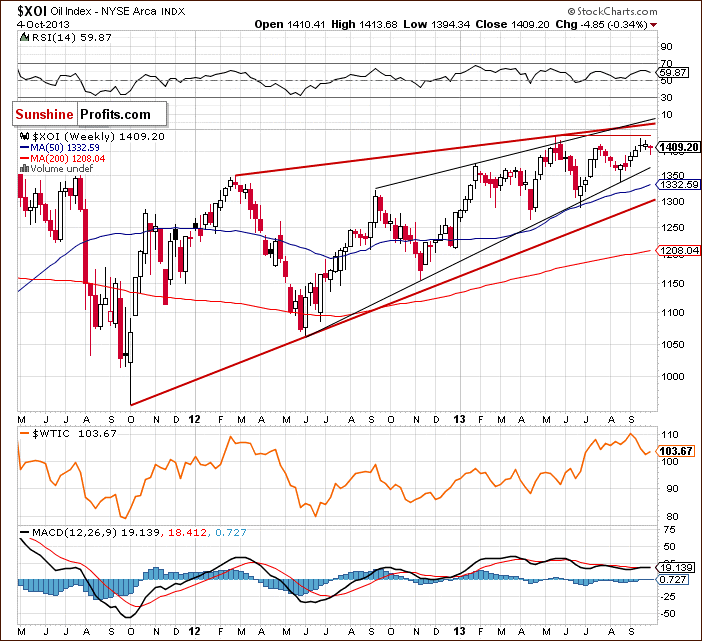
We begin with the long-term chart.
In our previous Oil Investment Update we wrote:
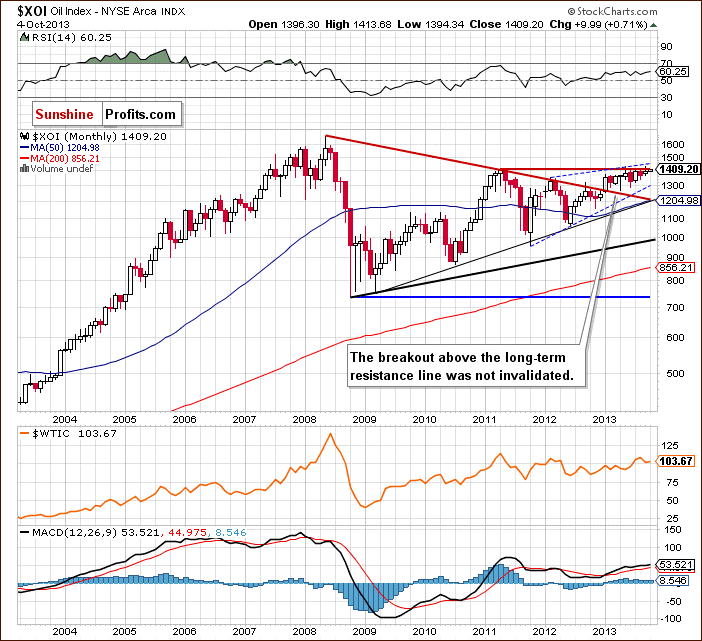
The XOI not only broke above the July top, but it also broke above the May 2011 high. If the buyers hold the oil index above 1,400 today, this will be the highest monthly close since June 2008.
Although oil bulls didn’t manage to hold the XOI above 1,400, we saw the highest monthly close since April 2011. Additionally, the XOI is still above the previously-broken long-term declining resistance line based on the 2008 and 2011 highs and the breakout hasn’t been invalidated. The oil index also remains in the range of the rising trend channel.
Taking these observations into account, the situation is still bullish.
To see this more clearly, let’s zoom in on our picture and move on to the weekly chart.
Looking at the above chart, we see that the oil stock index remains above the July peak (in terms of weekly closing prices) and the breakout is confirmed at the moment. Keep in mind that the XOI is still close to the May top.
Quoting from our previous Oil Investment Update:
(...) we should carefully keep an eye on the oil index. The proximity of the above resistance level may encourage oil bears to go short and trigger a correction. In this case, the first support will be around 1,400.
In the previous week we saw such price action and the XOI dropped to a weekly low at 1,394. However, this deterioration was only temporary and the oil index closed the whole week above 1,400 once again.
Please note that the current corrective move is similar to the previous one, which we saw at the end of August. Therefore, from this point of view, the medium-term uptrend is not currently threatened, and the situation remains bullish. It’s worth noting that even if the buyers manage to push the XOI higher, further increases may be restrained by the upper line of the rising wedge (currently close to 1,450).
At this point, we’ll focus on the relationship between light crude and the oil stocks.
When we take a look at the above charts and compare the price action in both cases, it seems that oil stocks were weaker, because they closed lower for a first time in five weeks (at the same time, light crude closed higher for a first time in four weeks). However, when we take a closer look at the situation in both cases, we notice that this weakness in oil stocks is only apparent. They still remain above the July peak (in terms of weekly closing prices) and the medium-term declining support/resistance line. Meanwhile, crude oil is still trading below its medium-term rising support/resistance line.
Now, let’s turn to the daily chart.
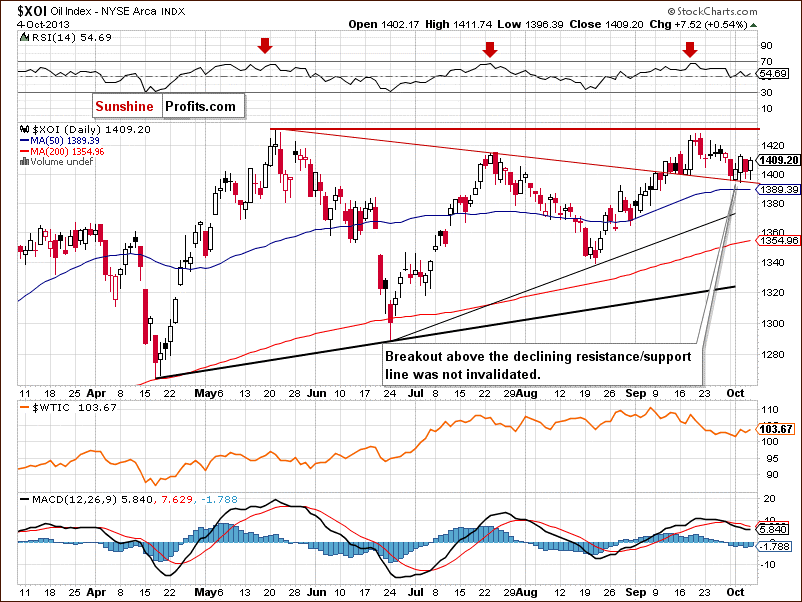
On the above chart we see that the situation didn’t change much in the previous week.
Although the sellers pushed the XOI below 1,400, the declining resistance/support line based on the May and July highs stopped further declines and the oil stock index came back above this level. As you see on the daily chart, the oil stock index remains in the consolidation range. If the buyers manage to push the XOI above the Wednesday high, we will likely see another upward move to at least the September or even to the May high.
Please note that the nearest support is the October low at 1,394. The second one is the declining resistance/support line, which currently reinforces this level, the next one is the 50-day moving average (currently at 1,389.39). Going even lower, we have a support zone based on the Aug. 27 and Aug. 30 lows (1,361-1,364), and a further one based on the Aug. 21 bottom and the 61.8% retracement level (1,338-1,339).
Now, let’s comment on the relationship between the WTI and the XOI in the short term. This time, we saw similar price action in light crude and the oil stocks. Last Monday there were declines, however, in case of crude oil the downward move was stronger and took it to a new monthly low. On Wednesday, we saw a sharp rebound in both cases and the rest of the week looked similar.
Summing up, from the long-, medium- and short-term perspectives the outlook for oil stocks remains bullish and the uptrend is not threatened at the moment. Taking into account the relationship between light crude and the oil stock index in the previous week, we can conclude that the oil stocks still remain stronger in relation to crude oil, even though they closed lower for the first time since the end of August.
Speaking of relationships, let’s take a closer look at the chart below and check the link between crude oil and gold. Let’s examine the daily chart.
Crude Oil – Gold Link
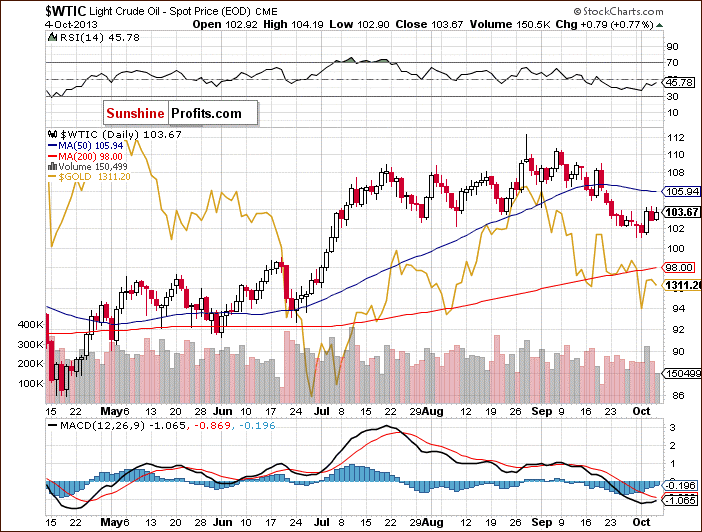
Looking at the above chart, we see similar price action in both commodities at the beginning of the previous week. They declined on Monday, however, in the case of crude oil, buyers managed to hold the September low in the following days, which resulted in a sharp pullback on Wednesday. Meanwhile, gold declined and reached its new lowest level since the August top. Despite this drop, the rest of the week looked similar for both commodities.
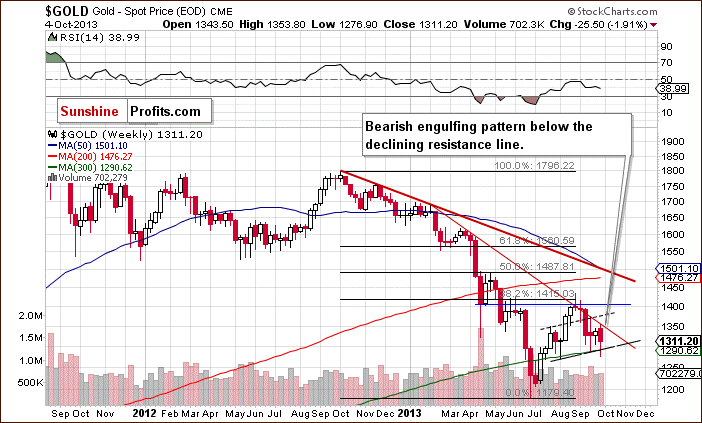
It’s worth examining the medium-term outlook for gold. Let’s turn to its weekly chart.
Quoting our previous Oil Investment Update:
(...) gold still remains below the declining resistance line (based on the October 2012 and February highs), which successfully stopped growths earlier this month. Although there were three breakouts above this line, they all failed and the price of the yellow metal dropped below this line. If history repeats itself, we may see another unsuccessful attempt to move above this line in the coming week.
As you see on the above chart, in the previous week the declining resistance line stopped a move up once again. Gold bears quickly noticed the opportunity to go short and triggered a corrective move, which pushed the yellow metal below $1,300 an ounce. At this point, it’s worth mentioning that with this move gold completed the head and shoulders pattern and went down below the neck level. However, the deterioration was only temporary and the shiny metal rebounded, which resulted in the invalidation of this breakdown. The invalidation by itself is a bullish signal, so further strength in the short term would not surprise us.
Nonetheless, keep in mind that the declining resistance line (based on the October 2012 and February highs) may stop further growth in the coming week once again.
From this point of view, it seems that the space for another upward move is quite limited. At this point, it’s worth noting that even if gold continues its rally and moves close to the dashed line (currently close to $1,378) or even to $1,400, the medium-term outlook will remain bearish.
Summary
Although the oil stock index closed lower for a first time in five weeks, it still remains stronger than crude oil itself. The oil stocks are trading above the July peak (in terms of weekly closing prices) and the medium-term declining support/resistance line. Meanwhile, crude oil still remains below its medium-term rising support/resistance line. Additionally, light crude is trading in the declining trend channel. Therefore, even if we see a breakout above the medium-term support/resistance line, an upward move may be limited by the declining short-term resistance line based on Aug. 28 and Sept. 19 highs – currently close to the $106.4 level (marked with blue).
Looking at the relationship between crude oil and gold, we notice similar price action in both commodities in the previous week. Therefore, if this relationship remains in place,
we could see some strength on a short-term basis in case of the yellow metal and crude oil. However, we should still keep in mind that the recent decline in crude oil is just slightly bigger than the previous ones and light crude remains above the 38.2% Fibonacci retracement level, which forms strong support. From this point of view, the uptrend is not threatened at the moment. At the same time, the downtrend in gold remains in place and the yellow metal remains below the declining resistance line which has already successfully stopped buyers several times.
Very short-term outlook: bearish
Short-term outlook: mixed
MT outlook: mixed
LT outlook: bullish
Trading position (short-term): We do not suggest opening any positions yet. If we see a confirmed breakout above the medium-term rising support/resistance line (in this case one daily close would serve as a confirmation), we will likely open speculative long positions. Until such a breakout is seen, long positions don’t seem to be worth the risk, as any resulting rallies are likely to be stopped by the declining short-term resistance line based on the Aug. 28 and Sept. 19 highs.
Naturally, if we see a breakdown below the lower border of the declining trend channel (based on Sept. 3 and Sept. 30 lows), we will consider opening speculative short positions.
We will keep you informed should anything change, or should we see a confirmation/invalidation of the above.
This completes this week’s Oil Investment Update. Our next Oil Investment Update is scheduled for Monday, Oct. 14, 2013. Oil Trading Alerts subscribers will additionally receive similar but shorter alerts on a daily basis (or more than once a day when the situation requires it).
Thank you.
Nadia Simmons

