

Briefly: in our opinion, full (300% of the regular position size) speculative short positions in junior mining stocks are justified from the risk/reward point of view at the moment of publishing this Alert.
In yesterday’s analysis, I wrote that it could be the case that the sharp corrective rally is over, and indeed, the daily streak of rallies was just broken. Still, before focusing on the technicals, let’s take a look at the fundamentals.
A Reversal of Fortunes
While gold, silver, mining stocks and the S&P 500 bounced off their intraday lows, all four ended the Oct. 5 session in the red. Moreover, with the USD Index and the U.S. 10-Year real yield rallying sharply, a reversal of fortunes unfolded as reality re-emerged.
Please see below:
 Source: Bloomberg/ZeroHedge
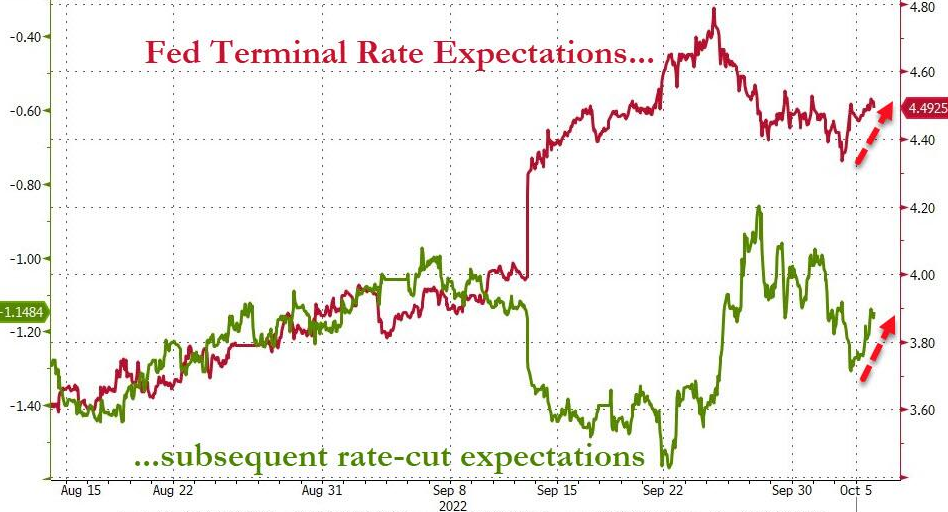
To explain, the red line above tracks the number of rate hikes priced in by the futures market, while the green line above tracks the inverted (down means up) number of rate cuts priced in thereafter.
If you analyze the right side of the chart, you can see that hike expectations decreased and cut expectations increased as the Fed pivot narrative gained steam. However, the far right side of the chart shows how hike expectations increased while cut expectations decreased over the last two days. Therefore, pivot prognostications are slowly fading, and a continuation of the trend is profoundly bearish for the PMs.
To that point, I’ve noted how Fed officials are united in their calls for a higher U.S. federal funds rate (FFR); and with more hawkish warnings hitting the wire on Oct. 5, officials continue to hammer home their message.
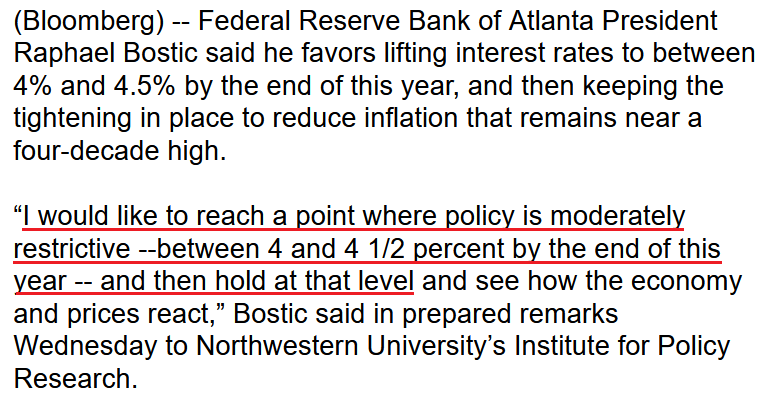
For example, Atlanta Fed President Raphael Bostic said on Oct. 5:
“The past couple of monthly inflation prints produced a mixed bag, with some evidence that the pace of month-to-month price increases has slowed. But the August inflation reports were a sobering reminder that price pressures remain broad and stubborn.”
He added:
“We should not let the emergence of [economic] weakness deter our push to lower inflation. We must remain vigilant because this inflation battle is likely still in early days.”
More importantly:
“I am not advocating a quick turn toward accommodation. On the contrary. You no doubt are aware of considerable speculation already that the Fed could begin lowering rates in 2023 if economic activity slows and the rate of inflation starts to fall. I would say: not so fast.”
Thus, with Bostic openly destroying the pivot narrative, it’s another example of how Fed officials remain unwavering in their fight against inflation.
No wonder – inflation is what the voters are most concerned with.
Please see below:
 Source: Bloomberg
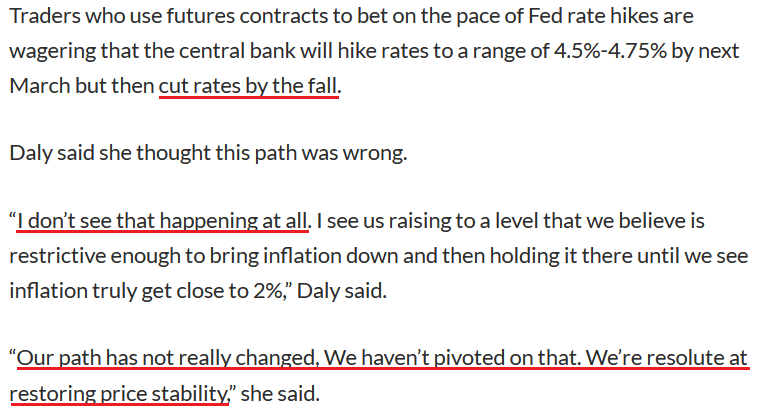
Echoing that message, San Francisco Fed President Mary Daly said on Oct. 5:
“The American people need confidence that we’re resolute.” If core inflation rises while employment cools, “well, that’s not very comforting to the American people, and I think then that the downshifting on the tightening would be a much harder decision to make.”
She added:
“I do see more rate increases as necessary. Remember, this is all about bringing demand – which is very strong – back in line with supply and bringing inflation down.”
Furthermore, she also went out of her way to quash the pivot narrative:
Please see below:
 Source: MarketWatch
Thus, with the post-GFC crowd dealt another blow on Oct. 5, I’ve warned for months that as long as inflation and employment remain elevated, the Fed will keep its foot on the hawkish accelerator. In addition, it’s laughable to assume that initial declines in the Consumer Price Index (CPI) and JOLTS job openings signal the all-clear. In contrast, those metrics need to decline substantially to declare victory.
To that point, I wrote on Oct. 5 that while the pivot predictors gain confidence, the latest iteration is no different than their previously poor forecasts. As such, with Fed officials providing another reality check, gold, silver, mining stocks, and the S&P 500 should feel the pain over the medium term.
No Pivot: Part 2
With inflation well above the Fed’s 2% target and the U.S. labor market still on solid footing, the latter needs to collapse for the Fed to retreat from its inflation fight. Moreover, with the Institute for Supply Management (ISM) and S&P Global’s Services PMIs showing that we’re nowhere near that point, the FFR still has plenty of room to run.
For example, the ISM’s headline index decreased from 56.9 in August to 56.7 in September. However, the report revealed:
“Employment activity in the services sector grew in September for the second consecutive month after two previous months of contraction. ISM’s Employment Index registered 53 percent, up 2.8 percentage points from the August reading of 50.2 percent.
“Comments from respondents include: ‘organizational growth continues, although hiring continues to be a challenge’ and ‘cannot find qualified applicants; they require greater incentives because they have choices.’”
As a result, with demand still outweighing supply in the U.S. labor market, the Fed pivot predictors are materially out of touch with reality.
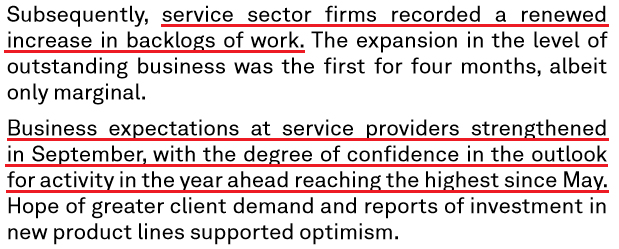
As further evidence, S&P Global’s U.S. Services PMI increased from 43.7 in August to 49.3 in September. The report stated:
“September data indicated only a modest rise in employment at service providers. The rate of job creation was the slowest since December 2021, as firms stated that challenges hiring new staff and difficulties offering high wages to retain certain employees hampered efforts to expand workforce numbers.”
Therefore, while input and output inflation slowed in both reports, employment is still increasing. Remember, "a modest rise in employment" is profoundly hawkish because the Fed needs a higher unemployment rate to cool wage inflation. As such, if firms are still increasing their headcount, demand destruction has not materialized, and the resiliency gives the Fed the green light to hammer inflation.
On top of that, S&P Global's service sector report showed that 12-month business confidence rose to its highest level since May, and the optimism is bullish for Fed policy.
Please see below:
 Source: S&P Global
Also supportive, ADP released its private payrolls report on Oct. 5. For context, it doesn’t correlate well with U.S. nonfarm payrolls (which are released on Oct. 7). However, the results outperformed expectations and highlight the strength of the U.S. labor market.
Please see below:
 Source: Investing.com
To that point, Nela Richardson, Chief Economist at ADP, said:
“There are signs that people are returning to the labor market. We're in an interim period where we're going to continue to see steady job gains. Employer demand remains robust, and the supply of workers is improving, for now.”
Furthermore, ADP’s wage inflation data shows why the pivot crowd is living in la-la land.
Please see below:
 Source: ADP
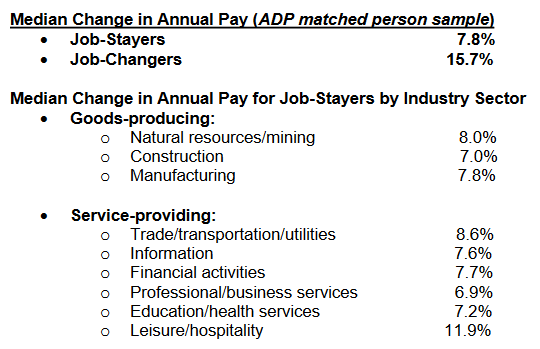
To explain, the figures above highlight the median percentage change in Americans’ annual pay, according to ADP. If you analyze the first two bullet points, you can see that job-stayers and job-changers enjoyed median annual wage increases of 7.8% and 15.7%, respectively.
Thus, while I’ve been warning for months that demand was much more resilient than the consensus realized, is it realistic for the CPI to decline to 2% if wages are running at ~8% plus? Of course not. The Fed needs these figures to decrease dramatically for the wage-price spiral to unwind. However, we’re not even close.
In addition, notice how all of the industries tracked by ADP have realized wage inflation of ~7% or more? As a result, the consensus misses the critical point: peak inflation is irrelevant, and the final destination of the FFR is what matters. Therefore, even if input, output, and wage inflation have peaked, reducing them to 2% requires much more economic weakness than the bulls realize.
The Bottom Line
With the USD Index and the U.S. 10-Year real yield resuming their uptrends on Oct. 5, the PMs headed in the opposite direction. Moreover, with Fed officials intentionally pushing back against the pivot narrative, investors are buying hope and selling reality. However, with 2021 and 2022 proving it's a losing strategy, the dip buyers should suffer mightily over the medium term. As such, while the unwinding of bearish bets may keep them supported in the short term, gold, silver, mining stocks, and the S&P 500 should hit lower lows in the months ahead.
In conclusion, the PMs declined on Oct. 5, as risk assets were under pressure. However, the dip buyers were active throughout the day, as the pivot camp has more than a few believers. So, while a consolidation period may ensue until the next catalyst emerges, the bear market is likely far from over. Still, it could be the case that the rally has already burned itself out and that lower precious metals values are just around the corner.
Technically Speaking
In Tuesday’s analysis, I wrote the following about gold:
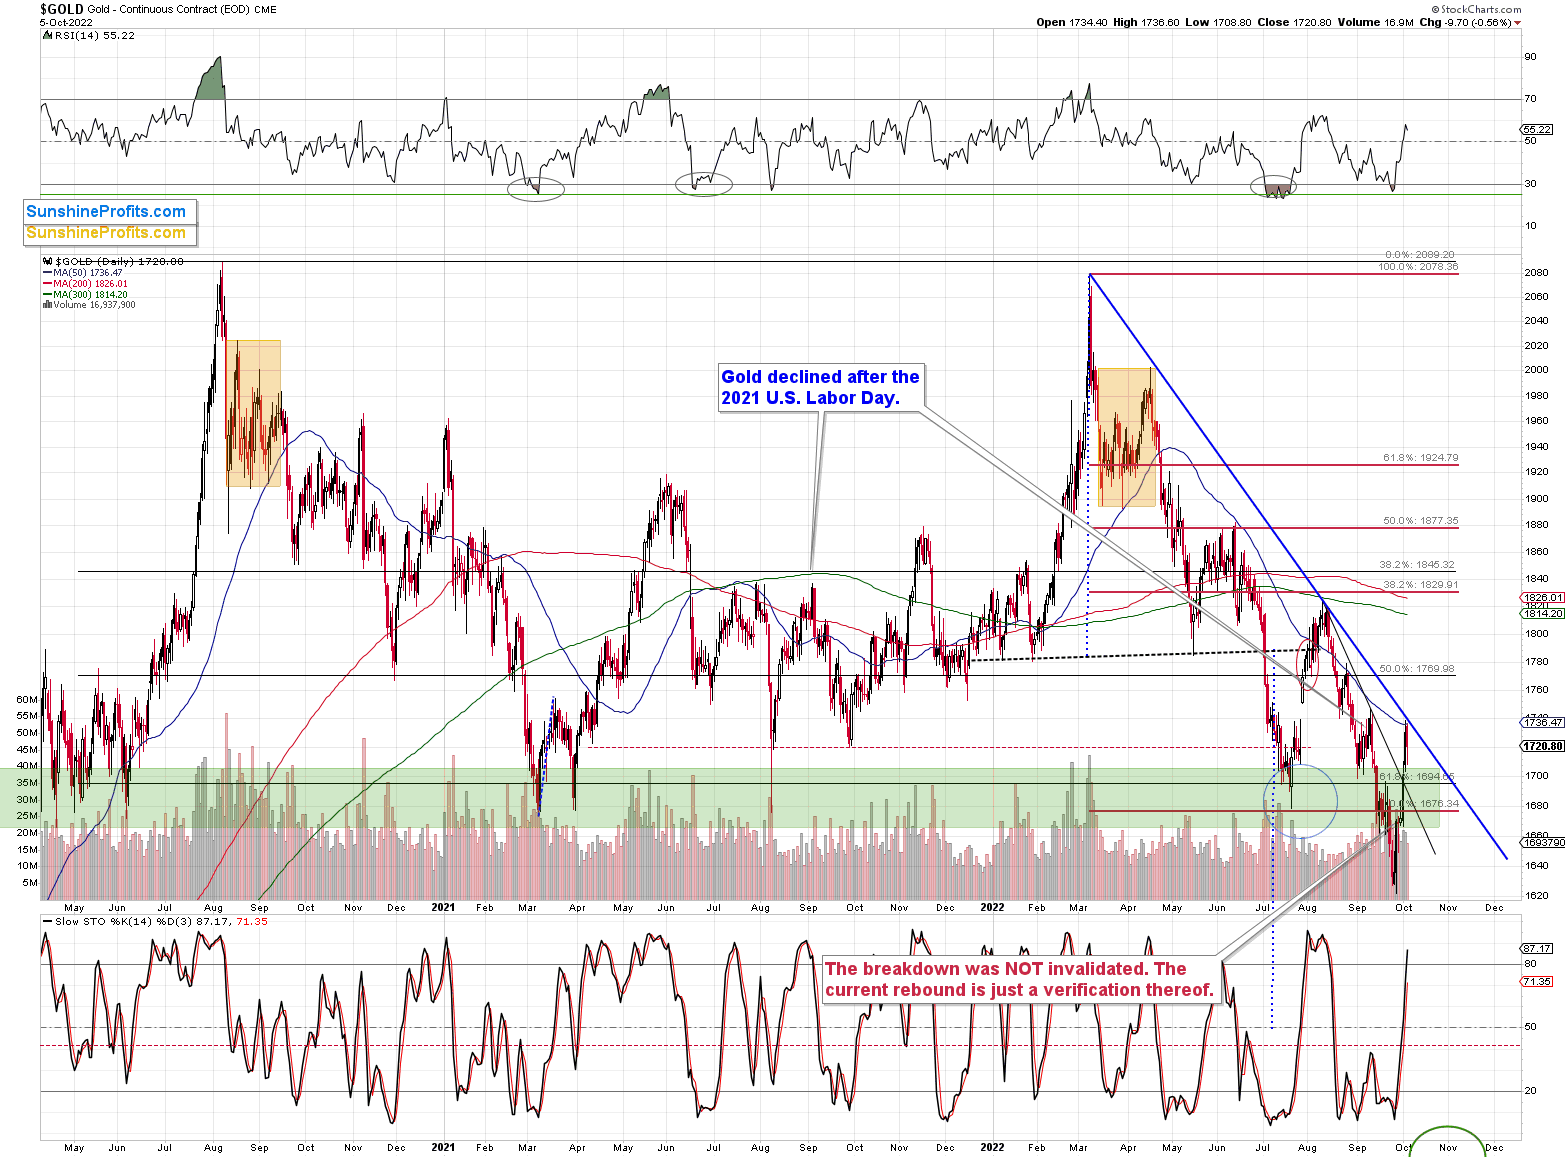
Gold is now slightly above $1,700 (gold futures are trading at $1,718 at the moment of writing these words). There’s very strong resistance just $20 higher – at about $1,740 – the previous high and the declining blue resistance line based on the March and August 2022 highs.
Gold might reverse right away because it’s in the resistance zone and the breakdown below this zone was already confirmed. However, if it first soars to $1,740 and declines only after that, it won’t really change much from the medium-term point of view.
Yesterday, I added:
Indeed, gold moved to (almost) the $1,740 level – the declining resistance line and the 50-day moving average, then it declined a bit. It also declined some more in today’s pre-market trading – at the moment of writing these words, gold futures are trading at $1,720, which means that they are pretty much right where they were when I wrote the above-quoted text.
Did the rally burn itself out? It’s quite possible.
Gold futures ended the day at about $1,721, so the above remained up-to-date. There was no breakout above the 50-day moving average and the declining blue resistance line.
Consequently, the medium-term remains clearly bearish.
My comments on the situation being just like in 2013 remain up-to-date as well:
“Wasn’t the rally too big to call it just a correction?”
Well, please consider the context. Here’s gold’s long-term picture.
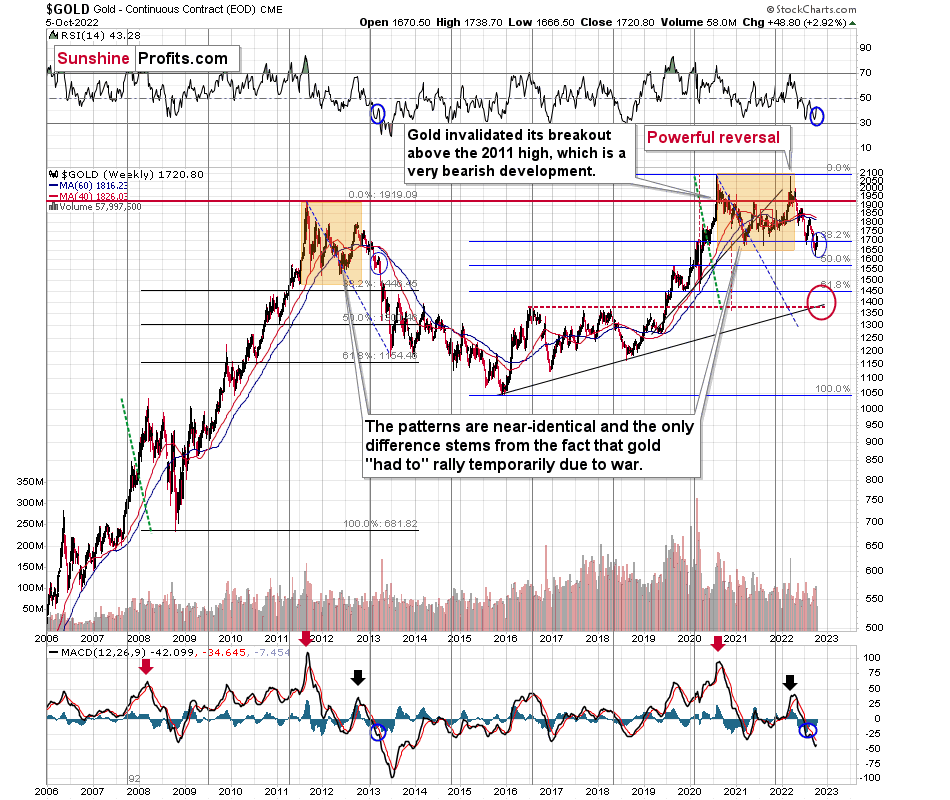
In short, the link to 2013 remains intact, which means that the recent move wasn’t too big.
Besides, please note that during one of the biggest declines in gold – in 2008 – gold’s sharp corrective upswing was much bigger, and it was still followed by an even bigger decline.
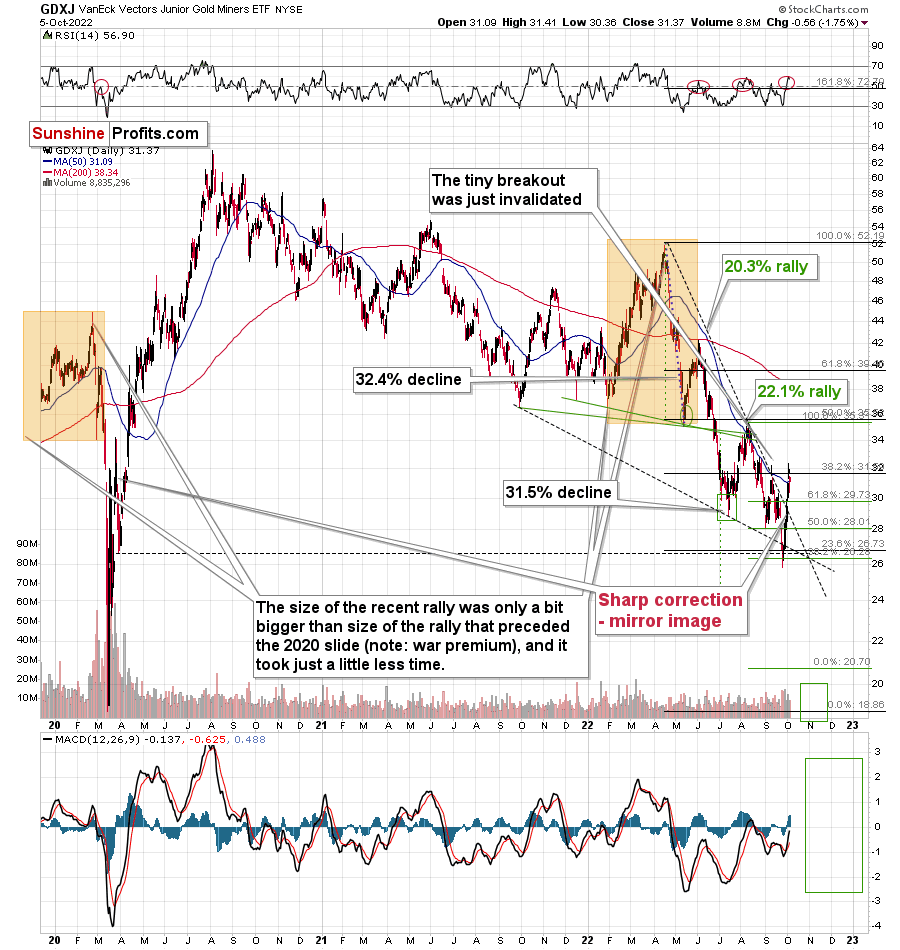
The GDXJ sold off a bit, and we saw a small move lower in the RSI indicator as well. This is rather normal behavior given that we just saw a local top.
Prices don’t have to slide profoundly on the very next day after the top, there could be some sideways trading beforehand. For example, that’s what happened in August 2022. The decline’s pace picked up shortly, though.
In other words, my Tuesday’s comments on the above chart remain up-to-date:
That’s the fourth attempt of the GDXJ to break above its 50-day moving average (marked in blue). All previous cases failed, and in all previous cases the rally taking prices to this MA were sharp.
Is this time different? That’s unlikely, as the fundamentals (as explained earlier today) haven’t changed.
Additionally, please note that the RSI just jumped above 50, and ever since the April 2022 top, these levels in the RSI meant that local tops were in. I marked that with red ellipses in the upper part of the chart.
There’s also one additional factor explaining why this counter-trend bounce might be so volatile – that’s because the mirror image of this decline – the 2020 rally – also features a sharp correction around those price levels.
This time, the correction doesn’t have to be as big as the move that led to it was not as sharp.
Now, as you may recall, I previously had a downside target of about $26, but I ended up resigning from it. I continue to think that this decision was justified from the risk to reward point of view (given the data that we had available at that time), as there were previously corrective upswings, and it was not a no-brainer that we’re going to see a rebound also one more time.
However, as geopolitics came into play this time, the counter-trend rally has indeed materialized. Since it doesn’t make much sense to try to predict those near-term geopolitical events – the world is too unpredictable, it’s better to focus on the part of the picture where we can actually gain an extra edge over other market participants. That is recognizing trends and tendencies. Once the very short-term dust settles, the markets are likely to get back to their previous trends and surprise those who assume that short-term geopolitical events have a lasting impact on the markets. They don’t. If that was the case, gold would be above $2,000 at this time, as that’ where it soared based on the Russian invasion. Well, the war didn’t end, and yet gold is at about $1,700.
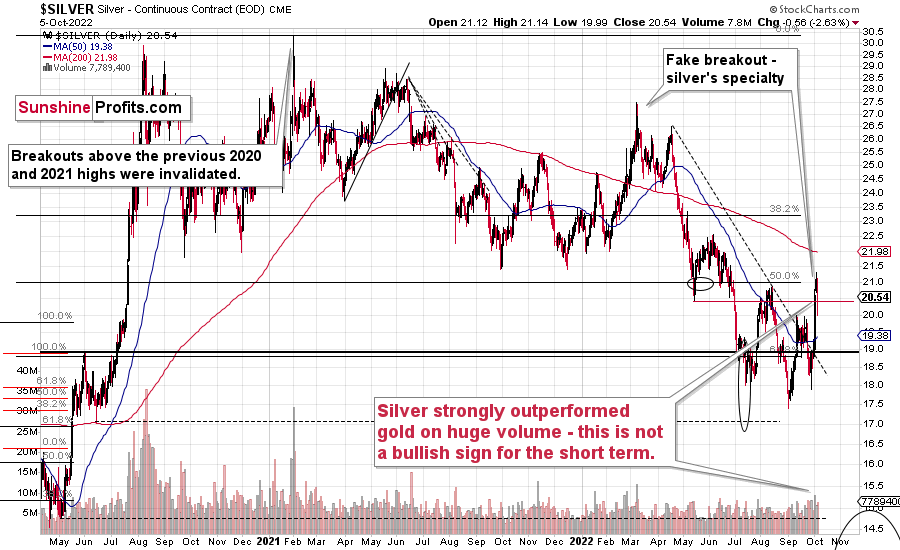
In Monday’s intraday Alert, I wrote the following about silver’s outperformance:
“The precious metals market moved higher today, and I just received the following question:
“What is happening with silver?”
The thing is that silver soared in a major way today, gaining about $1.5. It moved above its September 2022 high, and almost touched its August high.
The GDXJ did move above $30 (it has yet to close above it, though), and gold moved a bit above its late-September highs, and the downtrend in both markets remains visibly intact.
However, silver soared. What gives?
Those, who have been following my analyses for some time likely know what this means. It means that the current move up is likely fake. Silver tends to outperform gold in a major, yet brief way, right at the end of a given upswing, or close to it.
That’s exactly what we see today.
The S&P 500 futures are up today, but let’s not forget that they broke to new yearly lows in weekly terms. Therefore, it would take more than a daily rally to invalidate this bearish indication. Do you remember the Sep. 28 session, where stocks “invalidated” the breakdown to new lows? Well, it was followed by another slide. Since Friday’s breakdown was more important (weekly!), it seems that the bearish forces are likely to return shortly this time as well. And with them, lower gold, silver, and mining stock values.
All in all, the very bearish outlook for the following weeks/months remains intact.”
Now, we know that silver’s daily rally was accompanied by one of the biggest volume readings that we’ve seen so far this year. This makes the above even more up-to-date.
The session with the highest volume was the 2022 top, by the way.
So, where do we go from here?
If you’d like a price prediction for the next three days, then I don’t think it’s possible for anyone to provide it. The markets are volatile and are focusing on pretty much random things at the moment. I described what the reality is, and I described what people choose to focus on instead. Emotions, not logic, drive these price moves. Consequently, we could theoretically use – as always – technical tools. However, with this kind of volatility, it’s possible that we get an immediate turnaround, but it’s also possible that the rally remains sharp for several hours – days, and we get a massive reversal only then.
Fortunately, we’re not in the day-trading business, and I haven’t written about short positions in silver, either (the price levels for silver and gold are only provided as some subscribers request that). This means that we can simply continue to focus on what’s much more predictable by using tools that don’t just randomly stop being useful.
The link to 2013 remains intact, and so does the very bearish outlook. When in doubt, or when things appear too hectic, and you want to drop the towel, give up, and run for the hills, take several deep breaths, and return to the long-term charts. Has anything major happened to them. No. So, whatever you see is most likely just short-term price noise.
Investing and trading are simple but not easy. This year has been extremely profitable so far, but no market can move up or down without corrections, and no position can grow more and more profitable each day – there have to be some corrections. The key thing is how one approaches those days. Will one allow short-term emotions to cloud their vision, or will one stand firm and in tune with the original strategy?
I can’t make any guarantees with regard to gold’s price performance or profitability, but I do think that this counter-trend upswing is just a very temporary phenomenon, and that the big downtrend remains intact. In my opinion, the short position in junior mining stocks remains justified from the risk to reward point of view, and I’m keeping my position intact. Of course, whatever you decide to do with your money is completely up to you – it’s your capital, after all.
Silver just invalidated the breakout above its August highs in terms of the closing prices.
That’s one of the reasons to support the scenario in which the precious metals market has already topped.
Of course, I can’t guarantee that this has indeed happened, and – as I emphasized earlier – I’m not even attempting to day-trade the current situation, as I don’t think that’s where the best risk/reward opportunity lies. In my view, the optimal risk-to-reward opportunity is to gain thanks to the huge, medium-term decline that’s in tune with what happened in 2013 and 2008. That’s what provided huge profits so far this year, and while I can’t promise anything, in my opinion, those profits are going to increase substantially before the year is over.
Before summarizing, let’s take a look at the USD Index.
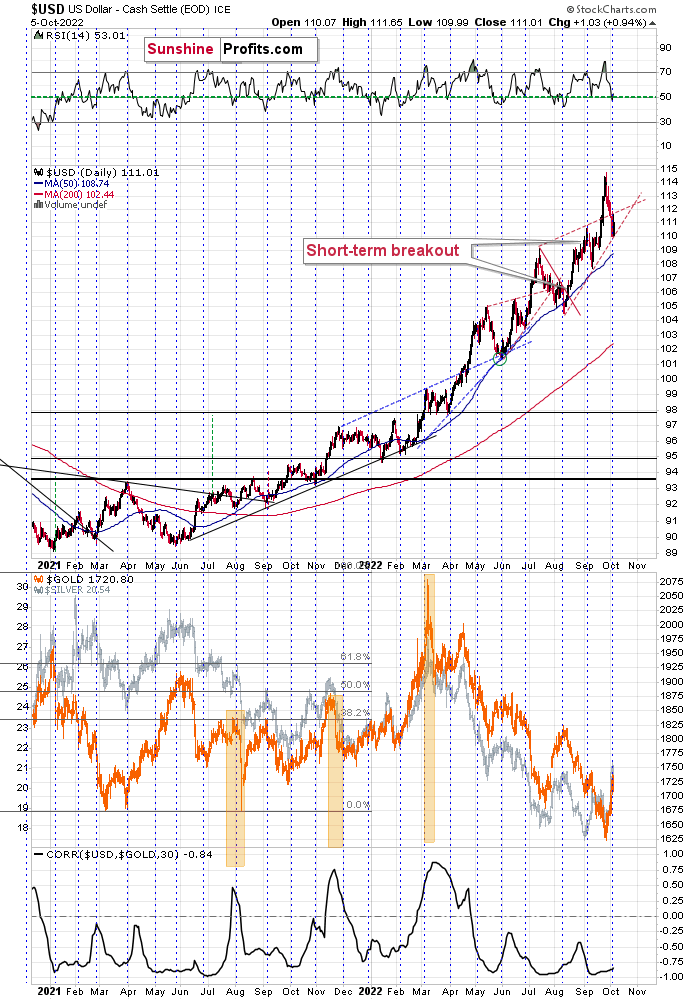
The USD Index moved below the upper border of its previous trading wedge, but it stopped at its lower border.
The RSI moved a bit below 50 and then it moved back above it.
Throughout 2022, the above – especially when it happened close to the turn of the month – corresponded to local lows. It was either right at those lows or close to them.
Given the strongly negative correlation between gold and the USD Index, it seems that both corrections, in the USDX and in gold, could already be over.
Still, there were times when the RSI based on the USDX moved even slightly lower before the bottom was in, so I wouldn’t rule out a move to 109 or so before the final bottom takes place.
In all cases, I don’t think that the USD Index would be likely to decline even more profoundly – for example, to 105 or lower.
The implications for the precious metals are very bearish for the medium and short term, and unclear with regard to the immediate term (next several hours – next few days).
Overview of the Upcoming Part of the Decline
- It seems to me that the corrective upswing is over or about to be over after an additional – very brief – rally, and that the next big move lower is already underway.
- If we see a situation where miners slide in a meaningful and volatile way while silver doesn’t (it just declines moderately), I plan to – once again – switch from short positions in miners to short positions in silver. At this time, it’s too early to say at what price levels this could take place and if we get this kind of opportunity at all – perhaps with gold prices close to $1,600.
- I plan to switch from the short positions in junior mining stocks or silver (whichever I’ll have at that moment) to long positions in junior mining stocks when gold / mining stocks move to their 2020 lows (approximately). While I’m probably not going to write about it at this stage yet, this is when some investors might consider getting back in with their long-term investing capital (or perhaps 1/3 or 1/2 thereof).
- I plan to return to short positions in junior mining stocks after a rebound – and the rebound could take gold from about $1,450 to about $1,550, and it could take the GDXJ from about $20 to about $24.
- I plan to exit all remaining short positions once gold shows substantial strength relative to the USD Index while the latter is still rallying. This may be the case with gold prices close to $1,400 and GDXJ close to $15 . This moment (when gold performs very strongly against the rallying USD and miners are strong relative to gold after its substantial decline) is likely to be the best entry point for long-term investments, in my view. This can also happen with gold close to $1,400, but at the moment it’s too early to say with certainty.
- The above is based on the information available today, and it might change in the following days/weeks.
You will find my general overview of the outlook for gold on the chart below:
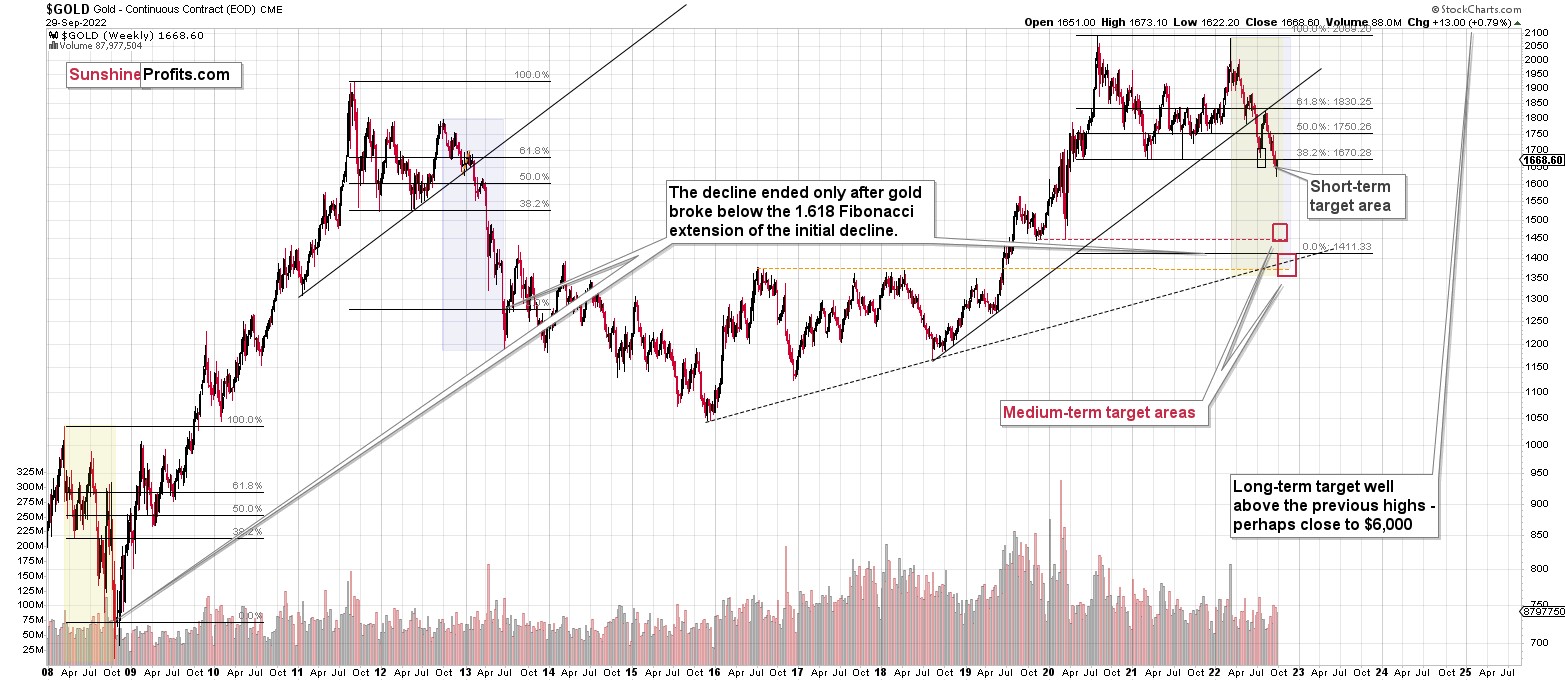
Please note that the above timing details are relatively broad and “for general overview only” – so that you know more or less what I think and how volatile I think the moves are likely to be – on an approximate basis. These time targets are not binding nor clear enough for me to think that they should be used for purchasing options, warrants, or similar instruments.
Letters to the Editor
Q: As others have written, I also respect your analysis and trust your reasoning. I’ve watched the various technical indicators with interest and note that the slow stochicistic graphs seem to have indicated a coming correction in gold, HUI, and GDXJ. But the slow stochisitcs graph for gold seems to have moved higher than the other two. I know you’ve written about the variability of the slow stochisitic graphs in terms of reliability. But given the rebound here from the low levels for gold, HUI, and GDXJ, and the accompanying moves in the stochastic graphs, have they indicated anything more definitive for this market?
Thanks again.
A: Thank you for your kind words, much appreciated.
Sometimes indicators work and sometimes they don’t. The key thing is to check if what we’re trying to apply right now worked in similar cases, and if it worked regularly.
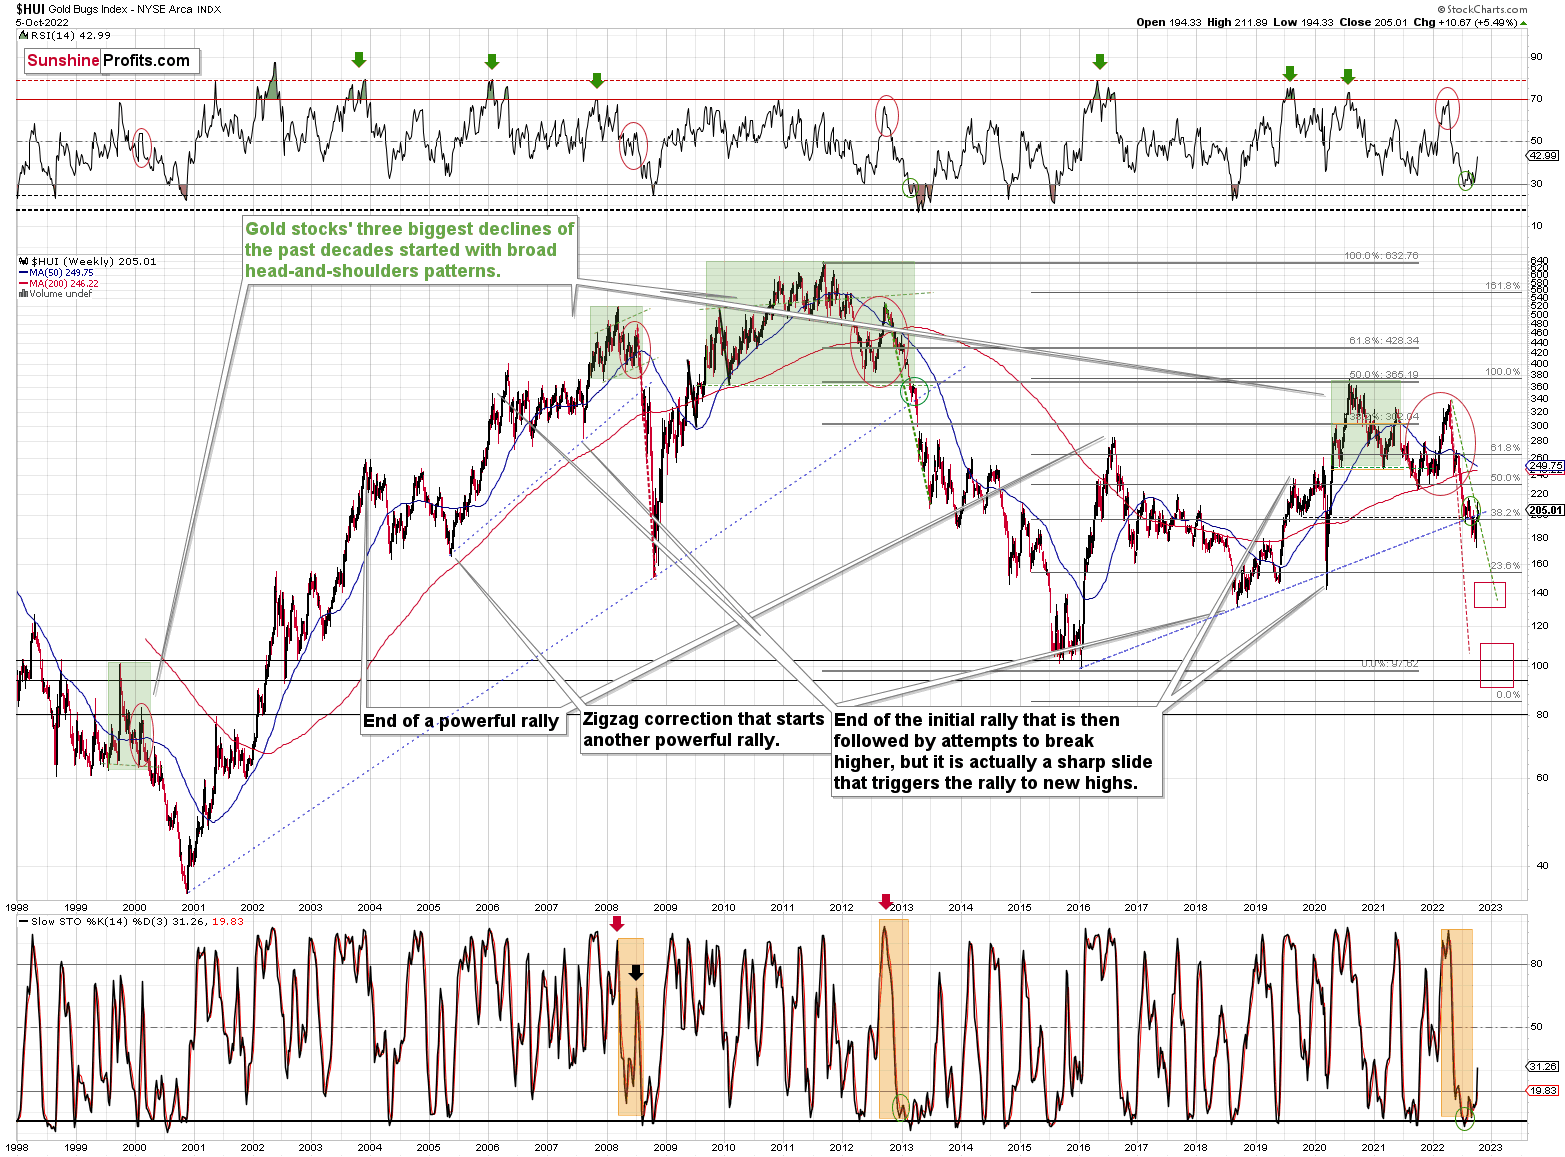
The key analogies in the case of the HUI Index (I’m using this chart as it has the most long-term scope) are to 2008 and 2013.
In 2008, there was a move higher in the stochastic that accompanied a sharp – but temporary – upswing that was then followed by a much bigger decline.
In 2013, there was a series of tiny upswings that didn’t really change anything.
Right now, we see something in between the above.
On multiple occasions, I wrote that the situation right now is somewhat similar to what we saw in 2013 (mostly), but it also has a 2008 vibe to it.
Even so, the pace at which gold stocks are declining is between both declines: the 2008 and 2013 ones. I marked this with dashed lines.
Please note the green, dashed line that starts at the late-2012 top and the one that starts at the 2022 top. Those lines are identical. You can see that back in 2012 and 2013, the HUI Index traded above this line. This time, it’s trading below it – gold stocks are declining faster.
Faster declines imply sharper corrections – as emotions get hotter.
So, does Stochastic’s performance indicate an even bigger rally here? Not necessarily.
Was the current rally very likely based on stochastic? Possible – yes, but very likely – no. The link to 2013 is still more visible and more important.
Summary
Summing up, it seems that the biggest part of the 2013-like decline is taking place right now, and – while I can’t make any promises regarding performance - it seems likely to me that our big profits are about to become huge, and then ridiculously big in the relatively near future.
As far as this quick corrective upswing is concerned, it seems that it might already be over (or about to be over).
The current quick upswing most likely doesn’t change anything. Fundamentals and technicals continue to point to lower precious metals values in the coming weeks / months. The current geopolitical news-based rally is likely to serve as nothing more than just a verification of the breakdown below the previous lows in gold.
Things might happen very fast in the coming days, and if I plan to make any adjustments, I’ll keep you informed. Still, if the targets that I’m mentioning in the “Trading” part of the summary are reached, I think that profits should be taken off the table without an additional confirmation from me. I will probably get on the long side of the market at that time, but I’ll send a confirmation if I decide to do so.
After the final sell-off (that takes gold to about $1,350-$1,500), I expect the precious metals to rally significantly. The final part of the decline might take as little as 1-5 weeks, so it's important to stay alert to any changes.
As always, we'll keep you – our subscribers – informed.
To summarize:
Trading capital (supplementary part of the portfolio; our opinion): Full speculative short positions (300% of the full position) in junior mining stocks are justified from the risk to reward point of view with the following binding exit profit-take price levels:
Mining stocks (price levels for the GDXJ ETF): binding profit-take exit price: $20.32; stop-loss: none (the volatility is too big to justify a stop-loss order in case of this particular trade)
Alternatively, if one seeks leverage, we’re providing the binding profit-take levels for the JDST (2x leveraged). The binding profit-take level for the JDST: $29.87; stop-loss for the JDST: none (the volatility is too big to justify a SL order in case of this particular trade).
For-your-information targets (our opinion; we continue to think that mining stocks are the preferred way of taking advantage of the upcoming price move, but if for whatever reason one wants / has to use silver or gold for this trade, we are providing the details anyway.):
Silver futures downside profit-take exit price: $12.32
SLV profit-take exit price: $11.32
ZSL profit-take exit price: $79.87
Gold futures downside profit-take exit price: $1,504
HGD.TO – alternative (Canadian) 2x inverse leveraged gold stocks ETF – the upside profit-take exit price: $19.87
HZD.TO – alternative (Canadian) 2x inverse leveraged silver ETF – the upside profit-take exit price: $49.87
Long-term capital (core part of the portfolio; our opinion): No positions (in other words: cash)
Insurance capital (core part of the portfolio; our opinion): Full position
Whether you’ve already subscribed or not, we encourage you to find out how to make the most of our alerts and read our replies to the most common alert-and-gold-trading-related-questions.
Please note that we describe the situation for the day that the alert is posted in the trading section. In other words, if we are writing about a speculative position, it means that it is up-to-date on the day it was posted. We are also featuring the initial target prices to decide whether keeping a position on a given day is in tune with your approach (some moves are too small for medium-term traders, and some might appear too big for day-traders).
Additionally, you might want to read why our stop-loss orders are usually relatively far from the current price.
Please note that a full position doesn't mean using all of the capital for a given trade. You will find details on our thoughts on gold portfolio structuring in the Key Insights section on our website.
As a reminder - "initial target price" means exactly that - an "initial" one. It's not a price level at which we suggest closing positions. If this becomes the case (as it did in the previous trade), we will refer to these levels as levels of exit orders (exactly as we've done previously). Stop-loss levels, however, are naturally not "initial", but something that, in our opinion, might be entered as an order.
Since it is impossible to synchronize target prices and stop-loss levels for all the ETFs and ETNs with the main markets that we provide these levels for (gold, silver and mining stocks - the GDX ETF), the stop-loss levels and target prices for other ETNs and ETF (among other: UGL, GLL, AGQ, ZSL, NUGT, DUST, JNUG, JDST) are provided as supplementary, and not as "final". This means that if a stop-loss or a target level is reached for any of the "additional instruments" (GLL for instance), but not for the "main instrument" (gold in this case), we will view positions in both gold and GLL as still open and the stop-loss for GLL would have to be moved lower. On the other hand, if gold moves to a stop-loss level but GLL doesn't, then we will view both positions (in gold and GLL) as closed. In other words, since it's not possible to be 100% certain that each related instrument moves to a given level when the underlying instrument does, we can't provide levels that would be binding. The levels that we do provide are our best estimate of the levels that will correspond to the levels in the underlying assets, but it will be the underlying assets that one will need to focus on regarding the signs pointing to closing a given position or keeping it open. We might adjust the levels in the "additional instruments" without adjusting the levels in the "main instruments", which will simply mean that we have improved our estimation of these levels, not that we changed our outlook on the markets. We are already working on a tool that would update these levels daily for the most popular ETFs, ETNs and individual mining stocks.
Our preferred ways to invest in and to trade gold along with the reasoning can be found in the how to buy gold section. Furthermore, our preferred ETFs and ETNs can be found in our Gold & Silver ETF Ranking.
As a reminder, Gold & Silver Trading Alerts are posted before or on each trading day (we usually post them before the opening bell, but we don't promise doing that each day). If there's anything urgent, we will send you an additional small alert before posting the main one.
Thank you.
Przemyslaw Radomski, CFA
Founder, Editor-in-chief

