

Briefly: in our opinion, full (300% of the regular position size) speculative short positions in junior mining stocks are justified from the risk/reward point of view at the moment of publishing this Alert. I’m moving the stop-loss levels a bit lower, so I’m effectively locking-in bigger profits while letting them grow even more.
In yesterday’s analysis, I wrote the following about gold’s breakdown:
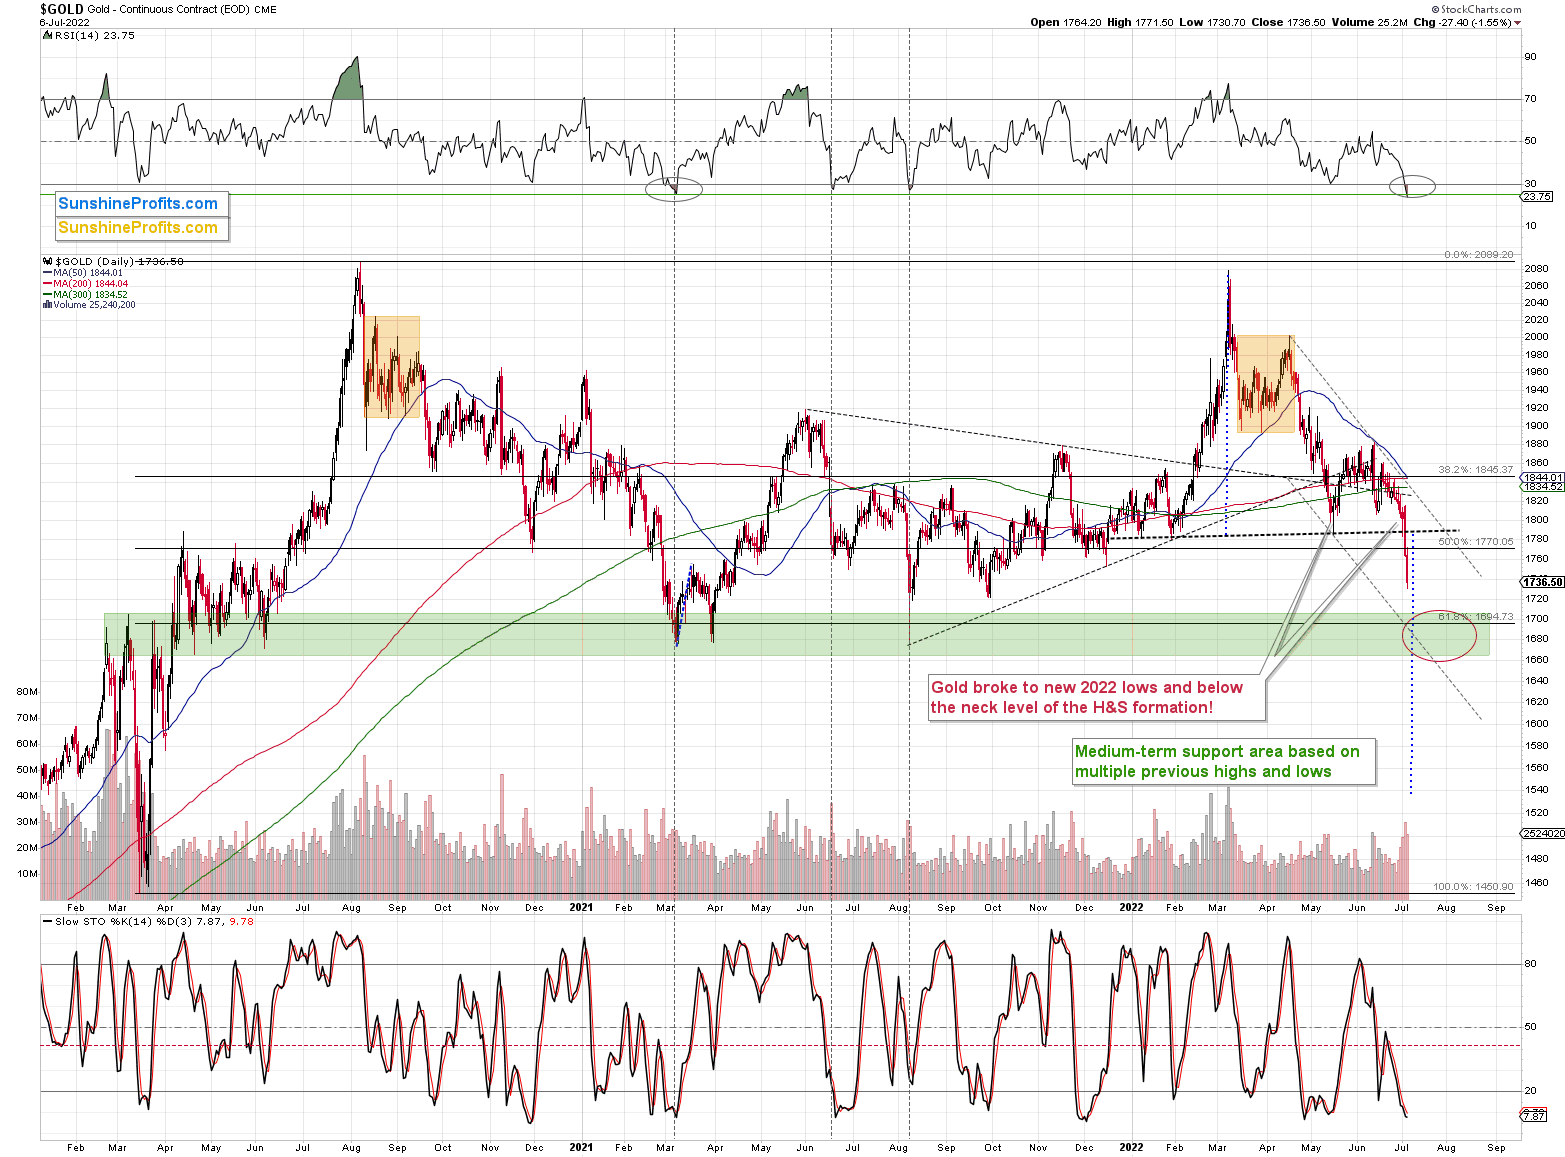
Gold just moved below the neck level of the previous head and shoulders pattern and also to new 2022 lows. The breakdown took place at a high volume, so it appears believable.
However, at the same time, the RSI moved below 30, which is a classic buy signal. I marked the previous similar signals with vertical dashed lines. In all three previous cases, gold was either bottoming or about to bottom.
In particular, the early-2021 situation appears similar, because the preceding price action is also similar. The failed attempt to rally above $2,000, the consolidation (marked with orange rectangles), and the subsequent decline that also included a consolidation are all present in both cases.
Back in 2021, gold continued to decline until it moved below $1,700, and while it doesn’t guarantee the same thing right now, the fact that both declines started from highs at very similar price levels makes it quite likely.
So, what’s likely to happen next? Well, I see two likely short-term outcomes:
- Gold corrects a bit, thus verifying the breakdown below the neck level of the H&S formation and the previous 2022 low, and it then continues to decline after the correction.
- Gold slides to or slightly below $1,700 right away - or almost right away, but quite possibly this week.
In the case of scenario 1, junior miners would be likely to correct slightly as well, and then slide.
In the case of scenario 2, junior miners would be likely to slide right away, possibly showing some kind of strength right before gold moves to its $1,700 target.
In both cases, I plan to keep the short positions intact until GDXJ or gold reaches its targets lower – I don’t plan to trade the rebound from scenario 1. Not all moves are worth trading, just like you’ll probably agree that Friday’s daily rally wasn’t worth trading. Those who attempted to trade it have probably missed or even were hurt by yesterday’s decline instead of profiting on it.
So far, scenario #2 is being realized. Yesterday, gold didn’t look back, and it declined sharply right away. It’s trading at about $1,740, so another ~$40-$60 decline would take it right into my target area.
It’s very likely that if gold gets there this week, we’ll then get a rebound in gold, silver, and mining stocks.
There is also a possibility that gold rebounds even before reaching this target – and that’s based on how low the RSI just moved.
The only time when the RSI was this low was at the March 2021 low, from which a quite sizable rally started. While I don’t think that the next corrective rally will be significant, I do think that it will be something visible – for example, a rally back to $1,790 or so (a correction to the previously broken neck level of the head and shoulders pattern).
Just because something is possible doesn’t make it the most likely outcome. It’s still most likely that gold will move a bit below $1,700 before bottoming. However, given how oversold on a short-term basis it is right now, it seems that gold would need to keep the bearish momentum going on an immediate-term basis if it was to slide against the mean-reversion tendency.
In other words, if gold is to slide lower soon, it likely has to do it really soon (like today or tomorrow) or else it might not be able to keep the momentum going, and correct instead.
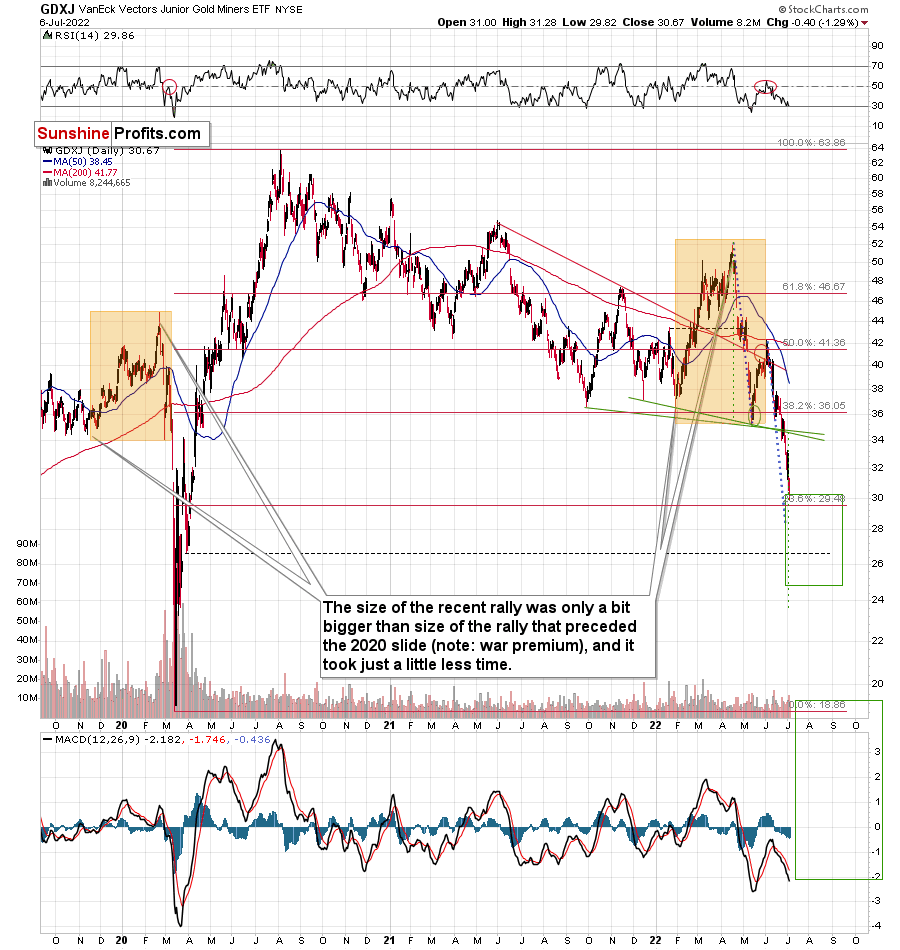
During yesterday’s session, junior miners were relatively strong compared to gold, which is another bullish indication. In addition, its RSI indicator moved slightly below 30, which is also a buy signal.
The GDXJ just moved below the upper border of my target area, and it’s very close to one of the Fibonacci retracement levels.
So, did we just see a bottom in the mining stocks? We might have, but it’s not the most likely outcome in my view.
Why wouldn’t that be the most likely outcome? Is the only reason the fact that gold is not yet in its strong support area? No, there’s one other major reason.
It’s the USD Index, which hasn’t been that high in 20 years!
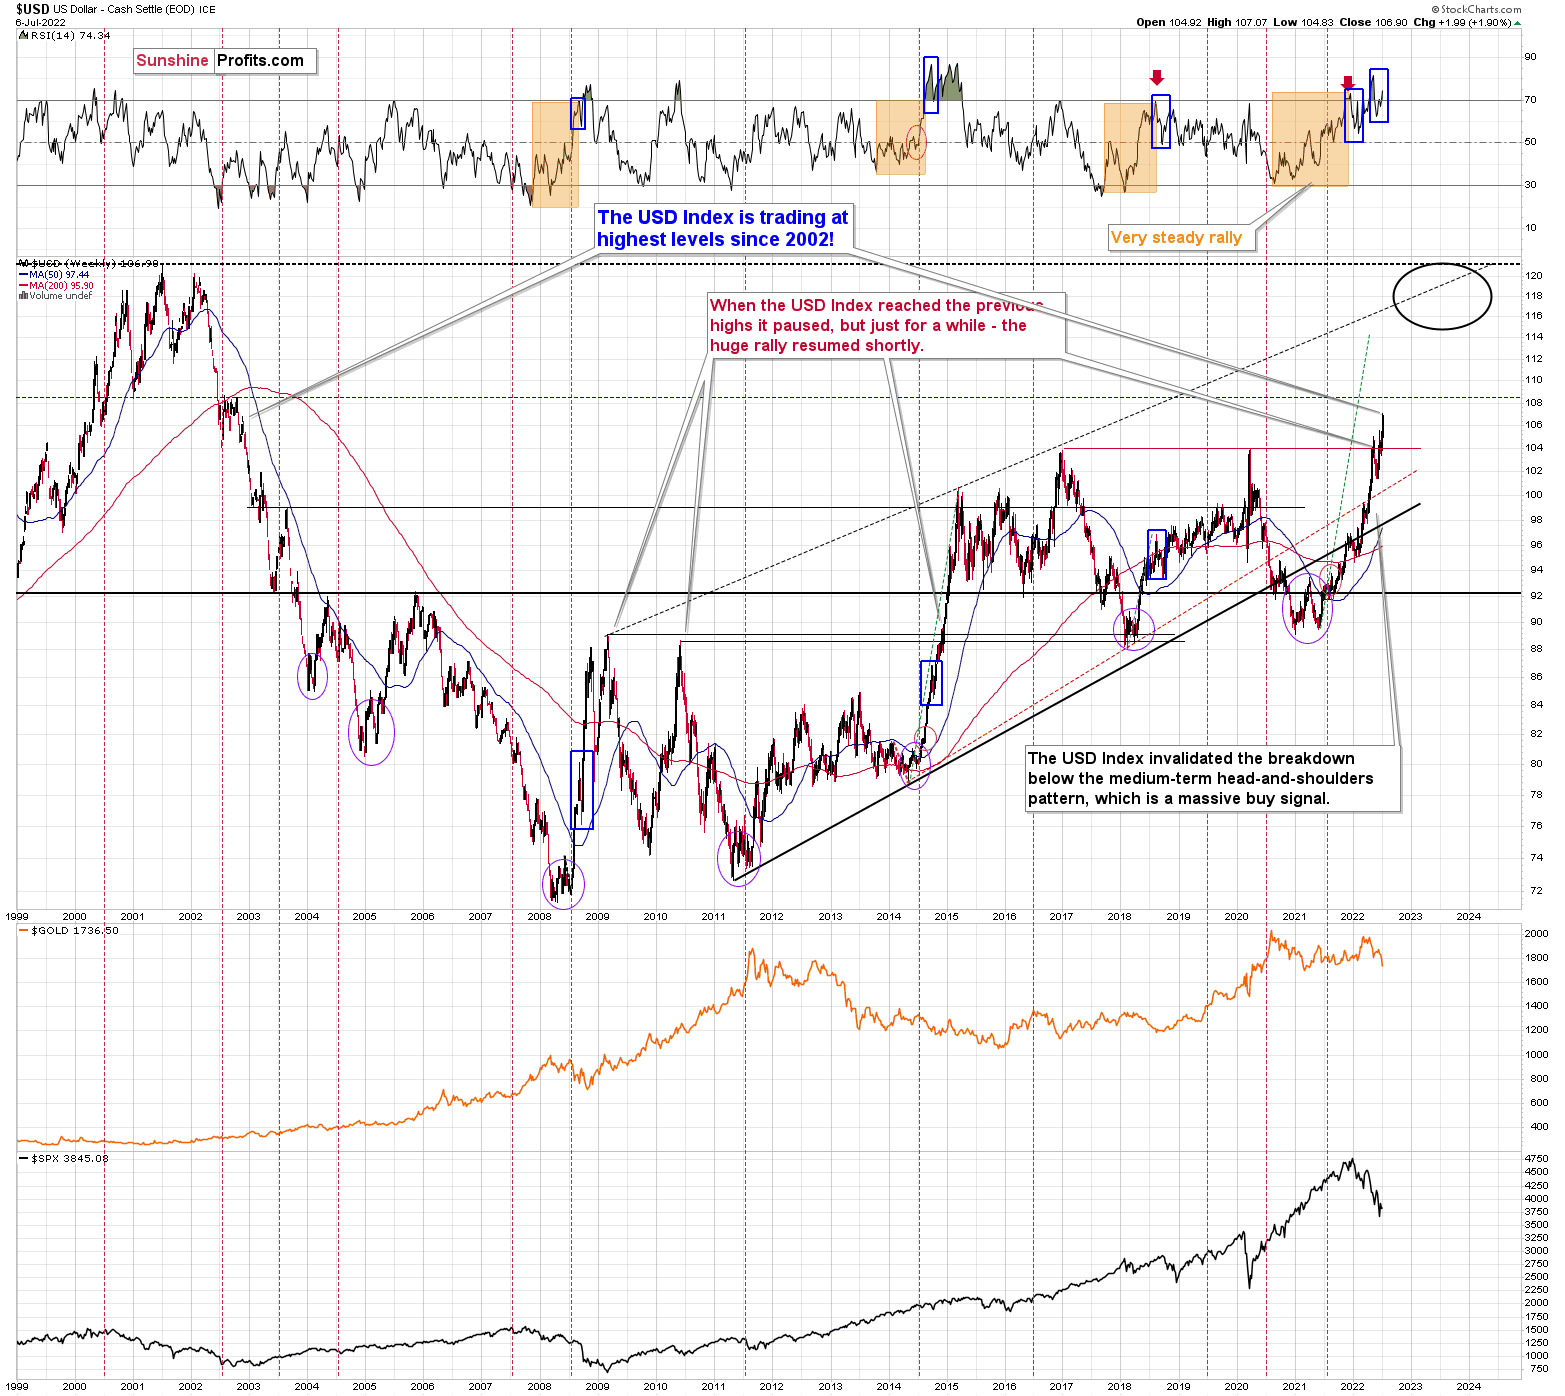
Unlike almost everyone commenting on the precious metals sector, I’ve been writing for months (and years) that the USD Index is going higher – not because things are going so well in the U.S., but because things in other parts of the world are even worse, and that’s what we saw.
The USD Index just broke above the previous highs, and it did so after correcting, which means that it just completed a massively bullish cup-and-handle pattern. This pattern is likely to send the USD Index much higher. However, since no market moves in a straight line, either up or down, let’s see where we have potential resistance levels.
The nearest resistance is provided by the 2002 high, and it’s slightly above the 108 level.
This means that the USD Index could easily rally by another 1 index point or so, which in turn could easily trigger another profound decline in gold.
This could happen this week, so please stay tuned.
Whether this triggers a massive decline in junior miners or not is a different matter. It might, but it also might trigger a move back to yesterday’s intraday lows or just somewhat below them, and then miners could show strength. Either of the above – if accompanied by gold’s move to / below $1,700 – would serve as a signal for closing our current short positions and taking our massive profits off the table.
Do I plan to enter a long position once I close the current short position? Yes, but only if gold declines below $1,700. If it doesn’t, and it moves higher right now, then I most likely won’t make any adjustments to the current short position. Remember – it’s not the point to catch each and every price move – in fact, it’s impossible to do so. The point is to select those trades that have the best risk-to-reward ratio and then enter trades while waiting out (i.e., ignoring) possible trades that don’t have a very favorable risk to-reward-ratio.
As always, I’ll keep you – my subscribers – informed.
Having said that, let’s take a look at the markets from a more fundamental point of view.
Nominal Issues
While the U.S. 10-Year Treasury yield rallied sharply on Jul. 6, the benchmark has declined materially from its 2022 highs. Moreover, with the USD Index marching to another new 2022 high, the divergence may seem strange. However, the U.S. dollar and U.S. Treasuries are safe-haven assets, and with recession fears intensifying, it’s logical that both would catch a bid. To explain, I wrote on Sep. 22, 2021:
With the USD Index and U.S. Treasury yields the main fundamental drivers of the PMs’ performance, some confusion has arisen due to their parallel and divergent moves. For example, sometimes the USD Index rises (falls) while U.S. Treasury yields fall (rise), and sometimes the pair moves higher/lower in unison. However, it’s important to remember that different economic environments have different impacts on the USD Index and U.S. Treasury yields.
The USD Index benefits from both the safe-haven bid (stock market volatility) and economic outperformance relative to its FX peers. Conversely, U.S. Treasury yields only benefit from the latter. Thus, when economic risks intensify (like what we witnessed with Evergrande on Sep. 20), the USD Index often rallies while U.S. Treasury yields often fall. Thus, the economic climate is often the fundamental determinant of the pairs’ future paths.
Therefore, with the Fed hawked up, recession risks amplified and the Eurozone in rough shape given its reliance on Russian oil and gas, safe-haven flows have benefited the U.S. dollar and hurt the U.S. 10-Year Treasury yield.
Please see below:
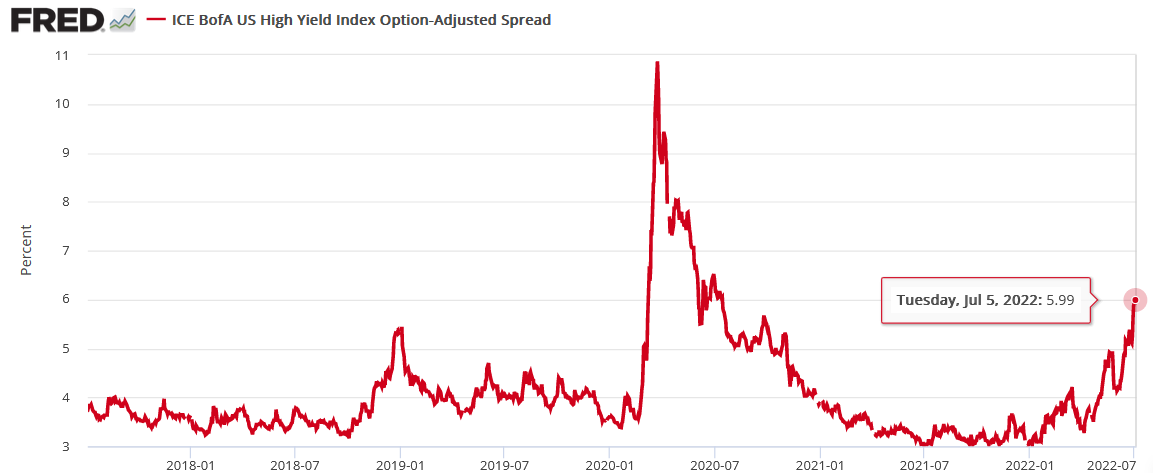
To explain, the red line above tracks Bank of America’s high yield option-adjusted spread (OAS). For context, the metric tallies the excess interest rate over Treasuries that investors demand to own junk bonds. In addition, the spread is adjusted to remove the basis point impact of high yield bonds’ call and put options.
If you analyze the right side of the chart, notice how the OAS has risen sharply in recent months. For context, the St. Louis Fed’s reading is delayed by one day, but you can see how the spread has surpassed its 2018 highs. As a result, recession fears and the prospect of corporate defaults have driven a risk-off mood in the bond market.
To that point, the performance of the iShares iBoxx $ High Yield Corporate Bond ETF (HYG) highlights investors’ anxiety.
Please see below:
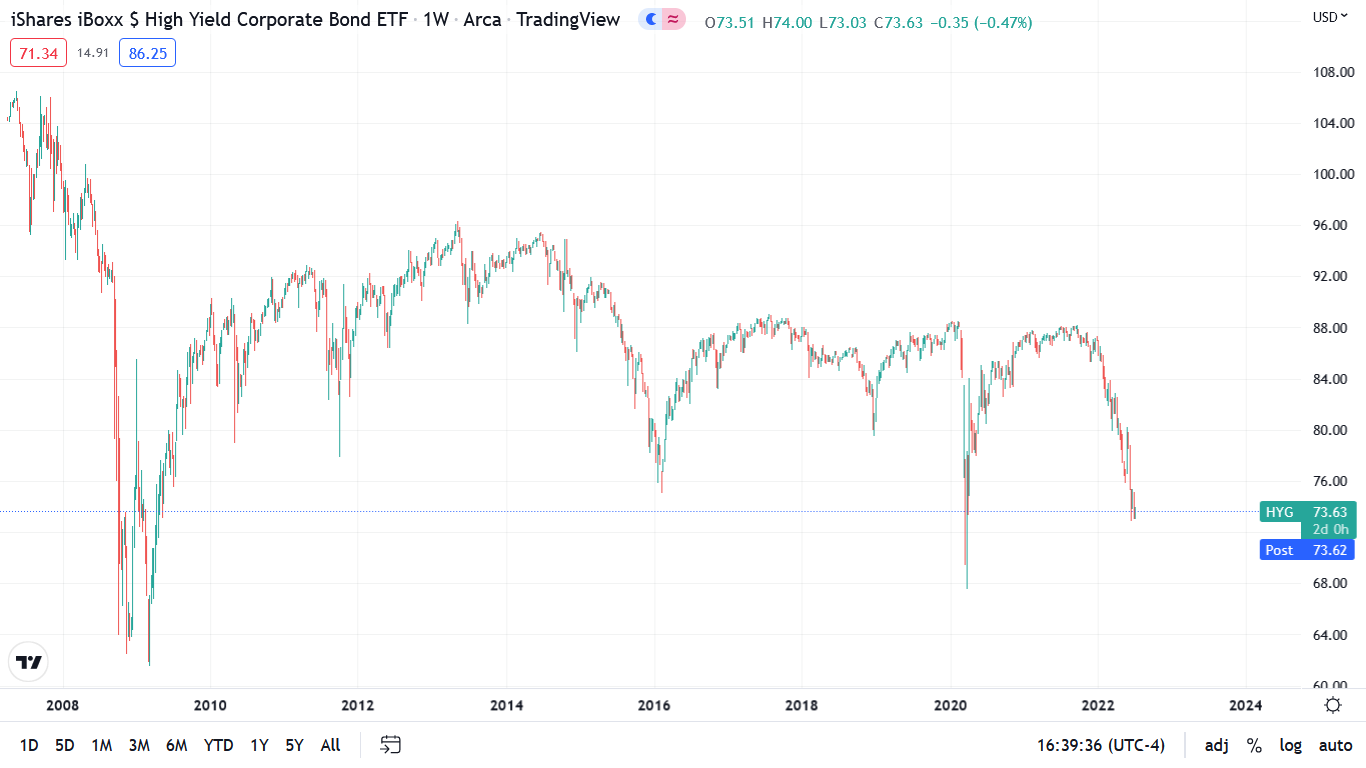
To explain, the candlesticks above depict the performance of the HYG ETF. If you analyze the right side of the chart, you can see that the ETF is trading at levels unseen since the COVID-19 crash and the global financial crisis (GFC). For context, HYG is the largest high-yield bond ETF in the U.S., and junk credit is only one notch above equities in the capital structure. Therefore, when investors dump high-yield bonds, their faith in the U.S. economy has all but evaporated.
Furthermore, the credit spread between junk bonds and lower-tiered investment-grade bonds is also widening.
Please see below:
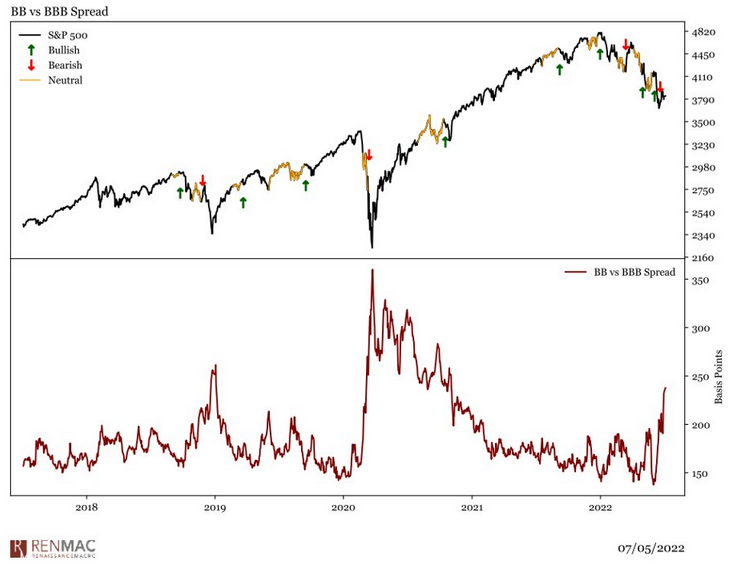
To explain, the black line at the top half of the chart tracks the S&P 500, while the red line at the bottom half tracks the credit spread of BBB investment-grade corporate bonds versus BB non-investment grade (high yield/junk) corporate bonds.
If you analyze the right side of the chart, you can see that the red line has increased dramatically. This means that spreads on high yield credit are rising faster than investment grade. In a nutshell: default fears have made investors less willing to finance risky companies. Moreover, the data shows that a rising red line is often bearish for the S&P 500. As such, if high yield credit spreads continue their ascent, a material drawdown of the S&P 500 should coincide with more safe-haven flows into the USD Index and U.S. Treasuries.
In addition, the EUR/USD has completely collapsed. Moreover, while I’ve been bearish on the currency pair for many months, the EUR/USD hit a new 2022 low on Jul. 6 and should reach parity with the U.S. dollar. As a result, risk-on currencies have been abandoned.
Please see below:
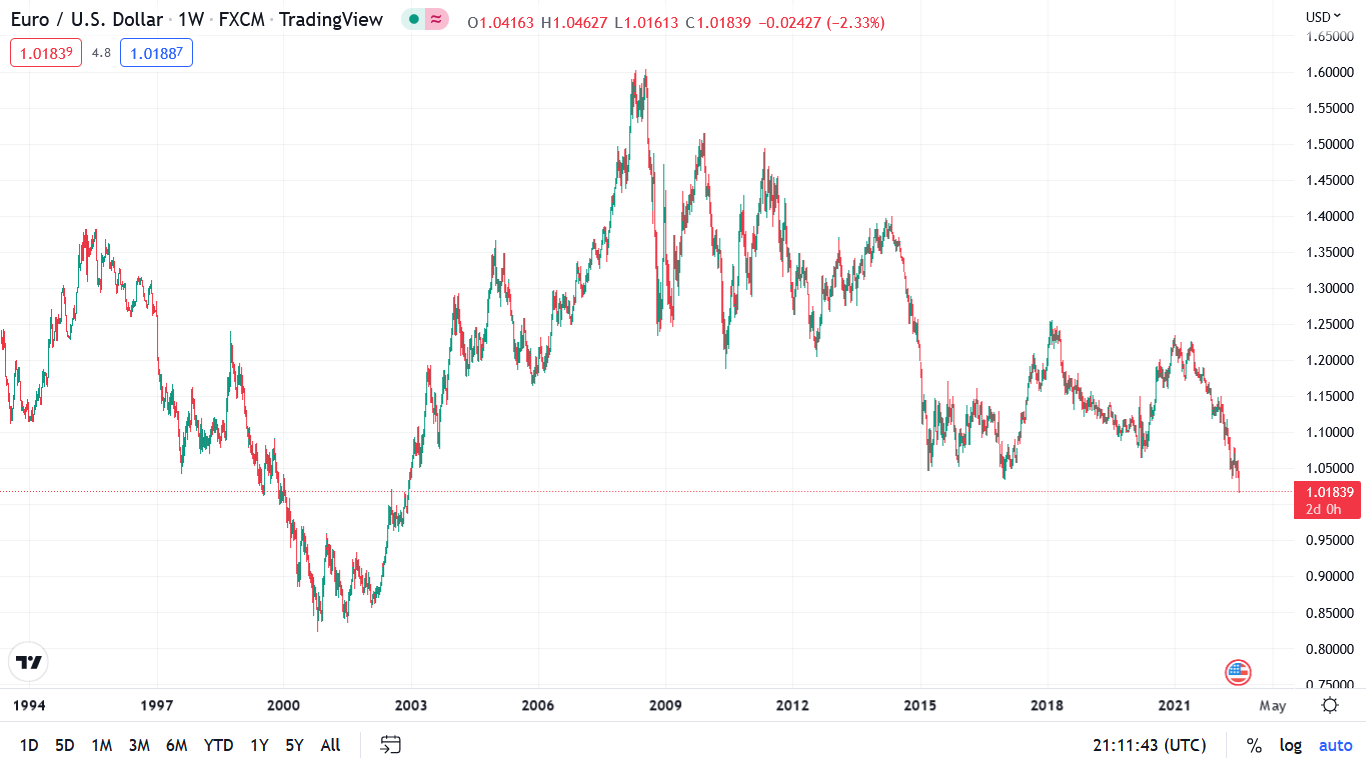
To explain, the candlesticks above depict the performance of the EUR/USD. If you analyze the right side of the chart, you can see that the currency pair is now at a ~20-year low. Thus, the stock market’s tranquility contrasts with the fear in the bond and currency markets.
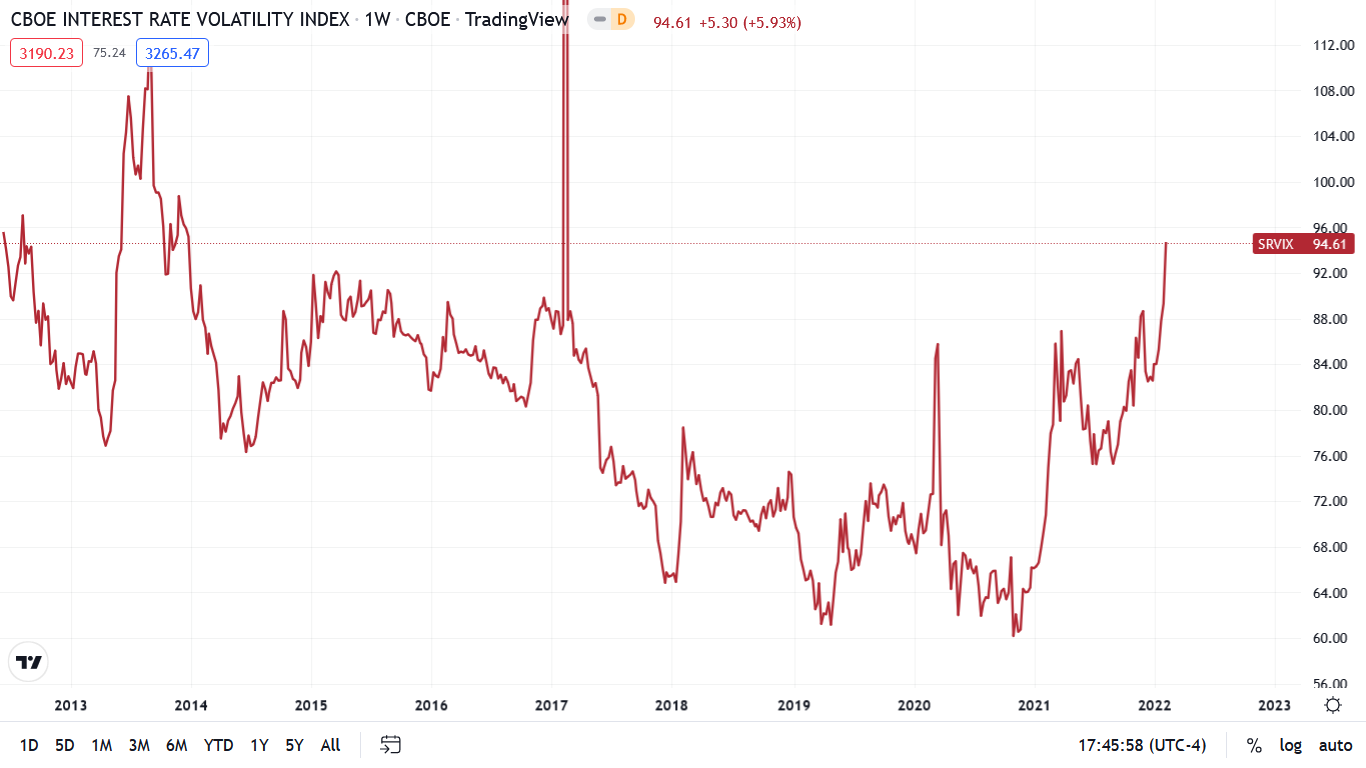
As evidence, while the Cboe Volatility Index (VIX) – which measures stock market volatility – closed lower again on Jul. 6, the Cboe Interest Rate Volatility Index (SRVIX) rose and has surpassed its 2020 highs. As such, there is plenty of fear in assets outside the S&P 500.
The Real Story
While all of the above helps explain the fundamental forces pushing the U.S. 10-Year Treasury yield lower, it’s important to remember that lower nominal yields are still bearish for the PMs in this environment. To explain, I wrote on Apr. 20:
The next leg higher for the U.S. 10-Year real yield may occur for the opposite reasons. For example, I noted above that we don’t need nominal yields to rise for real yields to rise. Moreover, while the U.S. 10-Year Treasury yield was undervalued in 2021 and was poised to move higher, the U.S. 10-Year breakeven inflation rate is overvalued in 2022 and is poised to move lower.
Please see below:
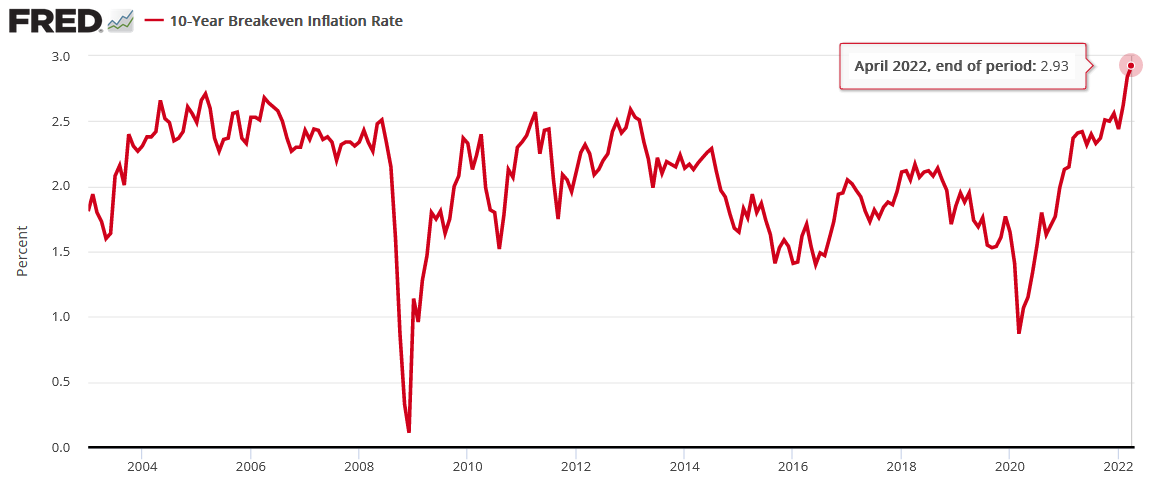
To explain, the U.S. 10-Year breakeven inflation rate ended the Apr. 19 session at 2.93%, only slightly below the all-time high of 2.95% set in March. However, like the PMs, investors’ long-term inflation expectations remain in la-la land.
To that point, with the U.S. 10-Year breakeven inflation rate ending the Jul. 6 session at 2.29%, the metric remains in free fall.
Please see below:
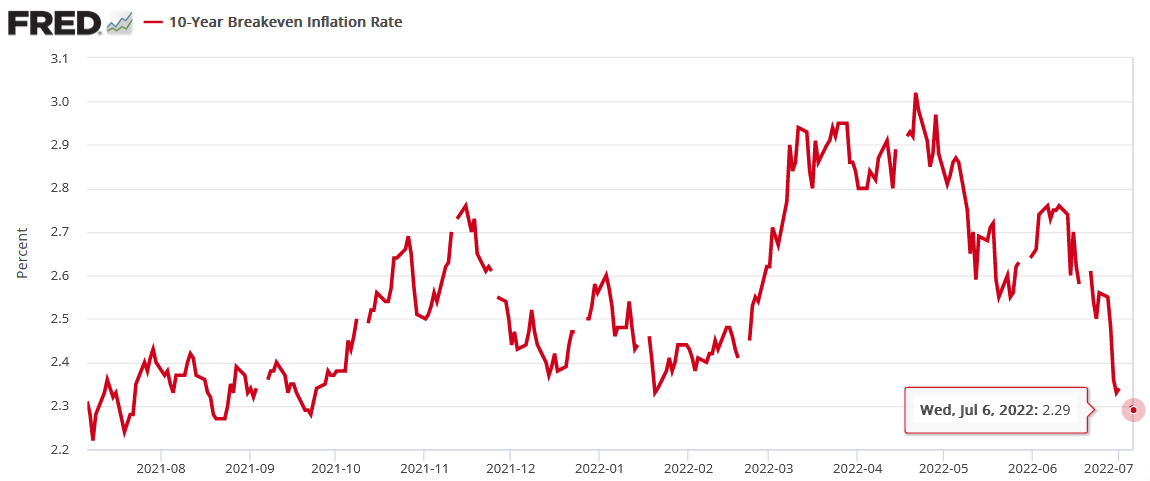
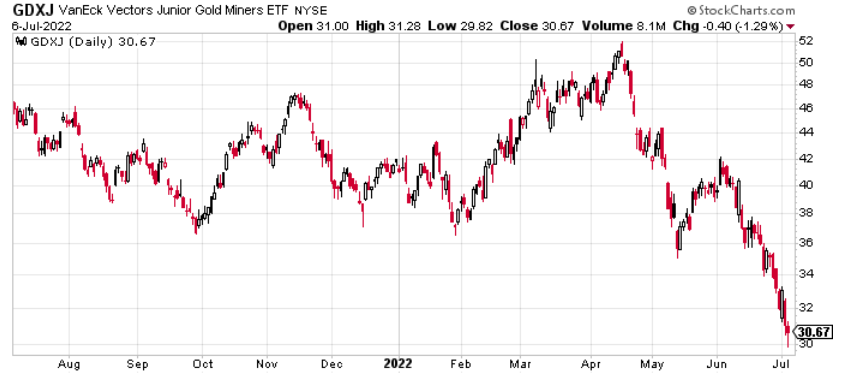
Moreover, notice how the GDXJ ETF has almost mirrored the U.S. 10-Year breakeven inflation rate’s movement over the last 12 months.
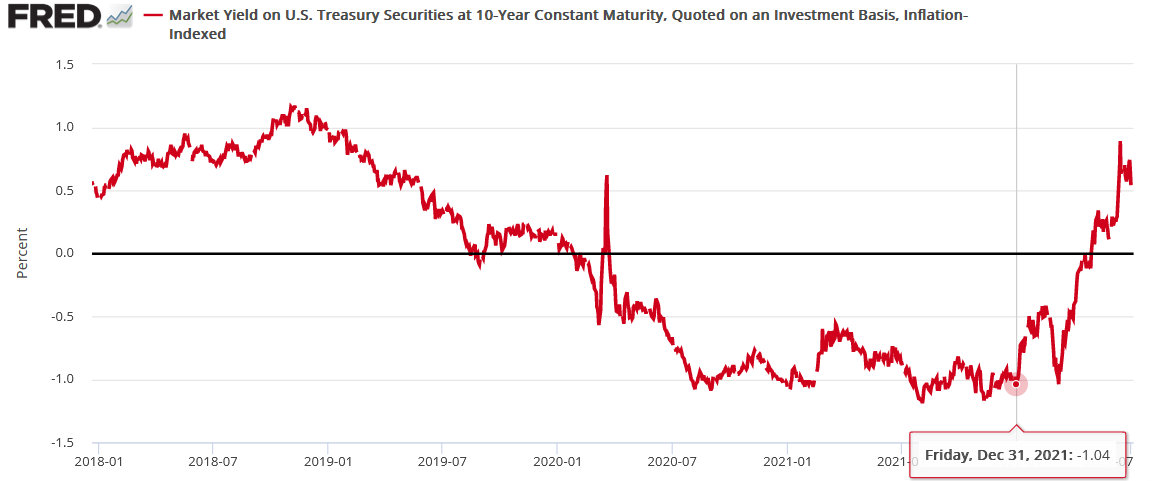
Furthermore, with the U.S. 10-Year Treasury yield closing at 2.93% on Jul. 6, the U.S. 10-Year real yield is still materially elevated at 0.64%. For context, the metric ended 2021 at -1.04%. As a result, the 2022 ascent has been rapid, and the movement of nominal yields is less important than the movement of real yields.
Fed Minutes
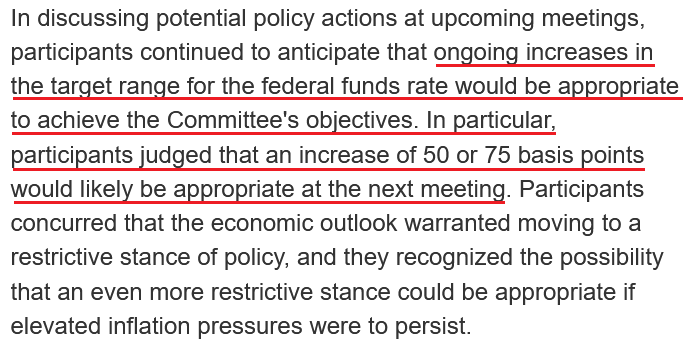
With the Fed releasing the minutes from its Jun. 14-15 monetary policy meeting on Jul. 6, the results were profoundly bullish for the USD Index and U.S. real yields. For example, an excerpt read:
"Participants concurred that the economic outlook warranted moving to a restrictive stance of policy, and they recognized the possibility that an even more restrictive stance could be appropriate if elevated inflation pressures were to persist."
In addition:
“Participants recognized that policy firming could slow the pace of economic growth for a time, but they saw the return of inflation to 2 percent as critical to achieving maximum employment on a sustained basis.”
Moreover, officials cited the long-term ramifications of letting inflation rage:
“Many participants judged that a significant risk now facing the Committee was that elevated inflation could become entrenched if the public began to question the resolve of the Committee to adjust the stance of policy as warranted.”
As a result, while the Fed has already hiked interest rates six times in 2022 (25 basis point increments), “ongoing increases” should be expected in the months ahead.
Please see below:
 Source: U.S. Fed
The Bottom Line
While the move in nominal interest rates may seem material, the plight of the U.S. 10-Year breakeven inflation rate has offset the damage. Moreover, with history showing that the U.S. 10-Year Treasury yield peaked after seven and nine rate hikes in 2000 and 2018, the current tally of six puts us near those historical thresholds. Furthermore, with the count poised to reach eight or nine in the coming weeks and a recession likely on the horizon, the action in the bond and FX markets signals that the U.S. 10-Year Treasury yield may have already reached its precipice.
For context, it’s not that the benchmark can’t move higher. It’s that the risk-reward of higher yields is no longer a sure thing. In 2021, inflation was out of control and Treasury yields were at or near their all-time lows. Therefore, the prospect of higher interest rates was a near certainty. In contrast, commodities have collapsed over the last 30 days (which should reduce inflation) and the U.S. 10-Year Treasury yield hit its highest level since 2011 before the recent pullback. As a result, lower long-term nominal yields may be the path of least resistance.
However, please remember that we’re concerned about real yields, not nominal yields. Thus, with the U.S. 10-Year breakeven inflation rate still above the Fed’s 2% target and higher real interest rates needed to cool inflation, the fundamental outlook (for the following weeks/months, not years!) for the PMs remains profoundly bearish.
In conclusion, the PMs were mixed on Jul. 6, as silver escaped the slaughter (it simply took a breather after breaking to new yearly lows in the previous days). However, the Fed’s job is far from over, as 8%+ annualized inflation won’t abate on its own. Therefore, more commodity carnage should materialize in the months ahead and culminate with a recession that pushes the PMs to their final lows.
Overview of the Upcoming Part of the Decline
- It seems to me that the precious metals market is already in its medium-term decline that is about to take it much lower (to the 2021 lows in case of gold - $1,650 - $1,700)
- If we see a situation where miners slide in a meaningful and volatile way while silver doesn’t (it just declines moderately), I plan to – once again – switch from short positions in miners to short positions in silver. At this time, it’s too early to say at what price levels this could take place and if we get this kind of opportunity at all – perhaps with gold prices close to $1,600.
- If we see a situation where miners slide in a meaningful and volatile way while silver doesn’t (it just declines moderately), I plan to – once again – switch from short positions in miners to short positions in silver. At this time, it’s too early to say at what price levels this could take place and if we get this kind of opportunity at all – perhaps with gold prices close to $1,600.
- I plan to exit all remaining short positions once gold shows substantial strength relative to the USD Index while the latter is still rallying. This may be the case with gold close to $1,400. I expect silver to fall the hardest in the final part of the move. This moment (when gold performs very strongly against the rallying USD and miners are strong relative to gold after its substantial decline) is likely to be the best entry point for long-term investments, in my view. This can also happen with gold close to $1,400, but at the moment it’s too early to say with certainty.
- The above is based on the information available today, and it might change in the following days/weeks.
You will find my general overview of the outlook for gold on the chart below:
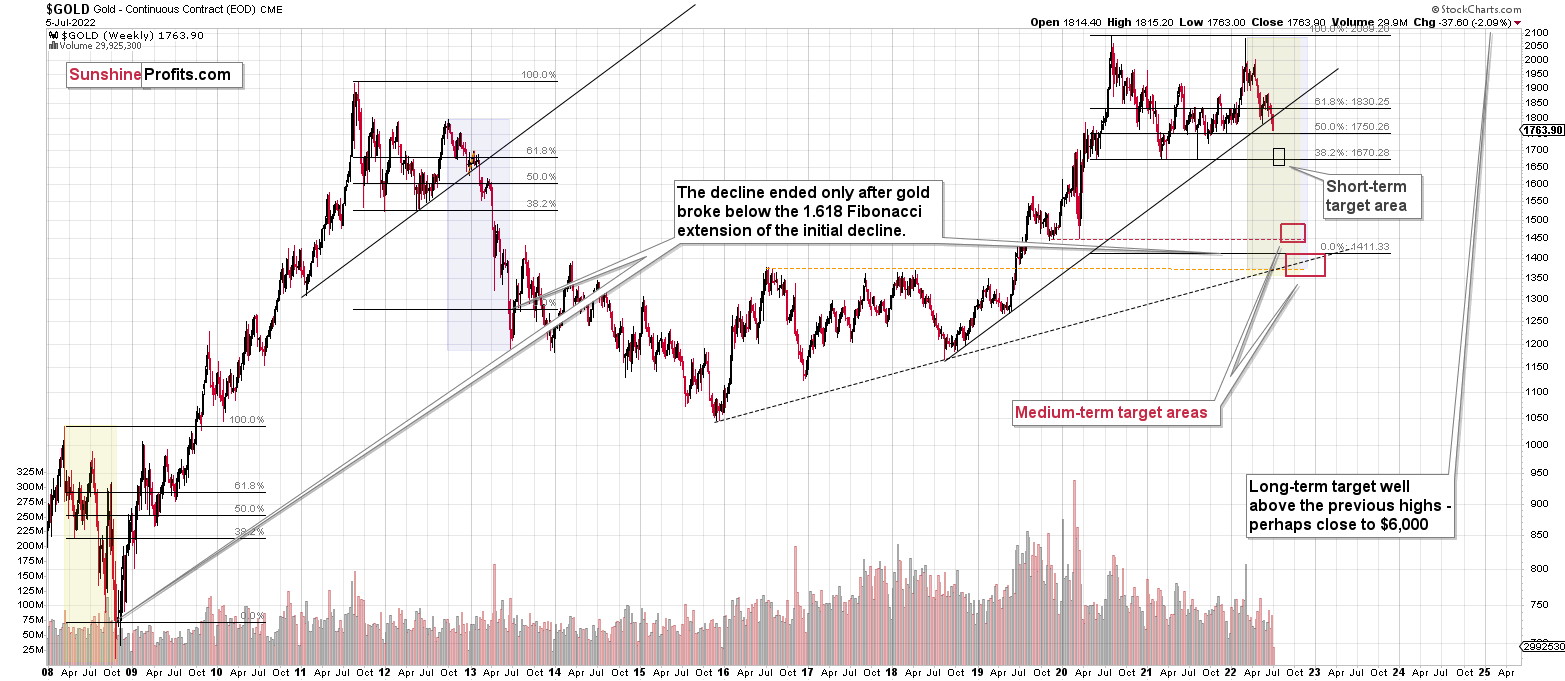
Please note that the above timing details are relatively broad and “for general overview only” – so that you know more or less what I think and how volatile I think the moves are likely to be – on an approximate basis. These time targets are not binding or clear enough for me to think that they should be used for purchasing options, warrants, or similar instruments.
Summary
Summing up, it seems to me that the short-term rally in the precious metals market is over, and the decline will now continue. And the tiny correction’s days are likely numbered, too.
I previously wrote that the profits from the previous long position (congratulations once again) were likely to further enhance the profits on this huge decline, and that’s exactly what happened. The profit potential with regard to the upcoming gargantuan decline remains huge.
As investors are starting to wake up to reality, the precious metals sector (particularly junior mining stocks) is declining sharply. Here are the key aspects of the reality that market participants have ignored:
- rising real interest rates,
- rising USD Index values.
Both of the aforementioned are the two most important fundamental drivers of the gold price. Since neither the USD Index nor real interest rates are likely to stop rising anytime soon (especially now that inflation has become highly political), the gold price is likely to fall sooner or later. Given the analogy to 2012 in gold, silver, and mining stocks, “sooner” is the more likely outcome.
After the final sell-off (that takes gold to about $1,350-$1,500), I expect the precious metals to rally significantly. The final part of the decline might take as little as 1-5 weeks, so it's important to stay alert to any changes.
As always, we'll keep you – our subscribers – informed.
To summarize:
Trading capital (supplementary part of the portfolio; our opinion): Full speculative short positions (300% of the full position) in junior mining stocks are justified from the risk to reward point of view with the following binding exit profit-take price levels:
Mining stocks (price levels for the GDXJ ETF): binding profit-take exit price: $27.32; stop-loss: $37.43
Alternatively, if one seeks leverage, we’re providing the binding profit-take levels for the JDST (2x leveraged). The binding profit-take level for the JDST: $18.35; stop-loss for the JDST: $10.98
For-your-information targets (our opinion; we continue to think that mining stocks are the preferred way of taking advantage of the upcoming price move, but if for whatever reason one wants / has to use silver or gold for this trade, we are providing the details anyway.):
Silver futures downside profit-take exit price: $17.22; stop-loss: $22.23
SLV profit-take exit price: $16.22; stop-loss: $20.21
ZSL profit-take exit price: $41.47; stop-loss: $26.78
Gold futures downside profit-take exit price: $1,706; stop-loss: $1,873
HGD.TO – alternative (Canadian) 2x inverse leveraged gold stocks ETF – the upside profit-take exit price: $11.87; stop-loss: $7.87
HZD.TO – alternative (Canadian) 2x inverse leveraged silver ETF – the upside profit-take exit price: $31.87; stop-loss: $20.68
Long-term capital (core part of the portfolio; our opinion): No positions (in other words: cash)
Insurance capital (core part of the portfolio; our opinion): Full position
Whether you’ve already subscribed or not, we encourage you to find out how to make the most of our alerts and read our replies to the most common alert-and-gold-trading-related-questions.
Please note that we describe the situation for the day that the alert is posted in the trading section. In other words, if we are writing about a speculative position, it means that it is up-to-date on the day it was posted. We are also featuring the initial target prices to decide whether keeping a position on a given day is in tune with your approach (some moves are too small for medium-term traders, and some might appear too big for day-traders).
Additionally, you might want to read why our stop-loss orders are usually relatively far from the current price.
Please note that a full position doesn't mean using all of the capital for a given trade. You will find details on our thoughts on gold portfolio structuring in the Key Insights section on our website.
As a reminder - "initial target price" means exactly that - an "initial" one. It's not a price level at which we suggest closing positions. If this becomes the case (as it did in the previous trade), we will refer to these levels as levels of exit orders (exactly as we've done previously). Stop-loss levels, however, are naturally not "initial", but something that, in our opinion, might be entered as an order.
Since it is impossible to synchronize target prices and stop-loss levels for all the ETFs and ETNs with the main markets that we provide these levels for (gold, silver and mining stocks - the GDX ETF), the stop-loss levels and target prices for other ETNs and ETF (among other: UGL, GLL, AGQ, ZSL, NUGT, DUST, JNUG, JDST) are provided as supplementary, and not as "final". This means that if a stop-loss or a target level is reached for any of the "additional instruments" (GLL for instance), but not for the "main instrument" (gold in this case), we will view positions in both gold and GLL as still open and the stop-loss for GLL would have to be moved lower. On the other hand, if gold moves to a stop-loss level but GLL doesn't, then we will view both positions (in gold and GLL) as closed. In other words, since it's not possible to be 100% certain that each related instrument moves to a given level when the underlying instrument does, we can't provide levels that would be binding. The levels that we do provide are our best estimate of the levels that will correspond to the levels in the underlying assets, but it will be the underlying assets that one will need to focus on regarding the signs pointing to closing a given position or keeping it open. We might adjust the levels in the "additional instruments" without adjusting the levels in the "main instruments", which will simply mean that we have improved our estimation of these levels, not that we changed our outlook on the markets. We are already working on a tool that would update these levels daily for the most popular ETFs, ETNs and individual mining stocks.
Our preferred ways to invest in and to trade gold along with the reasoning can be found in the how to buy gold section. Furthermore, our preferred ETFs and ETNs can be found in our Gold & Silver ETF Ranking.
As a reminder, Gold & Silver Trading Alerts are posted before or on each trading day (we usually post them before the opening bell, but we don't promise doing that each day). If there's anything urgent, we will send you an additional small alert before posting the main one.
Thank you.
Przemyslaw Radomski, CFA
Founder, Editor-in-chief

