

Briefly: in our opinion, full (300% of the regular position size) speculative short positions in junior mining stocks are justified from the risk/reward point of view at the moment of publishing this Alert.
NOTE TO READERS:
Dear Subscribers,
Due to the Author's absence, the Gold & Silver Trading Alerts published between today and next Thursday (Oct. 27) will be based on fundamental events, and they will not include the regular technical part.
However, you
will remain informed through the intraday Alerts if anything really major happens.
Stay tuned!
Introduction
Despite the S&P 500’s 0.80% decline on Oct. 20, gold rallied by 0.16%, silver by 1.80%, the GDX ETF by 1.27% and the GDXJ ETF by 1.48%. Moreover, the USD Index traded 0.05% lower, while the U.S. 10-Year real yield ended the day flat. Thus, while volatility remains uplifted amid the rise in interest rates, the PMs’ bearish medium-term technical and fundamental outlooks are unchanged.
Rising Rates
While the S&P 500 suffered a sharp intraday reversal on Oct. 20, gold, silver and mining stocks ended the day in the green. However, with rising interest rates poised to inflict more pain on risk assets, their relative strength should fade in the weeks and months ahead.
Please see below:
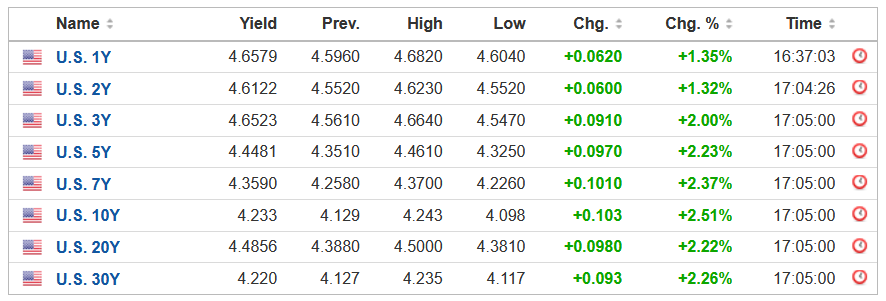 Source: Investing.com
To explain, yields jumped once again, and the U.S. 10-Year Treasury yield closed at another 2022 high. But with the USD Index and the U.S. 10-Year real yield remaining roughly flat, the ramifications were largely neutral for the PMs. Yet, with the real yield benchmark still at a decade-plus high, the USD Index and the U.S. 10-Year real yield should seek higher ground in the months ahead.
Please see below:
In addition, while the consensus assumed that a ~3% U.S. federal funds rate (FFR) would be enough to curb the highest inflation in 40+ years, I warned throughout 2021 and 2022 that the prospect was extremely unrealistic. Furthermore, with expectations shifting substantially in only a few months, the reality check should pressure the PMs over the medium term. To explain, I wrote on Aug. 1:
While the consensus assumes the Fed is near the end of its rate hike cycle, the Consumer Price Index (CPI) is on the fast track to 2% and a 3% FFR will be enough to capsize inflation, market participants are living in fantasy land.
For example, I’ve warned on numerous occasions that demand is much stronger than the consensus realizes. With Americans’ checking account balances at unprecedented all-time highs and the Atlanta Fed’s wage growth tracker hitting an all-time high in June, the FFR needs to go meaningfully above 3%. To explain, I wrote on Jul. 25:
With more earnings calls showcasing how the situation continues to worsen, market participants don’t realize that the U.S. federal funds rate needs to hit ~4.5% or more for the Fed to materially reduce inflation. For context, the consensus expects a figure in the 2.5% to 3.5% range.
However, a major milestone materialized on Oct. 20, as the dovish pivot crowd suffered a painful death.
Please see below:
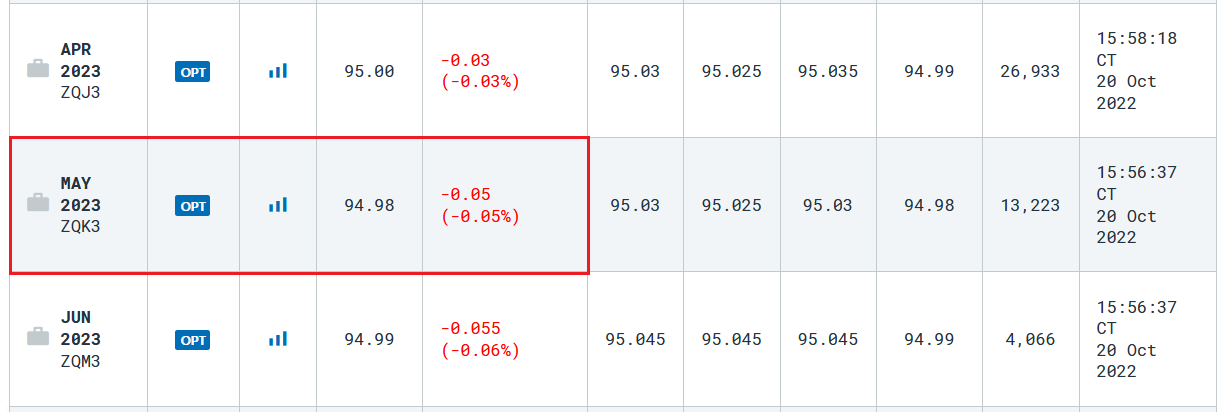 Source: CME Group
To explain, the table above tracks the peak FFR implied by the futures market, and the rate is calculated by subtracting the last price from 100. If you analyze the red rectangle, you can see that futures traders expect a peak FFR of 5.02%. Moreover, it’s the first time in 2022 that rate hike expectations have hit 5% or more, and the crowd is now firmly aligned with our estimate of 4.5% to 5.5% in 2023.
As a result, the fundamentals continue to unfold as expected, and the liquidity drain is profoundly bearish for gold, silver, mining stocks and the S&P 500.
To that point, while stocks were up for most of the morning, Fed officials’ hawkish rhetoric poured cold water on the celebration. For example, Philadelphia Fed President Patrick Harker said on Oct. 20:
“Sometime next year, we are going to stop hiking rates. At that point, I think we should hold at a restrictive rate for a while to let monetary policy do its work. It will take a while for the higher cost of capital to work its way through the economy. After that, if we have to, we can tighten further, based on the data.”
Thus, with “sometime” still well into the future, the Fed has plenty of room to lift the FFR.
Please see below:
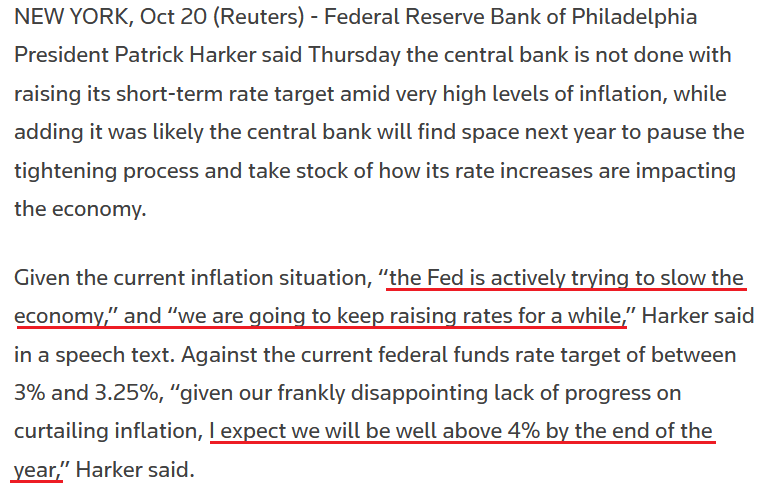 Source: Reuters
Similarly, Fed Governor Lisa Cook said on Oct. 20:
“Inflation is too high; it must come down and we will keep at it until the job is done. This likely will require ongoing rate hikes and then keeping policy restrictive for some time (…). Policy must be based on whether we see inflation actually falling in the data, rather than just in forecasts. Policy should remain focused on restoring price stability, which will also set the foundation for a sustainably strong labor market.”
So with Fed officials reiterating their commitment to normalizing inflation, I warned on Apr. 6 that the bulls were fighting a losing battle. I wrote:
Please remember that the Fed needs to slow the U.S. economy to calm inflation, and rising asset prices are mutually exclusive to this goal. Therefore, officials should keep hammering the financial markets until investors finally get the message.
Moreover, with the Fed in inflation-fighting mode and reformed doves warning that the U.S. economy “could teeter” as the drama unfolds, the reality is that there is no easy solution to the Fed’s problem. To calm inflation, it has to kill demand. As that occurs, investors should suffer a severe crisis of confidence.
Furthermore, with Harker making the point for me when he said, “the Fed is actively trying to slow the economy,” there is no more confusion; and while the S&P 500 and the PMs have declined substantially since Apr. 6, their medium-term lows are likely still on the horizon.
To explain, I wrote on Oct. 7:
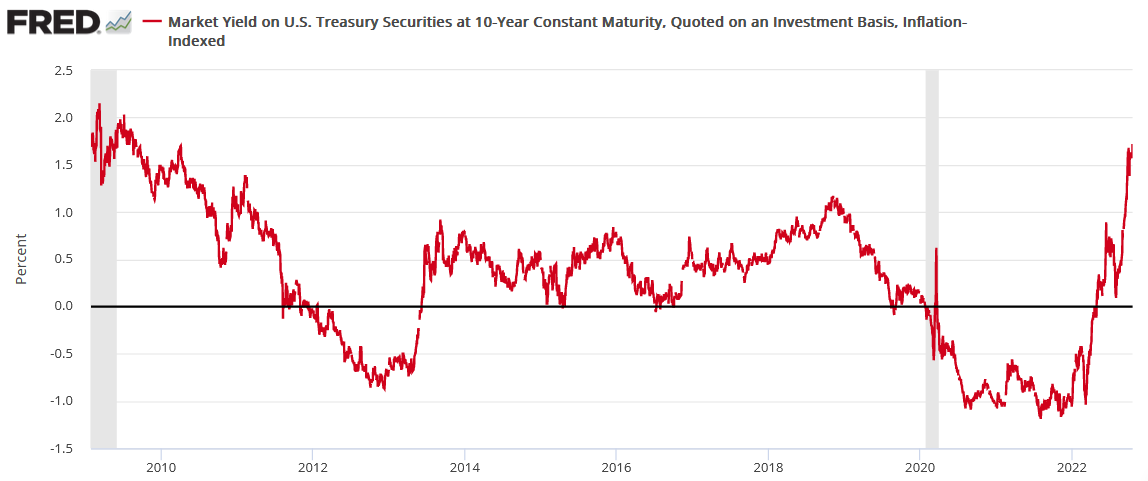
The U.S. 10-Year real yield often peaks alongside the FFR (or near it). As a result, with the Fed poised to raise the FFR by at least another 1.25% (to reach 4.5%), the U.S. 10-Year real yield should have more room to run, which is bullish for the USD Index.
Please see below:
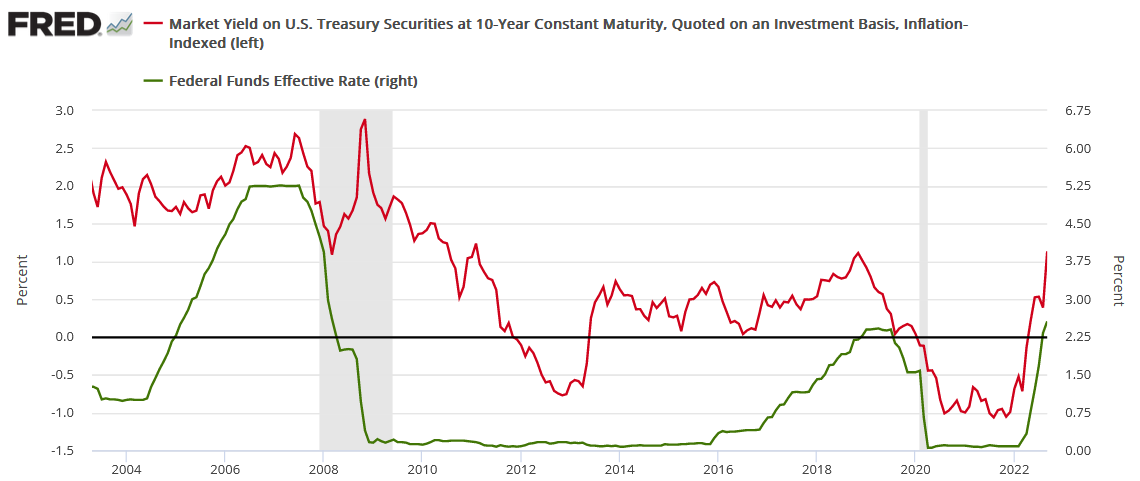
To explain, the red line above tracks the U.S. 10-Year real yield, while the green line above tracks the FFR. As you can see, a higher FFR supports higher real interest rates. Also, when the FFR hit ~4.5% in February 2006, the U.S. 10-Year real yield reached a monthly high of 2.14%, and it occurred with a YoY CPI at roughly half the current rate.
So with the latter ending the Oct. 6 session at 1.54%, there is still plenty of potential upside over the medium term. As such, the outlook is bullish for the U.S. 10-Year real yield and the USD Index, and the PMs should suffer as interest rates normalize to more appropriate levels.
To that point, the U.S. 10-Year real yield ended the Oct. 20 session at 1.74%, and there is still room to run; and if the FFR exceeds the February 2006 reading of ~4.5% (remember, 5.02% is now priced in), the U.S. 10-Year real yield could surpass its February 2006 high of 2.14%.
Thus, risk assets remain in a precarious position, and the PMs shouldn’t bottom until the medium-term technicals turn bullish, the Fed turns dovish, and the USD Index and the U.S. 10-Year real yield show weakness.
Hawkish PMIs
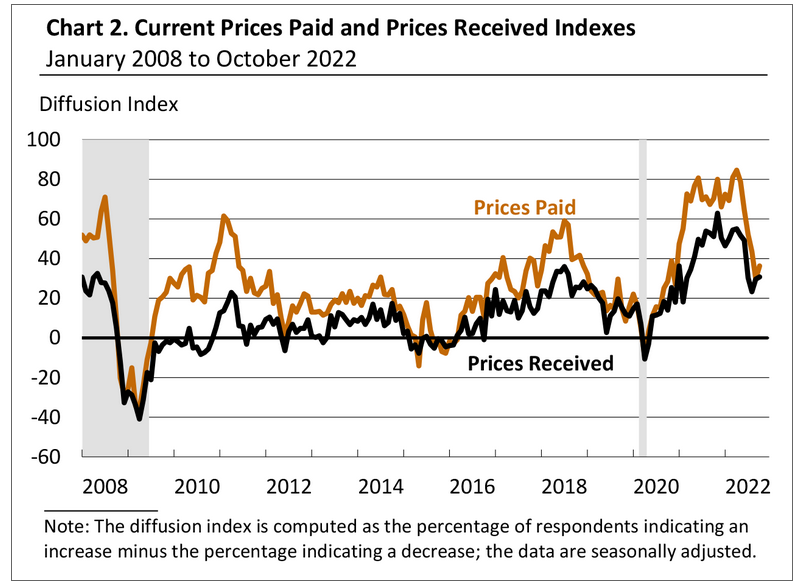
The Philadelphia Fed released its Manufacturing Business Outlook Survey on Oct. 20; and while the headline index increased from -9.7 to -8.7, it remains relatively weak. However, the report stated:
“The indicators for prices paid and prices received rose modestly this month following steady declines through the summer. The prices paid index – which had fallen 55 points between April and September of this year – rose 7 points to 36.3. The current prices received index edged up 1 point to 30.8.”
Therefore, while some progress is present, the price indexes increased again in October.
Please see below:
 Source: Philadelphia Fed
More importantly, I’ve noted recently how the U.S. labor market has become the most important fundamental variable. In a nutshell: even if inflation has peaked, it’s too high for the Fed to relax. As a result, unless employment collapses, the Fed should keep its foot on the hawkish accelerator.
Likewise, with the Philadelphia Fed’s report highlighting further job gains, the Fed has the green light to hammer inflation. An excerpt read:
“Firms continued to report increases in employment on balance. The employment index rose from 12.0 to 28.5 this month, more than offsetting its decline from last month. The average workweek index returned to positive territory, rising 14 points to 10.4.”
Please see below:
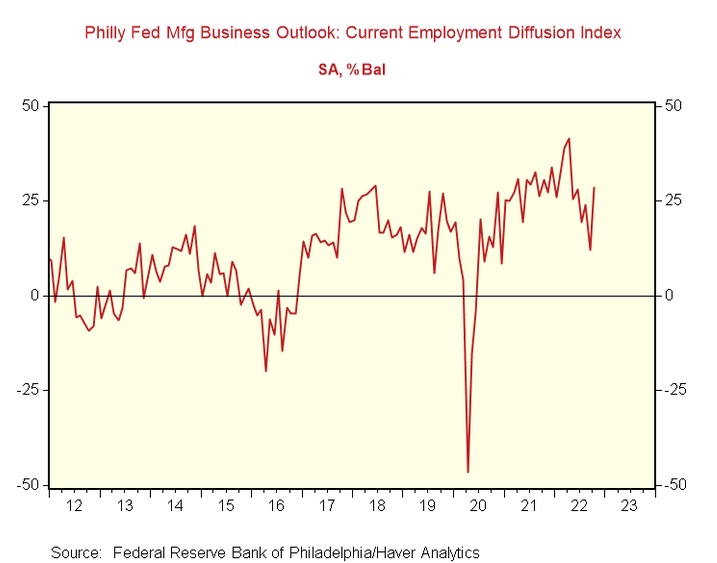
To explain, the red line above tracks the Philadelphia Fed’s employment index. If you analyze the right side of the chart, you can see that the metric is nowhere near crisis levels, and a higher FFR should materialize as the U.S. labor market remains on solid footing.
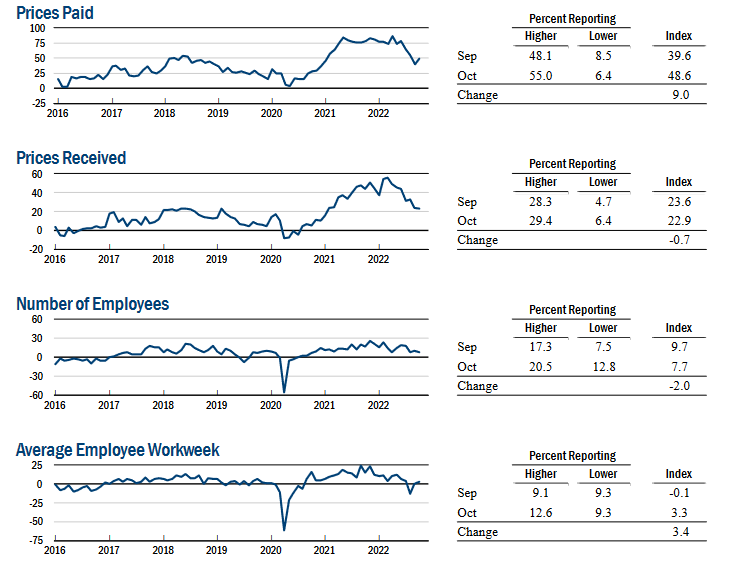
Finally, the New York Fed released its Empire State Manufacturing Survey on Oct. 17. The headline index declined from -1.1 to -9.1. However, the report revealed:
“After falling significantly over the prior three months, the prices paid index rose nine points to 48.6. The prices received index held steady at 22.9.”
In addition:
“The index for number of employees was little changed at 7.7, pointing to a modest increase in employment levels, and the average workweek index climbed to 3.3, signaling a slight increase in hours worked.”
Thus, with inflation and employment still moving in hawkish directions, a higher FFR, higher real yields, and a stronger USD Index are profoundly bearish for the PMs.
 Source: New York Fed
The Bottom Line
With higher interest rates stifling the S&P 500, even bullish seasonality coupled with contrarian positioning and sentiment metrics couldn’t help the index hold its daily gain. Therefore, while its performance is more of a wild card in the weeks ahead, the GDXJ ETF should remain a relative underperformer as the months progress.
In conclusion, the PMs rallied on Oct. 20, as they sidestepped the S&P 500’s volatility. However, while their daily optimism was aided by a flat USD Index and U.S. 10-Year real yield, both should hit new highs over the medium term. As such, the PMs will likely confront more downside before long-term buying opportunities emerge.
Overview of the Upcoming Part of the Decline
- It seems to me that the corrective upswing is over, and that the next big move lower is already underway.
- If we see a situation where miners slide in a meaningful and volatile way while silver doesn’t (it just declines moderately), I plan to – once again – switch from short positions in miners to short positions in silver. At this time, it’s too early to say at what price levels this could take place and if we get this kind of opportunity at all – perhaps with gold prices close to $1,600.
- I plan to switch from the short positions in junior mining stocks or silver (whichever I’ll have at that moment) to long positions in junior mining stocks when gold / mining stocks move to their 2020 lows (approximately). While I’m probably not going to write about it at this stage yet, this is when some investors might consider getting back in with their long-term investing capital (or perhaps 1/3 or 1/2 thereof).
- I plan to return to short positions in junior mining stocks after a rebound – and the rebound could take gold from about $1,450 to about $1,550, and it could take the GDXJ from about $20 to about $24.
- I plan to exit all remaining short positions once gold shows substantial strength relative to the USD Index while the latter is still rallying. This may be the case with gold prices close to $1,400 and GDXJ close to $15 . This moment (when gold performs very strongly against the rallying USD and miners are strong relative to gold after its substantial decline) is likely to be the best entry point for long-term investments, in my view. This can also happen with gold close to $1,400, but at the moment it’s too early to say with certainty.
- The above is based on the information available today, and it might change in the following days/weeks.
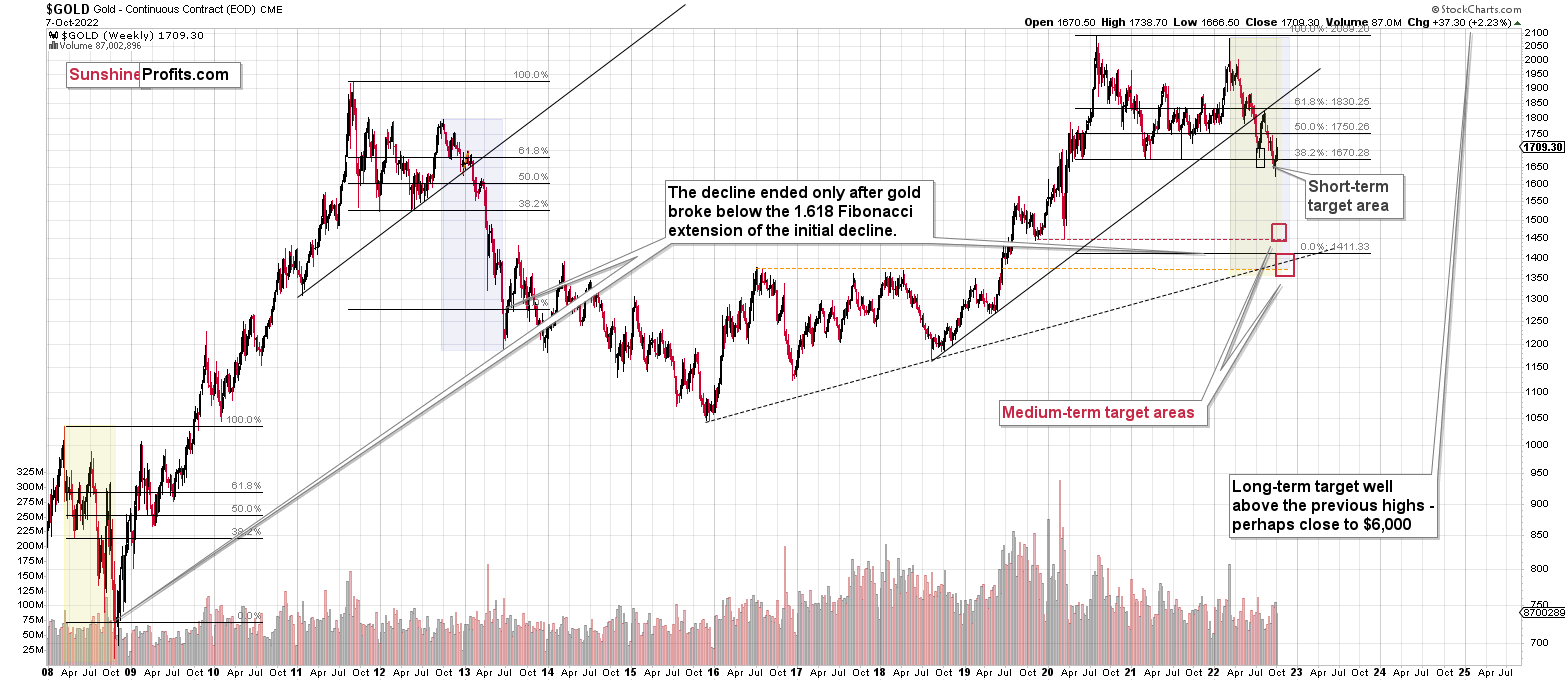
You will find my general overview of the outlook for gold on the chart below:
Please note that the above timing details are relatively broad and “for general overview only” – so that you know more or less what I think and how volatile I think the moves are likely to be – on an approximate basis. These time targets are not binding nor clear enough for me to think that they should be used for purchasing options, warrants, or similar instruments.
Summary
Summing up, it seems that the biggest part of the 2013-like decline is taking place right now, and – while I can’t make any promises regarding performance - it seems likely to me that our big profits are about to become huge, and then ridiculously big in the relatively near future.
As far as this quick corrective upswing is concerned, it seems that it might already be over.
The current quick upswing most likely doesn’t change anything. Fundamentals and technicals continue to point to lower precious metals values in the coming weeks / months. The current geopolitical news-based rally is likely to serve as nothing more than just a verification of the breakdown below the previous lows in gold.
Things might happen very fast in the coming days, and if I plan to make any adjustments, I’ll keep you informed. Still, if the targets that I’m mentioning in the “Trading” part of the summary are reached, I think that profits should be taken off the table without an additional confirmation from me. I will probably get on the long side of the market at that time, but I’ll send a confirmation if I decide to do so.
After the final sell-off (that takes gold to about $1,350-$1,500), I expect the precious metals to rally significantly. The final part of the decline might take as little as 1-5 weeks, so it's important to stay alert to any changes.
As always, we'll keep you – our subscribers – informed.
To summarize:
Trading capital (supplementary part of the portfolio; our opinion): Full speculative short positions (300% of the full position) in junior mining stocks are justified from the risk to reward point of view with the following binding exit profit-take price levels:
Mining stocks (price levels for the GDXJ ETF): binding profit-take exit price: $20.32; stop-loss: none (the volatility is too big to justify a stop-loss order in case of this particular trade)
Alternatively, if one seeks leverage, we’re providing the binding profit-take levels for the JDST (2x leveraged). The binding profit-take level for the JDST: $27.87; stop-loss for the JDST: none (the volatility is too big to justify a SL order in case of this particular trade).
For-your-information targets (our opinion; we continue to think that mining stocks are the preferred way of taking advantage of the upcoming price move, but if for whatever reason one wants / has to use silver or gold for this trade, we are providing the details anyway.):
Silver futures downside profit-take exit price: $12.32
SLV profit-take exit price: $11.32
ZSL profit-take exit price: $74.87
Gold futures downside profit-take exit price: $1,504
HGD.TO – alternative (Canadian) 2x inverse leveraged gold stocks ETF – the upside profit-take exit price: $18.47
HZD.TO – alternative (Canadian) 2x inverse leveraged silver ETF – the upside profit-take exit price: $46.87
Long-term capital (core part of the portfolio; our opinion): No positions (in other words: cash)
Insurance capital (core part of the portfolio; our opinion): Full position
Whether you’ve already subscribed or not, we encourage you to find out how to make the most of our alerts and read our replies to the most common alert-and-gold-trading-related-questions.
Please note that we describe the situation for the day that the alert is posted in the trading section. In other words, if we are writing about a speculative position, it means that it is up-to-date on the day it was posted. We are also featuring the initial target prices to decide whether keeping a position on a given day is in tune with your approach (some moves are too small for medium-term traders, and some might appear too big for day-traders).
Additionally, you might want to read why our stop-loss orders are usually relatively far from the current price.
Please note that a full position doesn't mean using all of the capital for a given trade. You will find details on our thoughts on gold portfolio structuring in the Key Insights section on our website.
As a reminder - "initial target price" means exactly that - an "initial" one. It's not a price level at which we suggest closing positions. If this becomes the case (as it did in the previous trade), we will refer to these levels as levels of exit orders (exactly as we've done previously). Stop-loss levels, however, are naturally not "initial", but something that, in our opinion, might be entered as an order.
Since it is impossible to synchronize target prices and stop-loss levels for all the ETFs and ETNs with the main markets that we provide these levels for (gold, silver and mining stocks - the GDX ETF), the stop-loss levels and target prices for other ETNs and ETF (among other: UGL, GLL, AGQ, ZSL, NUGT, DUST, JNUG, JDST) are provided as supplementary, and not as "final". This means that if a stop-loss or a target level is reached for any of the "additional instruments" (GLL for instance), but not for the "main instrument" (gold in this case), we will view positions in both gold and GLL as still open and the stop-loss for GLL would have to be moved lower. On the other hand, if gold moves to a stop-loss level but GLL doesn't, then we will view both positions (in gold and GLL) as closed. In other words, since it's not possible to be 100% certain that each related instrument moves to a given level when the underlying instrument does, we can't provide levels that would be binding. The levels that we do provide are our best estimate of the levels that will correspond to the levels in the underlying assets, but it will be the underlying assets that one will need to focus on regarding the signs pointing to closing a given position or keeping it open. We might adjust the levels in the "additional instruments" without adjusting the levels in the "main instruments", which will simply mean that we have improved our estimation of these levels, not that we changed our outlook on the markets. We are already working on a tool that would update these levels daily for the most popular ETFs, ETNs and individual mining stocks.
Our preferred ways to invest in and to trade gold along with the reasoning can be found in the how to buy gold section. Furthermore, our preferred ETFs and ETNs can be found in our Gold & Silver ETF Ranking.
As a reminder, Gold & Silver Trading Alerts are posted before or on each trading day (we usually post them before the opening bell, but we don't promise doing that each day). If there's anything urgent, we will send you an additional small alert before posting the main one.
Thank you.
Przemyslaw K. Radomski, CFA
Founder, Editor-in-chief

