

Briefly: in our opinion, full (200% of the regular position size) speculative long positions in junior mining stocks are justified from the risk/reward point of view at the moment of publishing this Alert.
NOTE TO READERS:
Dear Subscribers,
Due to PR’s travel schedule this week, tomorrow’s technical part will likely be brief, and there will be no technical parts in the Gold & Silver Trading Alerts that are posted on Thursday and Friday this week. The fundamental parts will be posted normally.
However, if anything major happens in the markets and it changes the outlook in the market or makes us think that a change in the trading/investment positions is justified from the risk/reward point of view, we’ll send you a quick intraday Alert.
Most likely, though, the GDXJ will simply move higher this week and, at least initially, next week, correcting the recent powerful decline. Let’s keep in mind that the Fed’s interest rate decision is next week, and that’s when (approximately) PMs and miners could top.
There might be some intraday volatility on Thursday as that’s when we get the initial jobless claims in the U.S. and there’s also the interest rate decision (and press conference) from the ECB. However, I don’t think that it will change the short-term trend, even if the intraday back-and-forth movement is rather large.
Stay tuned!
Today’s technical analysis will be similar to yesterday’s, as we simply either saw a repeat of the previous indication or the situation developed in tune with them.
Let’s start with what I wrote yesterday about the chart featuring GDXJ (junior miners), GDX (senior miners), GLD (gold), and SLV (silver):
Gold, silver, and miners declined heavily in the past weeks, but it seems that they got too low, too fast, and now a quick rebound seems very likely.
On Friday, junior gold miners once again refused to decline below the $30 level, indicating that a rally was probable, which added to the list of bullish signals for the short term.
Interestingly, junior miners are now the strongest part of the precious metals sector (at least among its popular parts).
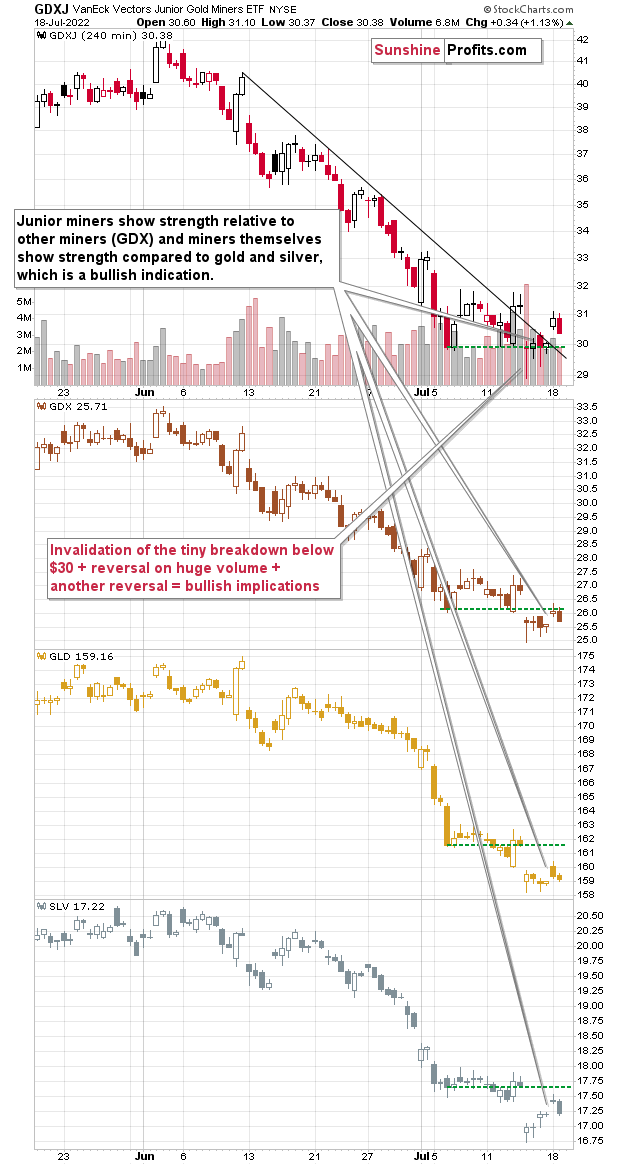
Junior miners (the GDXJ ETF) are the only ones of the above that just closed above their early-July lows. Senior miners (the GDX ETF) are only a little below their own early-July low, but gold (GLD) and silver (SLV) are much below their respective early-July lows.
Why would junior miners be so strong right now? One simple reason – because they had been so weak in the previous weeks. It’s not only a given market that usually (it’s almost always the case) doesn’t go up or down without periodic corrections, but one market’s relative performance to other markets.
So, what we see here, is not necessarily a reflection of junior miners’ “true strength,” but it’s just that since they have fallen the most, they are now bouncing more visibly. That’s likely it. Still, it seems that choosing junior mining stocks as a proxy for our current long position was a good idea.
Either way, the above chart provides us with one additional important detail.
The thing is that the GDXJ closed on Friday just a little below its declining short-term resistance line. The previous attempt to rally above it was invalidated, but given their relative strength, the recent reversals (one formed on huge volume), and the fact that GDXJ was quick to invalidate a tiny breakdown below $30, all suggest that a move higher is just around the corner.
In fact, looking at GDXJ’s [yesterday’s – that was posted on July 18] performance in today’s early London trading, it seems very likely that it will be able to break above the above-mentioned declining resistance line this time.
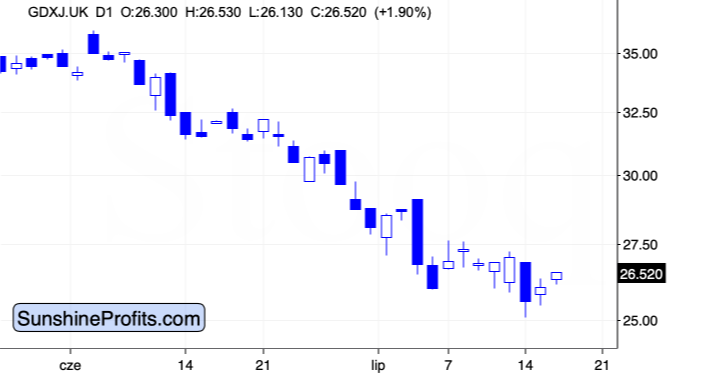
Indeed, the precious metals sector moved higher, and the GDXJ broke above its declining resistance line. When we saw something like that previously, it was immediately followed by another decline (and the breakout was invalidated), but we see signs that this time the breakout will be confirmed and then followed by another rally.
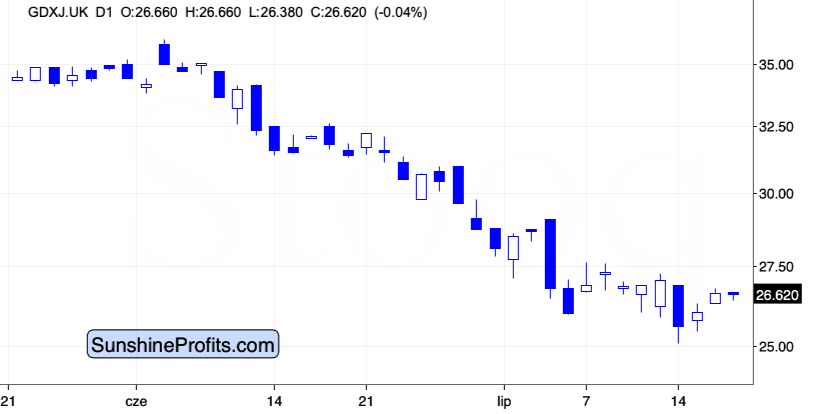
For example, even though gold is trading a bit lower than it was trading when I was preparing yesterday’s analysis, the GDXJ (in London trading) is a bit higher (as you can see on both above charts, it’s now 0.1 higher), so junior miners continue to show strength.
Additionally, the USD Index continues to decline in today’s pre-market trading.
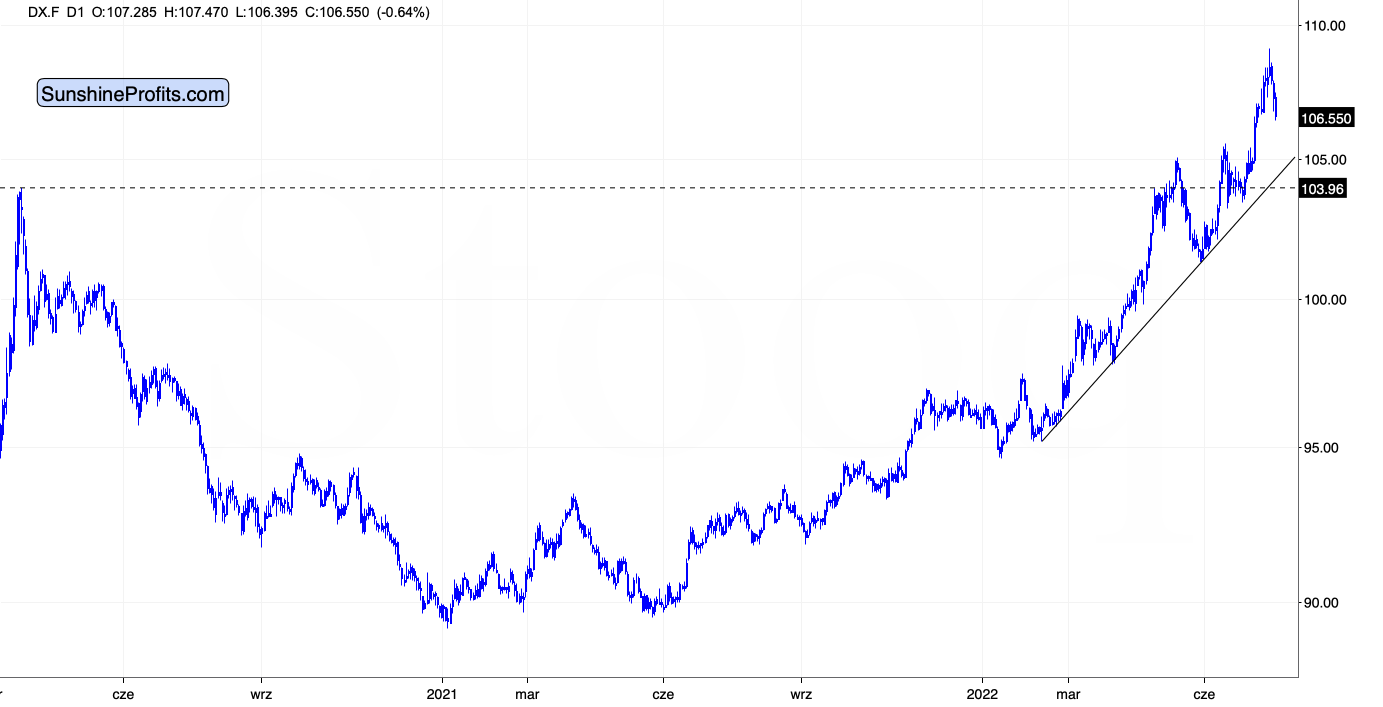
This is in perfect tune with what I wrote previously – the USDX reversed in a big way recently while reaching its long-term resistance.
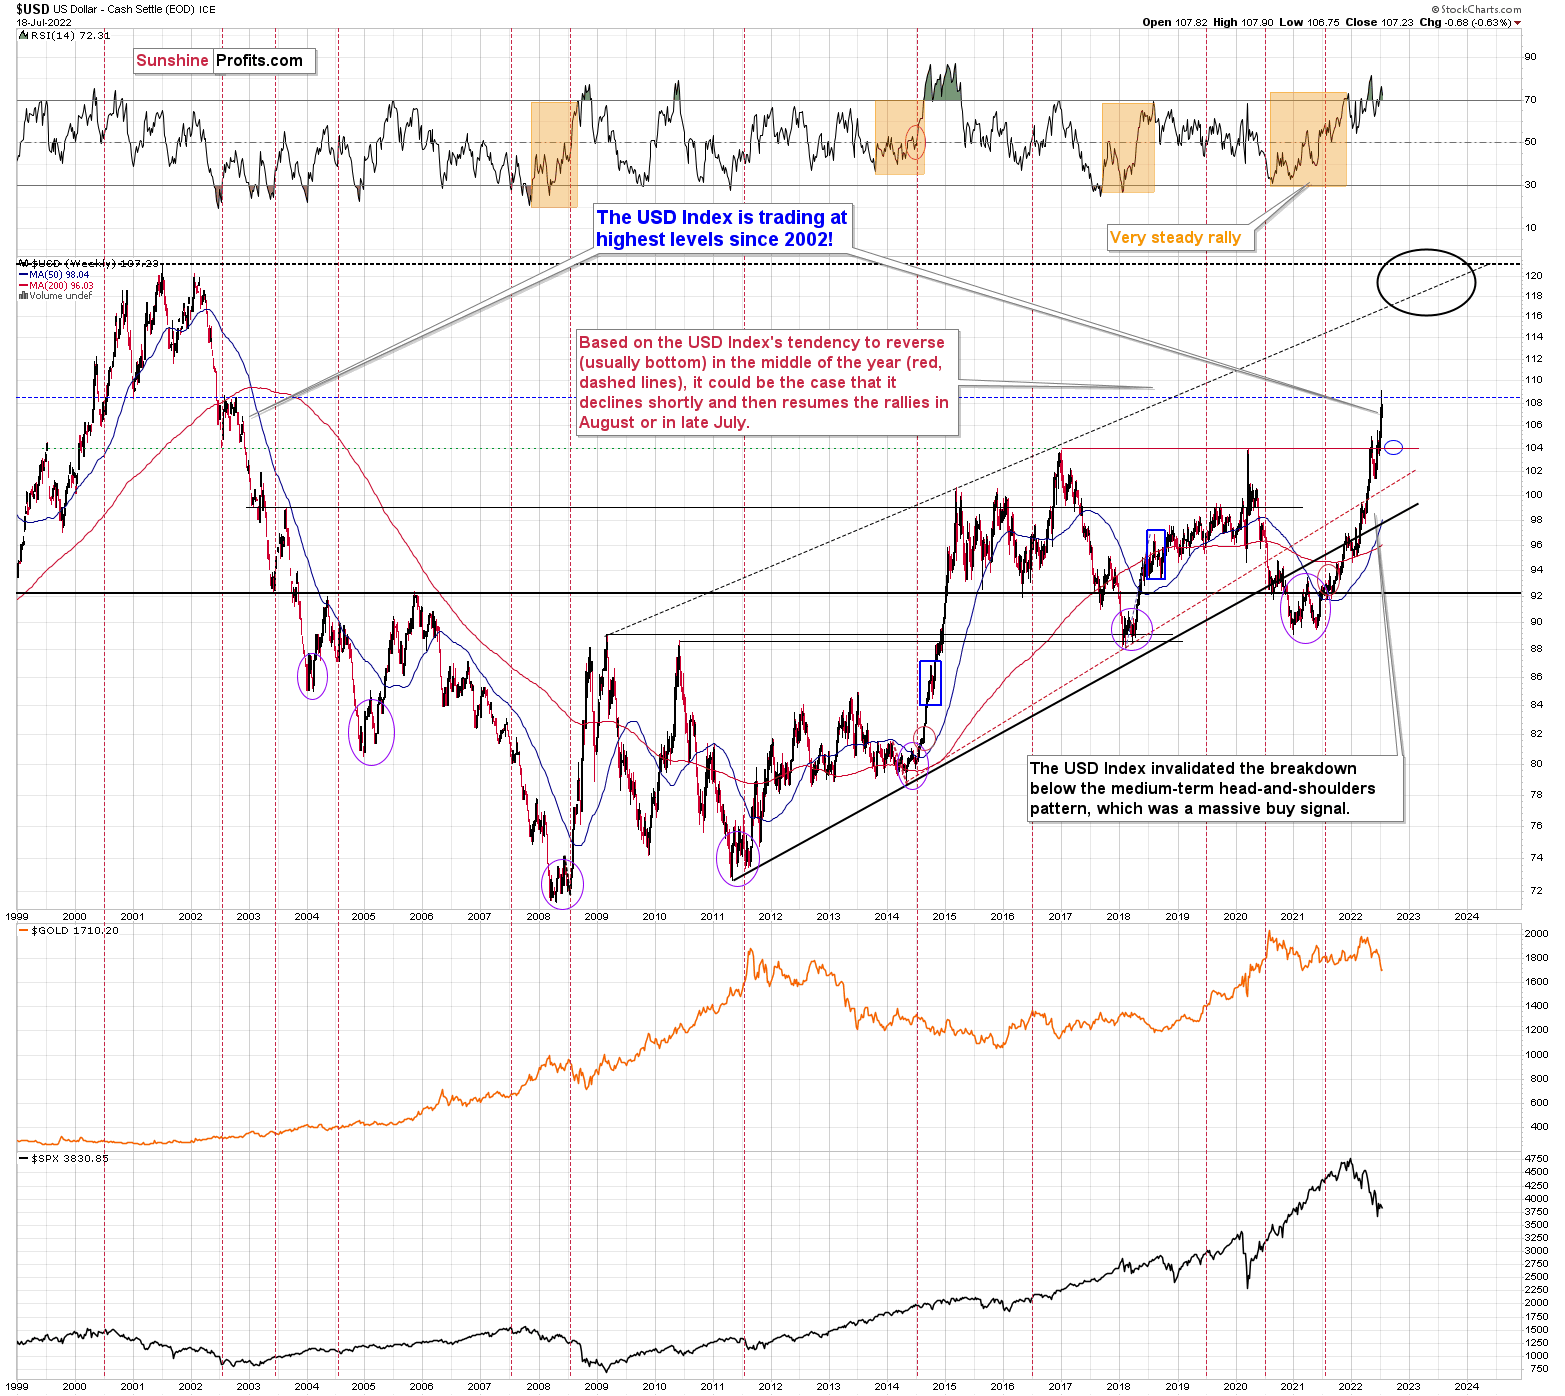
Consequently, my previous comments on the above chart remain up-to-date:
The USD Index has quite likely formed a short-term top here, and it’s now likely to correct. How low would the USD Index be likely to move? Quite possibly to the 104 level or so, as that’s where we have very strong medium-term support. This support level is strengthened by the 1999 high (approximately), the 2002 low, the 2016 high, and the 2020 high – all very important highs.
Additionally, please note that the middle of the year is just around the corner, and that’s when the USD Index usually reverses, and it’s usually the case that those reversals are bottoms. I marked those cases with vertical red dashed lines. So, if the USD Index continues to correct here (and I think that it will), the decline might be rather short-lived.
All in all, it looks like the precious metals sector is going to rally and probably top close to the end of this month as the USD Index pulls back after a sizable rally.
Having said that, let’s take a look at the markets from a more fundamental angle.
Still Bullish
While the GDXJ ETF ended the day in the green, many risk assets suffered material intraday reversals and closed near their lows on Jul. 18. To explain, I wrote before the opening:
Despite the tech wreck in 2022, the information technology and communication services sectors still account for nearly 36% of the S&P 500's movement. Moreover, Apple, Microsoft, Amazon, Alphabet, and Tesla are the five largest companies in the index and account for roughly 22% of the S&P 500's movement. As such, it will be important to monitor the NASDAQ 100 in the days ahead.
Please see below:
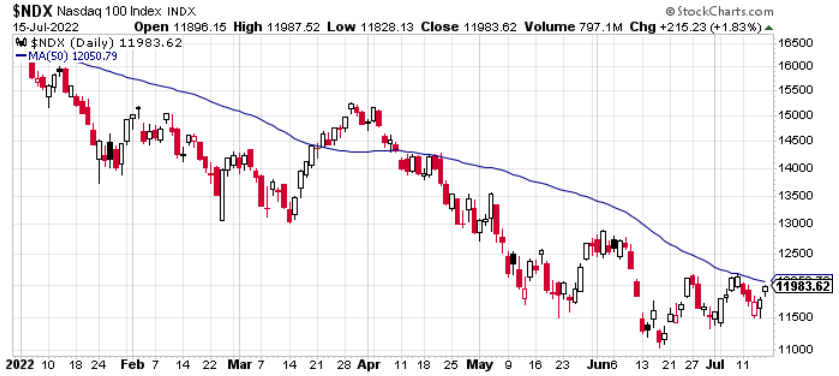
To explain, the candlesticks above track the NASDAQ 100, while the blue line above tracks its 50-day moving average. If you note the price action, you can see that the index has only surpassed its 50-day MA during one bear market rally in 2022. Moreover, with the key level less than 1% above the Jul. 15 close, the spotlight is now on Big Tech. For context, Apple, Microsoft, Amazon, and Tesla account for nearly 37% of the NASDAQ 100’s movement.
Thus, if the NASDAQ 100 recoups its 50-day MA, a realization is bullish for the S&P 500 and the GDXJ ETF.
To that point, while the NASDAQ 100 rallied sharply intraday on Jul. 18, the index sold off in the afternoon and ended the day down by 0.89%.
Please see below:
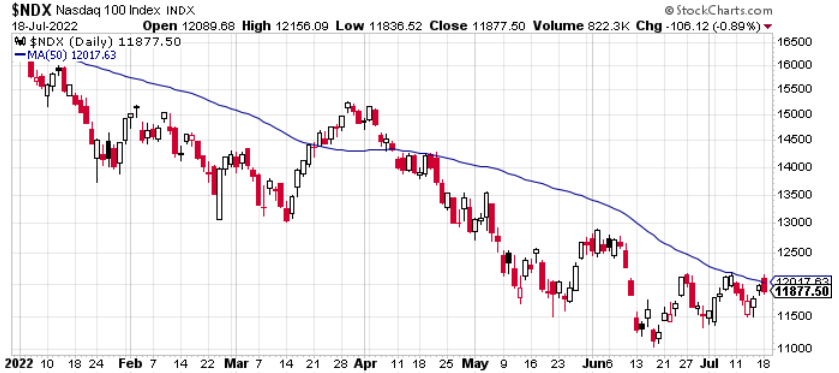
To explain, the red candle furthest to the right highlights how investors bailed on the NASDAQ 100 into the close. In a nutshell: market participants refused to let the index recoup its 50-day MA. Therefore, a shift in sentiment is necessary to keep risk assets uplifted, as optimism is unlikely to reign without Big Tech participating.
However, with investors still positioning for a profoundly bearish outcome, higher prices for the NASDAQ 100, the S&P 500 and the GDXJ ETF remain the path of least resistance.
For example, data from Goldman Sachs Prime Brokerage highlights a record divergence between index-level positioning and stock-specific positioning.
Please see below:
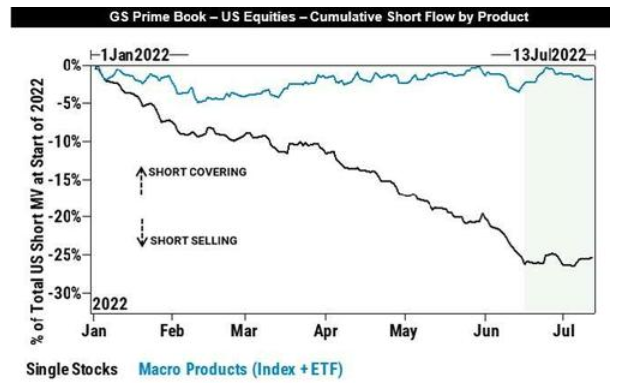 Source: Goldman Sachs
To explain, the light blue line above tracks hedge funds’ short-selling activity across indexes and ETFs, while the dark blue line above tracks their activity across single stocks. If you analyze the right side of the chart, you can see that index positioning is roughly neutral, while stock-specific shorts are near their 2022 highs.
Therefore, if the macroeconomic data or this week’s earnings releases elicit a small bout of optimism, the fundamental fuel could help uplift the NASDAQ 100, the S&P 500, and the GDXJ ETF.
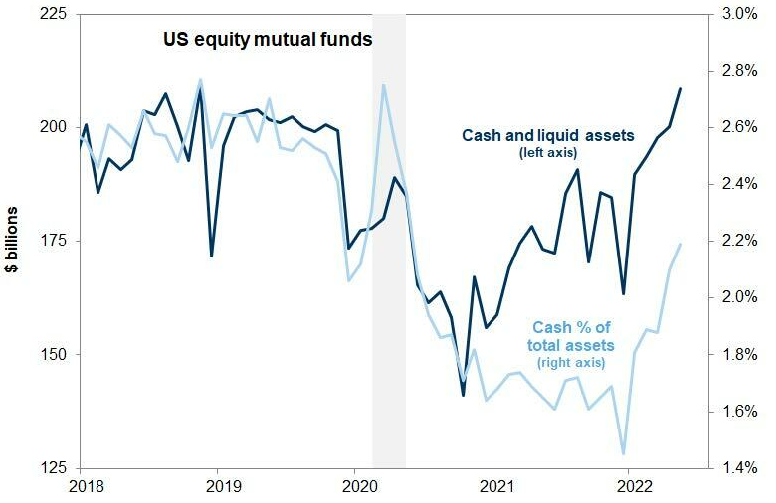
Second, long-only fund managers are sitting on plenty of cash.
Please see below:
 Source: Goldman Sachs
To explain, the dark and light blue lines above track equity mutual funds' cash and liquid assets (including money markets) and those assets as a percentage of their total assets under management (AUM). If you analyze the right side of the chart, you can see that long-only funds have materially increased their cash balances and are nervous about deploying capital. However, if markets break to the upside, FOMO could force mutual fund managers to chase performance and push asset prices even higher.
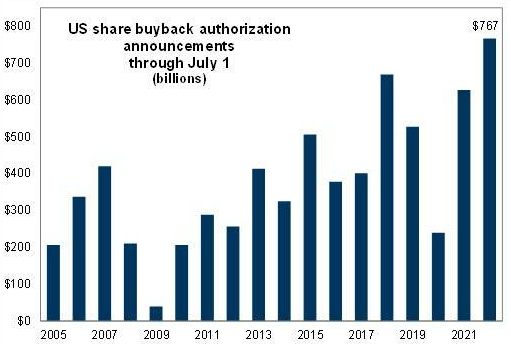
Third, I noted previously that corporations' buyback blackout period ends on Jul. 22. Moreover, with a record $767 billion in 2022 corporate buybacks announced through July, Goldman Sachs told clients: "We expect $300B worth of US Corporate buyback execution in Q3." Therefore, a realization could help keep risk assets elevated over the next few weeks.
Please see below:
 Source: Goldman Sachs
All in all, while the GDXJ ETF outperformed the NASDAQ 100 and the S&P 500 on Jul. 18, equity optimism would likely propel the junior miners even higher. As such, a close above the NASDAQ 100’s 50-day MA should help uplift the PMs in the coming days.
Supply-Side Silliness
While the GDXJ ETF’s short-term outlook is bullish, the medium term is the exact opposite. For example, Fed officials calmed the financial markets by walking back expectations of a 100 basis point rate hike later this month. However, their preference for patience should come back to bite them over the next few months. To explain, I wrote on Mar. 31:
There is a misnomer in the financial markets that inflation is a supply-side phenomenon. In a nutshell: COVID-19 restrictions, labor shortages, and manufacturing disruptions are the reasons for inflation’s reign. As such, when these issues are no longer present, inflation will normalize and the U.S. economy will enjoy a “soft landing.”
However, investors’ faith in the narrative will likely lead to plenty of pain over the medium term. For example, I’ve noted for some time that the U.S. economy remains in a healthy position. And with U.S. consumers flush with cash and a red hot labor market helping to bloat their wallets, their propensity to spend keeps economic data elevated (...).
U.S. households have nearly $3.89 trillion in their checking accounts. For context, this is 288% more than Q4 2019 (pre-COVID-19). As a result, investors misunderstand the amount of demand that’s driving inflation.
Thus, while months have passed and the Consumer Price Index (CPI) keeps hitting new 2022 highs, Fed officials don’t realize that their dovish dispositions will only elongate inflation’s reign.
Goldman Sachs CEO David Solomon said during the company’s Q2 earnings call on Jul. 18:
“We see inflation deeply entrenched in the economy. And what’s unusual about this particular period is that both demand and supply are being affected by exogenous events, namely the pandemic and the war in Ukraine.”
“My dialogue with CEOs operating big global businesses, they tell me that they continue to see persistent inflation in their supply chains. Our economist, meanwhile, say there are signs that inflation will move lower in the second half of the year. The answer is uncertain and we will all be watching it very closely.”
Moreover, while Goldman Sachs economists expect “inflation will move lower in the second half of the year,” the consensus has been making this argument for 24+ months. Therefore, while the CPI should decelerate somewhat in 2022, it doesn’t mean it will decline enough for the Fed to turn dovish.
Please see below:
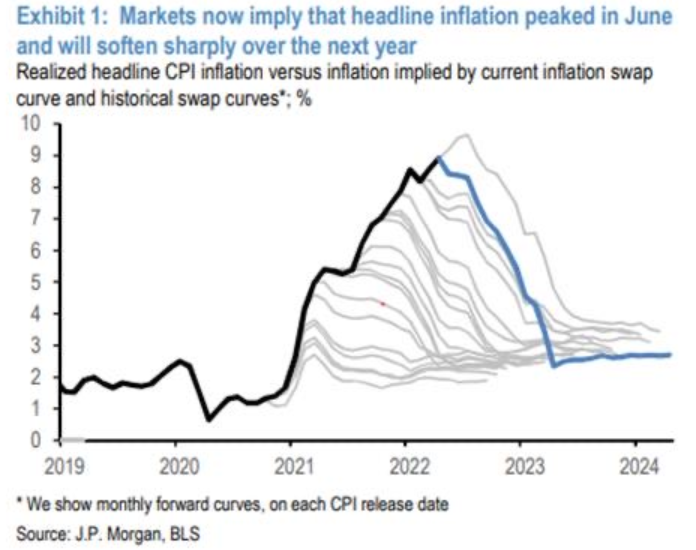
To explain, the black line above tracks the year-over-year (YoY) percentage change in the headline CPI, while the highest gray line above tracks the swap-market-implied trajectory of inflation through 2024. As you can see, swap traders expect inflation to decelerate sharply in the months ahead.
However, if you focus your attention on the other gray lines, you can see that, like the Fed, swap traders have been wrong the whole way up. The other gray lines represent the historical swap curves present throughout 2021 and 2022. Moreover, notice how they were calling for a peak and a sharp deceleration from 3% YoY all the way to 9% YoY.
As a result, investors never understood the drivers of inflation, and they still underestimate the amount of economic pain required to normalize the metric.
For example, Bank of America released its second-quarter earnings on Jul. 18. CEO Brian Moynihan said during the Q2 earnings call:
“U.S. consumers remain quite resilient. First, consumers continue to spend at a healthy pace even as quite some time has passed since the receipt of any stimulus. Second, the overall average deposit balances for most cohorts are higher than they were both last quarter and even rose in June versus May. They remain at multiples above the pre-pandemic levels. And importantly, we’re seeing no deterioration in our customers’ asset quality, and they have the capability to borrow.”
“Our customer data shows Bank of America customers spent the highest quarterly period on record in Q2 at $1.1 trillion in total spending. That's up 12% YoY. This quarter also was the highest debit-spending period on record for us. But as you think about more recently, just to give you the more recent statistics, in June 2022, spending was up 11.3% over June 2021. Transactions also rose more than 6%.”
“For the first two weeks of July, the spending is up 10%, plus in transactions, again, rising 6% plus. This is strong consumer resilience. We continue to see shifts in what people are spending on as the quarter took place more on experiences, travel, and things like that and a bit more on fuel due to increased prices and less on retail stores.”
As a result, while I warned that too much of a good thing is bad, unprecedented fiscal benefits and wage increases will make the Fed’s war on inflation one of attrition.
Please see below:
 Source: Bank of America
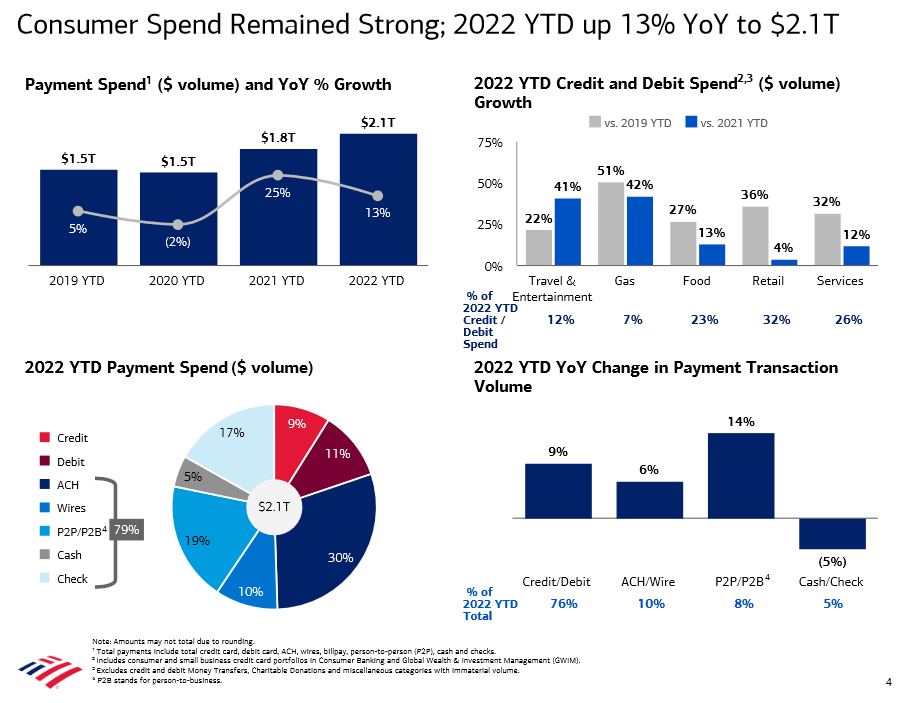
To explain, the data above is a slide from Bank of America’s Q2 earnings presentation. If you analyze the blue bars at the top left, you can see that consumer spending is up 13% YoY YTD in 2022. Likewise, the blue bars at the top right show that consumer spending on travel & entertainment, retail, and services is up by 41%, 4%, and 12% YoY YTD. Moreover, these figures are up by 22%, 36%, and 32% YTD versus 2019 (pre-COVID-19). As a result, does it seem like demand destruction has unfolded?
To that point, while Moynihan said that “this quarter also was the highest debit-spending period on record for us,” I warned on Dec. 23, 2021 that U.S. consumers had a war chest of cash and updated the data on Jun. 10. I wrote:
While the fiscal spending spree may end, U.S. households are flush with cash. U.S. households have nearly $3.54 trillion in their checking accounts. For context, this is 253% more than Q4 2019 (pre-COVID-19)(…).
While some investors expect a dovish 180 from the Fed, they shouldn’t hold their breath. With U.S. economic growth still resilient and the U.S. consumer in much better shape than some portray, the Fed can raise interest rates without crashing the U.S. economy. As a result, Powell will likely stick to his hawkish script and forge ahead with rate hikes in 2022.
Therefore, while the prediction proved prescient, U.S. households, on aggregate, are still flush with cash. For example, the Fed released its Financial Accounts of the United States report on Jun. 9. It revealed that U.S. households have nearly $4.288 trillion in their checking accounts as of the end of Q1. Moreover, the figure is 5.1% higher than Q4:2021.
Please see below:
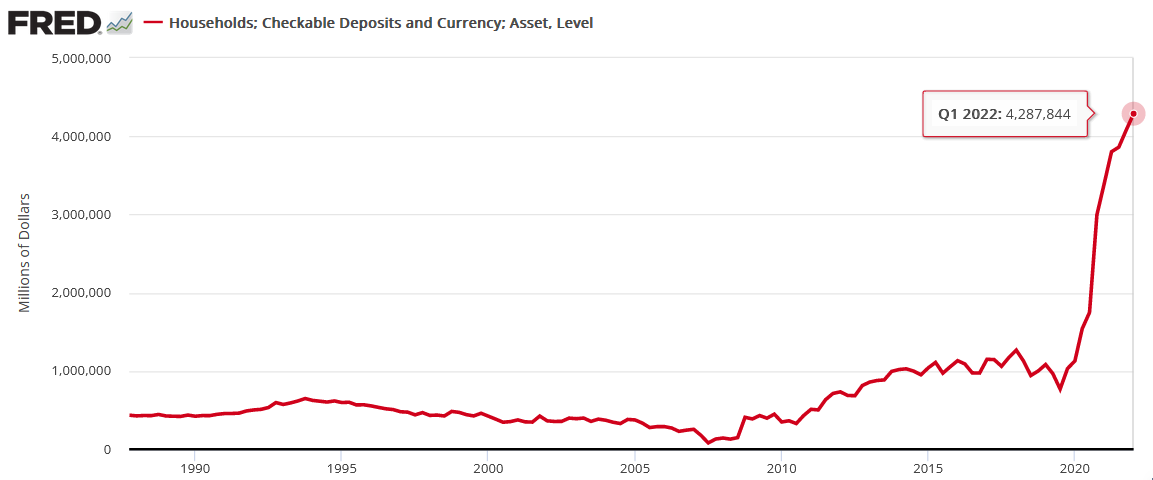
Thus, notice the correlation between record household checkable deposits and Bank of America’s “highest debit-spending period on record” in Q2? Remember, debit card spending comes from consumers’ checking accounts.
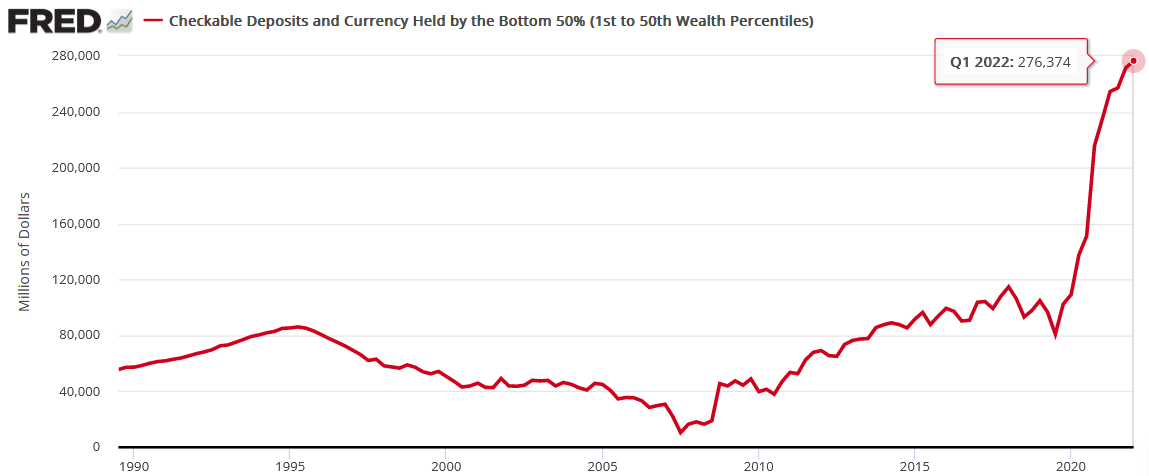
Furthermore, the Fed updated the data by wealth percentile on Jun. 29. Moreover, with the bottom 50% (the poorest Americans) seeing their checking account balances also hit an all-time high in Q1, the inflation bears should learn hard lessons over the medium term.
The Bottom Line
While the NASDAQ 100 may hold the key to how far risk assets can run in the short term, overly bearish positioning should eventually lead to a shift in sentiment. Moreover, with the GDXJ ETF’s technical backdrop profoundly bullish, it may only take a small fundamental spark to ignite the next rally. As a result, the long side offers the highest risk-reward proposition over the next few days/weeks.
In conclusion, the PMs rallied on Jul. 18, and the GDXJ ETF closed higher despite the general stock market’s reversal. Moreover, with Fed officials making another policy error by talking down a 100 basis point rate hike, their uninformed analysis is bullish for the GDXJ ETF because, after July 26-27, the next Fed meeting isn’t until September 20-21. Therefore, if officials want to let inflation bubble, we can profit in the interim.
Overview of the Upcoming Part of the Decline
- It seems to me that we’re going to see a corrective upswing here (probably ending in the final week of July) that will then be followed by a very big decline in the precious metals sector.
- If we see a situation where miners slide in a meaningful and volatile way while silver doesn’t (it just declines moderately), I plan to – once again – switch from short positions in miners to short positions in silver. At this time, it’s too early to say at what price levels this could take place and if we get this kind of opportunity at all – perhaps with gold prices close to $1,600.
- If we see a situation where miners slide in a meaningful and volatile way while silver doesn’t (it just declines moderately), I plan to – once again – switch from short positions in miners to short positions in silver. At this time, it’s too early to say at what price levels this could take place and if we get this kind of opportunity at all – perhaps with gold prices close to $1,600.
- I plan to exit all remaining short positions once gold shows substantial strength relative to the USD Index while the latter is still rallying. This may be the case with gold close to $1,400. I expect silver to fall the hardest in the final part of the move. This moment (when gold performs very strongly against the rallying USD and miners are strong relative to gold after its substantial decline) is likely to be the best entry point for long-term investments, in my view. This can also happen with gold close to $1,400, but at the moment it’s too early to say with certainty.
- The above is based on the information available today, and it might change in the following days/weeks.
You will find my general overview of the outlook for gold on the chart below:
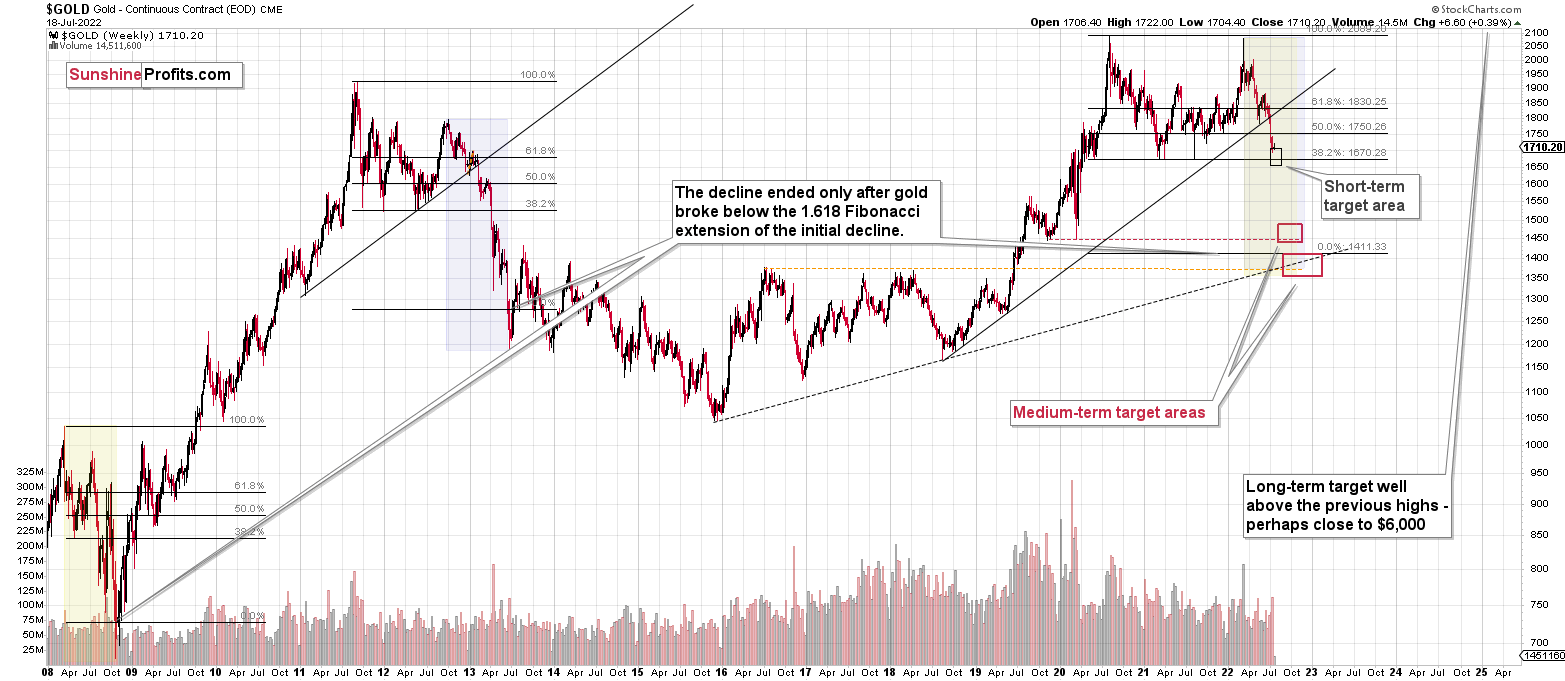
Please note that the above timing details are relatively broad and “for general overview only” – so that you know more or less what I think and how volatile I think the moves are likely to be – on an approximate basis. These time targets are not binding or clear enough for me to think that they should be used for purchasing options, warrants, or similar instruments.
Letters to the Editor
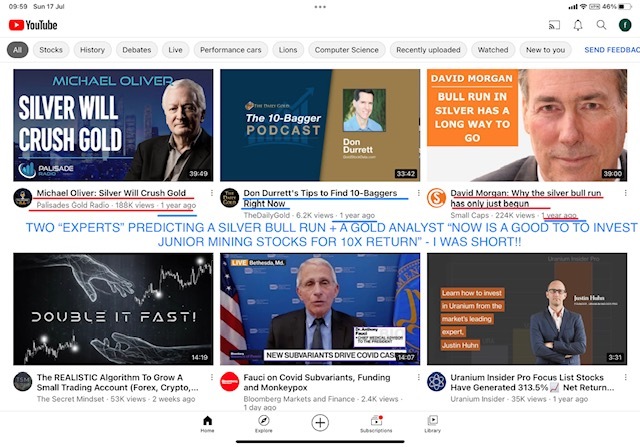
Q: Dear PR,
Below was the YouTube page presented to me today. All of the “experts” got it so wrong. I added the text. I guess that’s what happens when people want free advice. Something is worth exactly what you pay for it. I have a huge admiration for what you have done for me. I am enormously grateful. You said the market would rally last week, so I took a load of other profits from short positions and bought SQQQ. That worked. :D If you have any other observations like that, it would be much appreciated. I intended to buy UUP with a load of cash. If you could indicate when DXY has finished its correction, I’d appreciate it.
PS I hope you are shorting the Polish market. It has TANKED.
A: Thank you for the great feedback, and congratulations on your huge gains! Also, congratulations on the recent gains to everyone who’s reading this and who participated in the trades that I’ve been recently describing.
I’ll strive to remain as objective as possible in order to provide you with the analysis that helps you gain even more in the future.
I’ll definitely keep commenting on the forex market (i.e. the USD Index – DXY). At this time, 104 still seems like the most likely short-term downside target.
Q: I just read an article about PSLV. What I thought was interesting is that the article stated that PSLV is actually backed by physical silver, not paper. The writer said that when, not if, the debt ceiling is raised and if inflation resumes an upside move as a result of the increased spending the gold-silver ratio could possibly go from 80sh to around 20sh. That would result in a significant upside since one can buy so many more ounces of silver than gold. Do you have any thoughts on the reasoning behind this concept?
A: Yes, the PSLV owners claim to have physical silver, and while I haven’t inspected the vaults myself, it seems believable based on the documents that they present. As a reminder to other readers, “the paper silver” refers to something that can’t be held in hand and actually used – like a silver futures contract. It’s something that refers to a future purchase (assuming that there will be enough silver that can be delivered after the contract expires, that is).
Well, the debt ceiling has been raised numerous times in the previous years and it didn’t trigger rallies in the precious metals sector and it was accompanied by all sorts of moves in the gold to silver ratio.
Also, the debt ceiling had been increasing between the early 1980s and the mid 1990s, and you know what happened to the prices of precious metals then? They declined.
So, while raising the debt ceiling is a fundamental factor that contributes to the overall favorable picture for the precious metals market in the long run (in terms of years), it tells nothing about even medium-term price moves, let alone short-term price moves.
The things that are much more likely to impact the gold to silver ratio include geopolitical turmoil (gold reacts much stronger than silver) and the developments in the general stock market (silver has more industrial uses, so it’s more connected with the general stock market than gold is), and I’d pay attention to those instead of focusing on the debt ceiling. By the way, the topic of the latter is rather unexciting because, in my opinion, it will simply be raised whenever the debt grows more – the politicians don’t seem to care about it anymore.
However, even though I don’t think the debt ceiling by itself is a good reason to be investing in anything and it’s not really a useful tool for forecasting moves in the gold to silver ratio, I do think that silver will move higher than gold in the long run – in the next several years, that is – but it will be for other reasons.
Q: Please comment on the intensity of COVID cases increasing, and what could occur in the gold PM market and how it could alter the PM market and your projections. How would this affect the USD? This question is asked in relation to your current PMs’ positions and when gold will reach its low.
A: I see very little impact on the markets, if any, and I don’t see any impact on our current (and following) positions.
As I’ve been writing recently, people are not that concerned with COVID anymore – they are concerned with inflation – and the developments regarding it (and interest rates) are much more important from the investment/trading point of view.
In the chart below (courtesy of Google Trends), you can see how people are losing interest in “covid” as a search phrase.
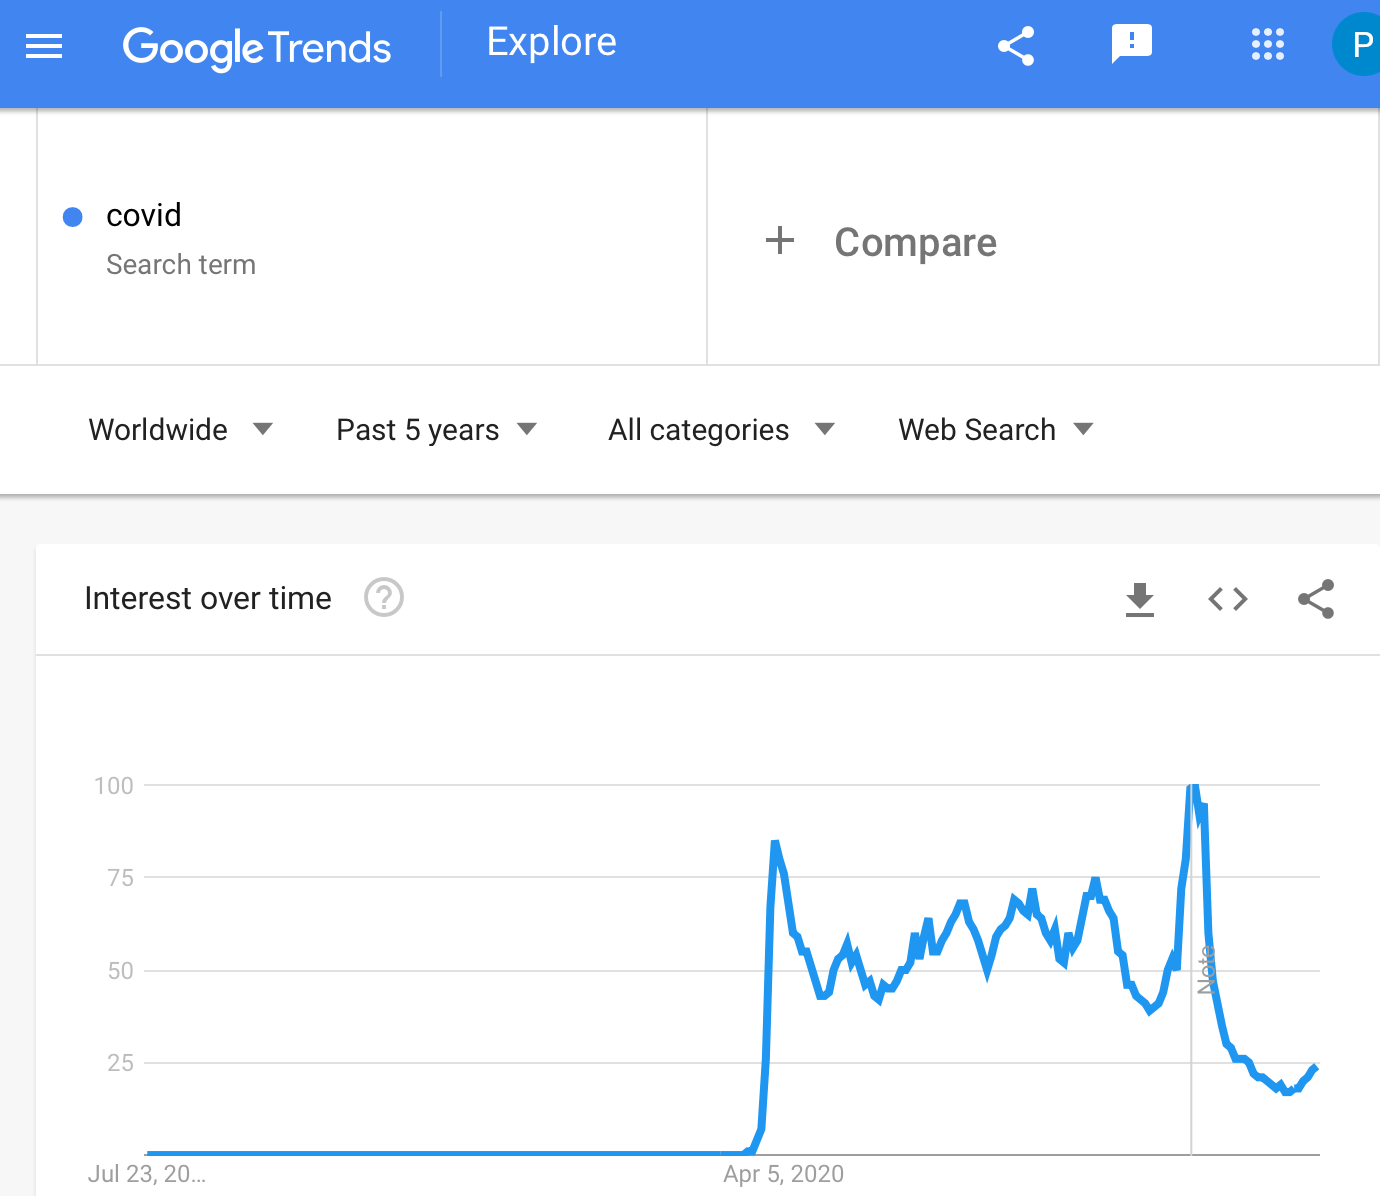
The recent slight upswing didn’t change anything.
On the more fundamental front, while the cases are indeed rising, it’s not really the case with deaths. Charts courtesy of Google.
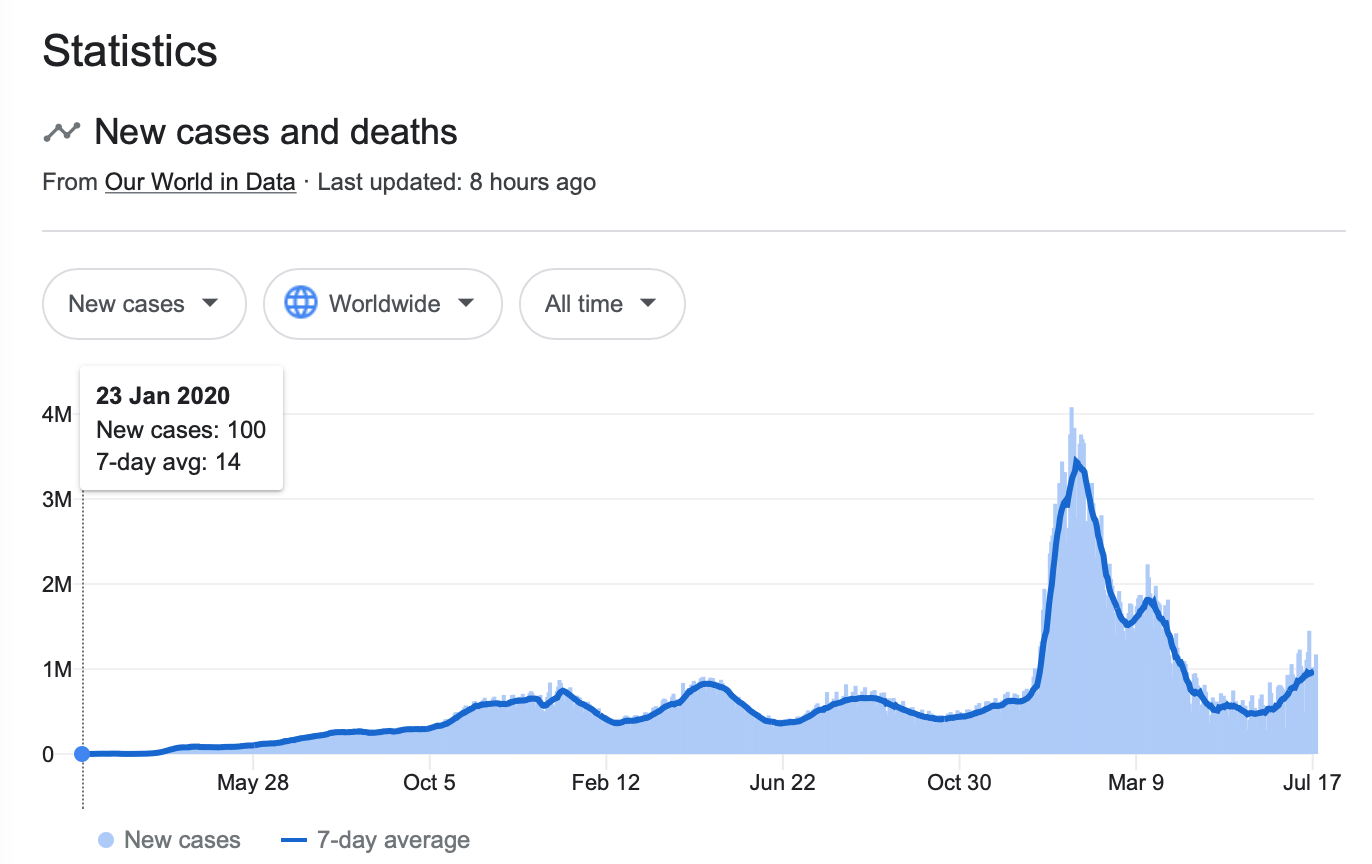
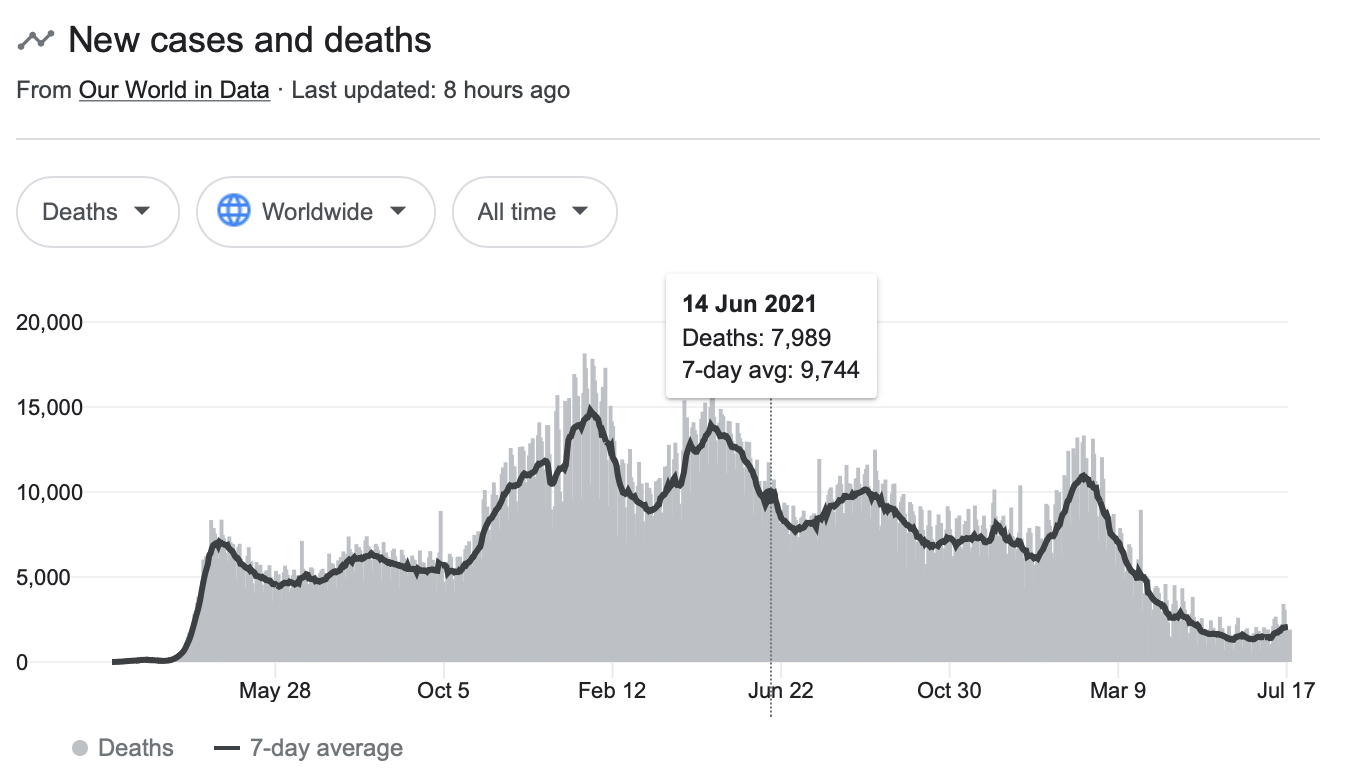
Please keep in mind the way that the “covid deaths” are measured – when someone dies for some reason, but they had COVID, it’s being counted as a “covid death”. Consequently, it’s not necessarily the case that COVID itself is that dangerous at this time, even though statistics still show many deaths – people die for all sorts of reasons, and if some of them have COVID and it increases the chances of death by very little, they would likely die for the original reason, anyway.
The above, on one hand, and the the dire economic situation in the world (the world aims to tackle inflation while not crashing the economy), makes me think that there will be no major consequences of the recent increase in COVID cases. Lockdowns would be too damaging and any extra support money that would need to accompany them would add gasoline to the inflationary fire, which is the opposite of what’s currently being done through higher interest rates.
Yes, it could develop in all sorts of ways, but let’s keep the “beacon indicator” in mind – what would the politicians do if they wanted to avoid the blame and appear as if they were doing what’s good for the people (what the people request)? At this time, people are very concerned with inflation, so that’s what’s likely to be targeted. The media narrative would be likely to “support” the above (by the way, does anyone still believe in free and independent mass media, anymore?).
Administrative Announcement
Due to PR’s travel schedule this week, tomorrow’s technical part will likely be brief, and there will be no technical parts in the Gold & Silver Trading Alerts that are posted on Thursday and Friday this week. The fundamental parts will be posted normally.
However, if anything major happens in the markets and it changes the outlook in the market or makes us think that a change in the trading/investment positions is justified from the risk/reward point of view, we’ll send you a quick intraday Alert.
Most likely, though, the GDXJ will simply move higher this week and, at least initially, next week, correcting the recent powerful decline. Let’s keep in mind that the Fed’s interest rate decision is next week, and that’s when (approximately) PMs and miners could top.
There might be some intraday volatility on Thursday as that’s when we get the initial jobless claims in the U.S. and there’s also the interest rate decision (and press conference) from the ECB. However, I don’t think that it will change the short-term trend, even if the intraday back-and-forth movement is rather large.
Summary
Summing up, it seems that while the medium-term trend in the precious metals sector remains down, we are likely to see a corrective upswing soon. Based on the confirmations that we have seen recently, the short-term outlook is bullish.
In my opinion, the GDXJ will most likely move higher this week and at least initially next week, correcting the recent powerful decline. Let’s keep in mind that the Fed’s interest rate decision is next week, and that’s when (approximately) PMs and miners could top.
There might be some intraday volatility on Thursday as that’s when we get the initial jobless claims in the U.S. and there’s also the interest rate decision (and press conference) from the ECB. However, I don’t think that it will change the short-term trend, even if the intraday back-and-forth movement is rather large.
It seems likely that the profits that we earned from the last couple of trades will increase even further in the near future.
After the final sell-off (that takes gold to about $1,350-$1,500), I expect the precious metals to rally significantly. The final part of the decline might take as little as 1-5 weeks, so it's important to stay alert to any changes.
As always, we'll keep you – our subscribers – informed.
To summarize:
Trading capital (supplementary part of the portfolio; our opinion): Full speculative long positions (200% of the full position) in junior mining stocks are justified from the risk to reward point of view with the following binding exit profit-take price levels:
Mining stocks (price levels for the GDXJ ETF): binding profit-take exit price: $33.87; stop-loss: none (the volatility is too big to justify a stop-loss order in case of this particular trade)
Alternatively, if one seeks leverage, we’re providing the binding profit-take levels for the JNUG (2x leveraged). The binding profit-take level for the JNUG: $36.78; stop-loss for the JNUG: none (the volatility is too big to justify a SL order in case of this particular trade).
For-your-information targets (our opinion; we continue to think that mining stocks are the preferred way of taking advantage of the upcoming price move, but if for whatever reason one wants / has to use silver or gold for this trade, we are providing the details anyway.):
Silver futures upside profit-take exit price: $20.28
SLV profit-take exit price: $18.78
AGQ profit-take exit price: $24.57
Gold futures upside profit-take exit price: $1,776
HGU.TO – alternative (Canadian) 2x leveraged gold stocks ETF – the upside profit-take exit price: $13.46
HZU.TO – alternative (Canadian) 2x leveraged silver ETF – the upside profit-take exit price: $9.18
Long-term capital (core part of the portfolio; our opinion): No positions (in other words: cash)
Insurance capital (core part of the portfolio; our opinion): Full position
Whether you’ve already subscribed or not, we encourage you to find out how to make the most of our alerts and read our replies to the most common alert-and-gold-trading-related-questions.
Please note that we describe the situation for the day that the alert is posted in the trading section. In other words, if we are writing about a speculative position, it means that it is up-to-date on the day it was posted. We are also featuring the initial target prices to decide whether keeping a position on a given day is in tune with your approach (some moves are too small for medium-term traders, and some might appear too big for day-traders).
Additionally, you might want to read why our stop-loss orders are usually relatively far from the current price.
Please note that a full position doesn't mean using all of the capital for a given trade. You will find details on our thoughts on gold portfolio structuring in the Key Insights section on our website.
As a reminder - "initial target price" means exactly that - an "initial" one. It's not a price level at which we suggest closing positions. If this becomes the case (as it did in the previous trade), we will refer to these levels as levels of exit orders (exactly as we've done previously). Stop-loss levels, however, are naturally not "initial", but something that, in our opinion, might be entered as an order.
Since it is impossible to synchronize target prices and stop-loss levels for all the ETFs and ETNs with the main markets that we provide these levels for (gold, silver and mining stocks - the GDX ETF), the stop-loss levels and target prices for other ETNs and ETF (among other: UGL, GLL, AGQ, ZSL, NUGT, DUST, JNUG, JDST) are provided as supplementary, and not as "final". This means that if a stop-loss or a target level is reached for any of the "additional instruments" (GLL for instance), but not for the "main instrument" (gold in this case), we will view positions in both gold and GLL as still open and the stop-loss for GLL would have to be moved lower. On the other hand, if gold moves to a stop-loss level but GLL doesn't, then we will view both positions (in gold and GLL) as closed. In other words, since it's not possible to be 100% certain that each related instrument moves to a given level when the underlying instrument does, we can't provide levels that would be binding. The levels that we do provide are our best estimate of the levels that will correspond to the levels in the underlying assets, but it will be the underlying assets that one will need to focus on regarding the signs pointing to closing a given position or keeping it open. We might adjust the levels in the "additional instruments" without adjusting the levels in the "main instruments", which will simply mean that we have improved our estimation of these levels, not that we changed our outlook on the markets. We are already working on a tool that would update these levels daily for the most popular ETFs, ETNs and individual mining stocks.
Our preferred ways to invest in and to trade gold along with the reasoning can be found in the how to buy gold section. Furthermore, our preferred ETFs and ETNs can be found in our Gold & Silver ETF Ranking.
As a reminder, Gold & Silver Trading Alerts are posted before or on each trading day (we usually post them before the opening bell, but we don't promise doing that each day). If there's anything urgent, we will send you an additional small alert before posting the main one.
Thank you.
Przemyslaw Radomski, CFA
Founder, Editor-in-chief

