

Briefly: in our opinion, full (300% of the regular position size) speculative short positions in junior mining stocks are justified from the risk/reward point of view at the moment of publishing this Alert.
Gold moved slightly higher yesterday and a bit lower in today’s pre-market trading.
In short, nothing changed and practically everything that I wrote yesterday remains up-to-date. As a consequence, the technical part of today’s analysis will be rather short, and I’ll focus on silver.
The white metal moved higher by 0.9% on Monday, which is many times more than gold, which ended the day only 0.01% higher.
In general, when silver outperforms gold on a very short-term basis, it can be viewed as something bearish, as that’s what we observed over and over again (hundreds of times) at local (and more meaningful) tops in the precious metals sector.
Still, the size of the moves was so negligible that the strength of this indication is rather low.
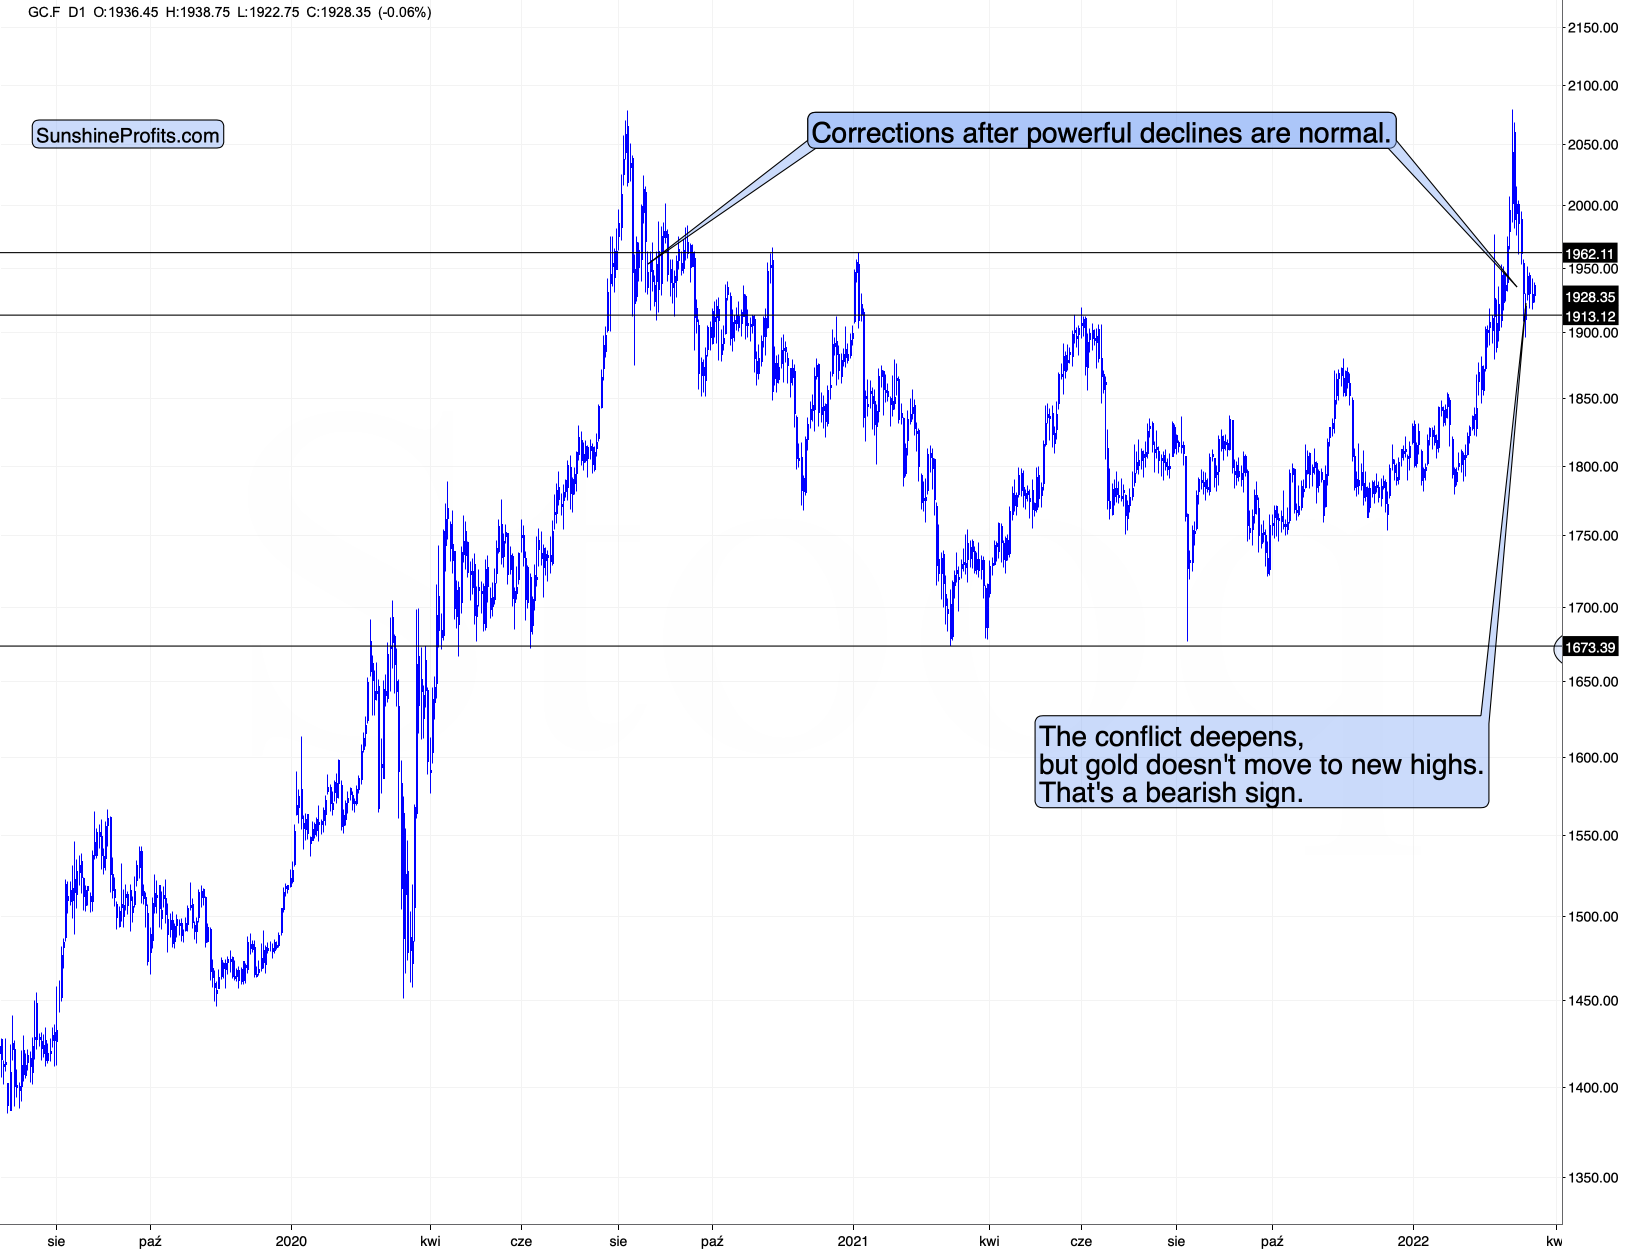
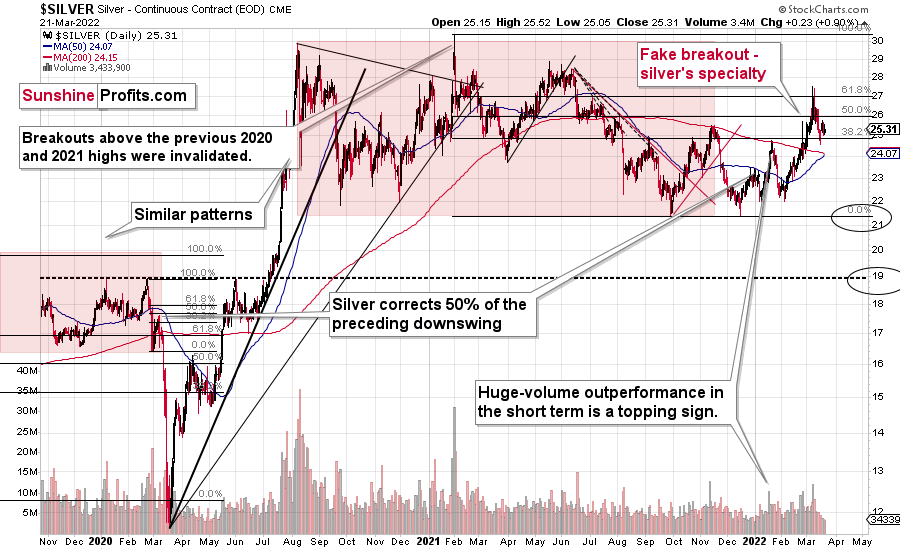
It seems that the previous events are more important than what we saw yesterday. In particular, the fact that silver invalidated its breakout above the 61.8% Fibonacci retracement. It also invalidated the breakout above its late-2021 highs and is now trying to get back above them.
Given silver’s inability to correct more than 61.8% of the preceding decline, it’s likely that the move above the late-2021 highs will not be successful.
Please note that the volume that accompanied the recent correction was low. This suggests that this move higher is just a breather within a decline, not the start of a new powerful uptrend.
The bearish nature of the short-term silver chart above is in tune with the bearish implications of its long-term chart.
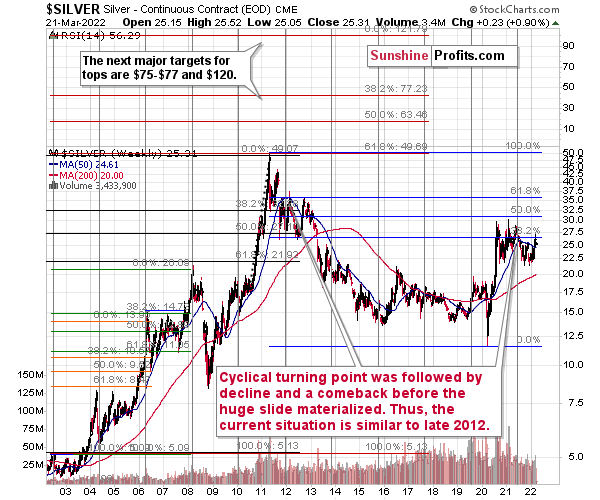
From the long-term point of view, silver corrected about half of the preceding downswing, and this correction culminated at about $30, many months ago. Ever since, silver has been declining, and even the military invasion in Ukraine didn’t cause silver to move above that level.
Interestingly, silver’s decline is in tune with the white metal’s long-term turning point, which marked silver’s mid-2021 top.
It’s also in tune with the analogy of 2011-2013. The situation that we’re currently in is similar to the 2012 top, and this is visible not just in gold and gold stocks, but also in the case of silver.
On the above chart, you can see how silver first topped in 2011, then declined and formed another top at the cyclical turning point. Next, it declined once again – to the previous lows. After that, silver rallied (in 2012 and 2022), and it topped between its 50-week moving average (marked with blue) and the previous top. Now silver is declining in a back-and-forth manner.
Back in 2012, these were just the early days of a gargantuan decline, and the same appears likely to be the case this time. Interest rates are going up after all, and the Fed is determined to quench inflation. Let’s not forget that rising interest rates are likely to negatively impact not just commodities, but practically all industries. This will likely cause silver’s price to decline profoundly, as silver’s industrial demand could be negatively impacted by lower economic growth (or a decline in economic activity). Besides, please note that silver didn’t even manage to rally as much as copper (which tried to move to new highs recently) or most other commodities, thus being rather weak.
All in all, technicals favor a decline in the precious metals sector sooner rather than later.
Having said that, let’s take a look at the market from a more fundamental point of view.
From Bad to Worse
It’s déjà vu all over again. With the PMs still ignoring technicals and fundamentals, their strength on Mar. 21 was akin to mining momentum. To explain, I wrote on Mar. 18:
The weak fundamental outlook that caused gold to underperform the S&P GSCI in early 2022 has only intensified since the Fed meeting. Despite that, momentum investors are following the trend and rallies in crude are sparking rallies in the metals.
To that point, with WTI rallying hard on Mar. 21, the PMs remained elevated despite the sharply deteriorating domestic fundamental environment. However, peak sentiment may have already materialized, with the last (likely) piece of the headline risk puzzle commencing on Mar. 21. To explain, I wrote on Mar. 9:
While picture-perfect scenarios have confronted the PMs in recent weeks, the optimistic headlines are likely near their peak. For example, with U.S. economic sanctions already priced in and only Europe left to consider a Russian import ban, we'll need WW3 to create more headline risk.
Moreover, with WW3 unlikely in my opinion, whispers of a European import ban made the rounds on Mar. 21. As a result, the PMs’ news-based momentum may have received its final jolt.
Please see below:
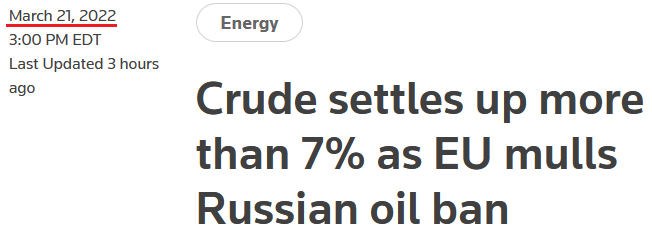 Source: Reuters
Furthermore, as headline risk decelerates, the main drivers of the PMs’ performance should become more important. Likewise, with the PMs’ domestic fundamental outlooks hitting new 2022 lows on Mar. 21, the next few months should elicit sharp drawdowns.
To explain, inflation remains extremely problematic. In fact, while signs of deceleration were present in January, the Russia-Ukraine conflict has supercharged commodities’ fervor and put the Fed in a precarious situation. However, even as Fed officials pivot from no rate hikes to three rate hikes to seven rate hikes, investors are not listening. As a result, market participants are digging their own graves.
Please see below:
 Source: Investing.com
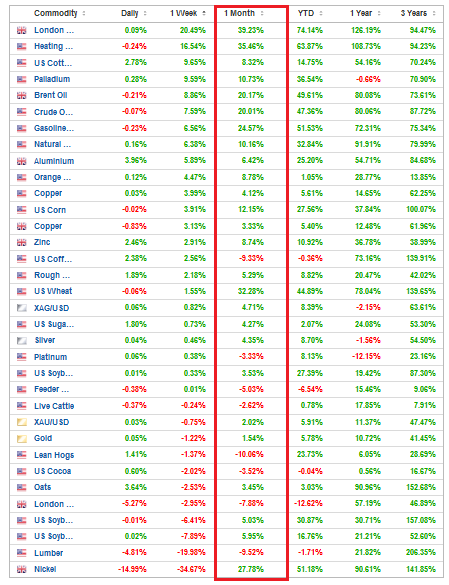
To explain, the table above tracks the performance of various commodities over different periods. If you analyze the vertical red rectangle, you can see that most commodities have rallied over the last month. As a result, investors are ignoring Fed officials’ warnings, as rate hikes help slow economic growth, not accelerate it. Think about it:
- Rate hikes increase borrowing costs and decrease consumers’ disposable income, which reduces demand.
- Less demand results in less consumption and less economic activity.
- Less economic activity results in less demand for commodities.
- Lower commodity demand results in lower commodity prices.
- Lower commodity prices result in lower input prices.
- Lower input prices result in lower output prices (inflation).
Moreover, while officials understand this relationship and hope to achieve this outcome, investors are now fighting the Fed. As such, if (when) the wake-up call materializes, the PMs should suffer profoundly.
As evidence, Fed Chairman Jerome Powell dropped the hawkish hammer on Mar. 21. When asked about inflation peaking this quarter and cooling in the second half of the year, he said:
"That story has already fallen apart. To the extent it continues to fall apart, my colleagues and I may well reach the conclusion we'll need to move more quickly and, if so, we'll do so."
To that point, Powell said that “there’s excess demand" and that "the economy is very strong and is well-positioned to handle tighter monetary policy." As a result, while investors seem to think that Powell’s bluffing, enlightenment will likely materialize over the next few months.
Please see below:
 Source: Reuters
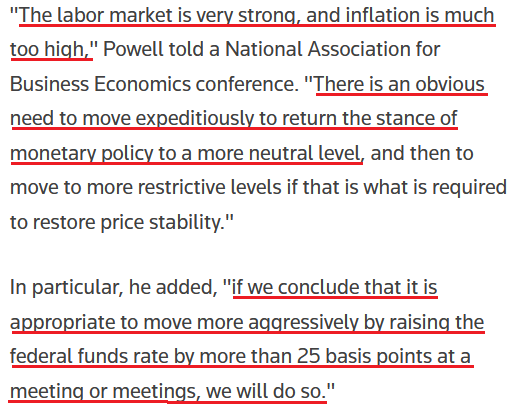
Thus, have you ever seen Powell more hawkish? In addition, notice how he said “at a meeting or meetings” when discussing the potential for “more than” 25 basis point rate hikes. As such, while Minneapolis Fed President Neel Kashkari (a major dove) had expected zero-to-one rate hikes in 2022 when submitting his projections in September, Powell let investors know that the Fed may double up “at a meeting or meetings.” For context, this is what Kashkari wrote on Mar. 18:
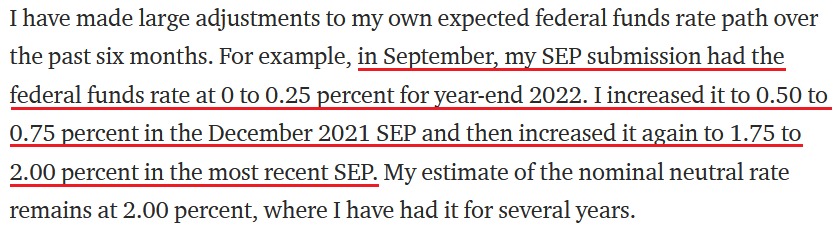 Source: Neel Kashkari/Medium
Furthermore, while some investors seem to think that the Fed will sit idly by and watch inflation rage, the futures market has priced in an 81% chance that the Fed will hike rates by 50 basis points on May 4.
Please see below:
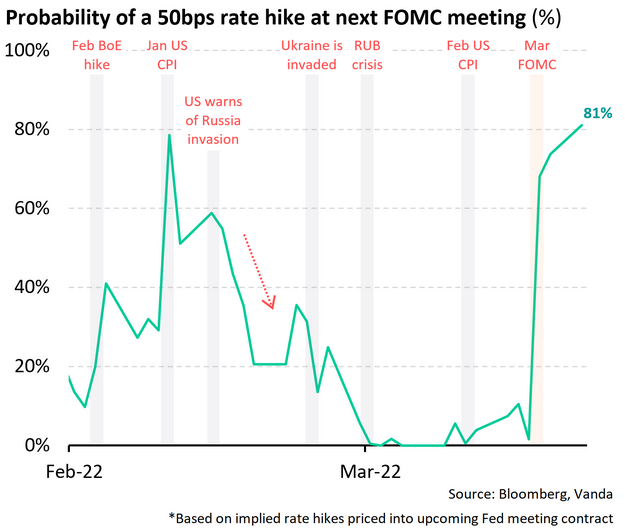
To explain, the green line above tracks the market-implied probability of a 50 basis point rate hike on May 4. While the Russia-Ukraine conflict initially reduced the chance to zero, expectations have risen sharply recently. As a result, if commodity investors don’t listen to Powell and they keep bidding up prices, he’ll have no choice but to follow through with his hawkish threats.
To that point, I noted on Mar. 21 how the PMs are ignoring the materially shifting narrative. I wrote:
While the PMs have ridden the momentum of the Russia-Ukraine conflict, their medium-term fundamentals are worse now than they were in 2021. Back then, the Fed parroted the “transitory” narrative, and the PMs could take solace in their dovish pushback. However, the inflation outlook has worsened in the last few months, and commodities’ fervor is only accelerating the problem. Moreover, when doves like Kashkari turn hawkish, the game has changed. As a result, the PMs may learn this lesson the hard way over the medium term.
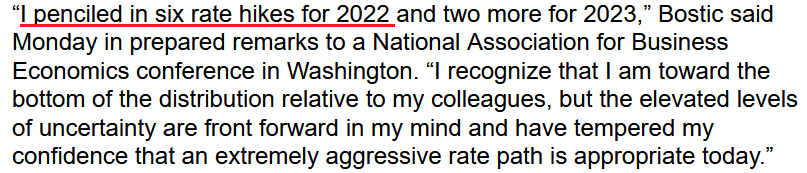
If that wasn’t enough, while Atlanta Fed President Raphael Bostic expects six rate hikes in 2022, his less-than-consensus view is still hawkish relative to where he was three months ago.
Please see below:
 Source: Bloomberg
In addition, he added:
“I am comfortable with more aggressive movements if that is what the data and the evidence suggests is what is appropriate. So I’m not wedded to moving only 25 basis points. I’m not wedded to moving every other meeting. I am going to be very, very open in terms of my approach.”
Thus, while the PMs seem to think that the Fed’s inflation fight won’t impact their medium-term prospects, the reality is that higher real interest rates are needed to reduce inflation. With commodity investors failing to comply, the merry-go-round of higher input prices leading to higher output prices will continue. As a result, the downside risk confronting the PMs is enormous at this point.
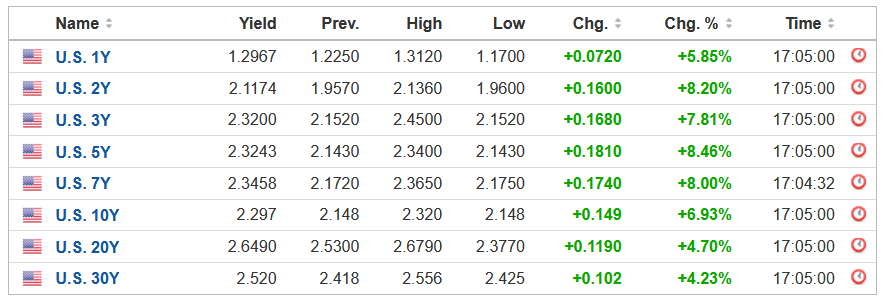
Finally, while the PMs and the general stock market covered their ears on Mar. 21, the bond market heard Powell’s message loud and clear. For example, the U.S. 10-Year Treasury yield closed at a new 2022 high of ~2.30% on Mar. 21. Moreover, the entire U.S. yield curve rallied sharply. As such, since the PMs’ domestic fundamental outlooks have materially worsened during the Russia-Ukraine conflict, they’re likely to suffer profound declines when prices revert to their intrinsic values.
 Source: Investing.com
The bottom line? While Europe's potential import ban helped underwrite another daily rally for crude and other commodities, the higher the prices, the more hawkish the Fed. Since investors don't realize that their short-term bullishness is actually medium-term bearish, epic drawdowns should materialize once sentiment shifts.
Remember, the Fed can only slow inflation by slowing the U.S. economy. That's why Powell keeps referencing a "soft landing" when describing the tradeoff between calming inflation and maintaining growth. However, with continued inflation of 8%+ likely to push the U.S. into recession, Powell knows that doing nothing is as bad as doing too much. As a result, investors should eventually learn that Powell's dovish days are over.
In conclusion, the PMs rallied on Mar. 21, as the Russia-Ukraine conflict still garners all of investors' attention. However, it's remarkable how much the PMs' domestic fundamental outlooks have deteriorated in recent weeks. With Fed officials more hawkish now than at any point in 2021, their fight with inflation is bullish for the USD Index and U.S. Treasury yields, not the PMs. As a result, don't be surprised if (when) a flash crash materializes.
Overview of the Upcoming Part of the Decline
- It seems to me that the corrective upswing is now over or very close to being over , and that gold, silver, and mining stocks are now likely to continue their medium-term decline.
- It seems that the first (bigger) stop for gold will be close to its previous 2021 lows, slightly below $1,800 . Then it will likely correct a bit, but it’s unclear if I want to exit or reverse the current short position based on that – it depends on the number and the nature of the bullish indications that we get at that time.
- After the above-mentioned correction, we’re likely to see a powerful slide, perhaps close to the 2020 low ($1,450 - $1,500).
- If we see a situation where miners slide in a meaningful and volatile way while silver doesn’t (it just declines moderately), I plan to – once again – switch from short positions in miners to short positions in silver. At this time, it’s too early to say at what price levels this could take place, and if we get this kind of opportunity at all – perhaps with gold close to $1,600.
- I plan to exit all remaining short positions once gold shows substantial strength relative to the USD Index while the latter is still rallying. This may be the case with gold close to $1,350 - $1,400. I expect silver to fall the hardest in the final part of the move. This moment (when gold performs very strongly against the rallying USD and miners are strong relative to gold after its substantial decline) is likely to be the best entry point for long-term investments, in my view. This can also happen with gold close to $1,375, but at the moment it’s too early to say with certainty.
- As a confirmation for the above, I will use the (upcoming or perhaps we have already seen it?) top in the general stock market as the starting point for the three-month countdown. The reason is that after the 1929 top, gold miners declined for about three months after the general stock market started to slide. We also saw some confirmations of this theory based on the analogy to 2008. All in all, the precious metals sector is likely to bottom about three months after the general stock market tops.
- The above is based on the information available today, and it might change in the following days/weeks.
You will find my general overview of the outlook for gold on the chart below:
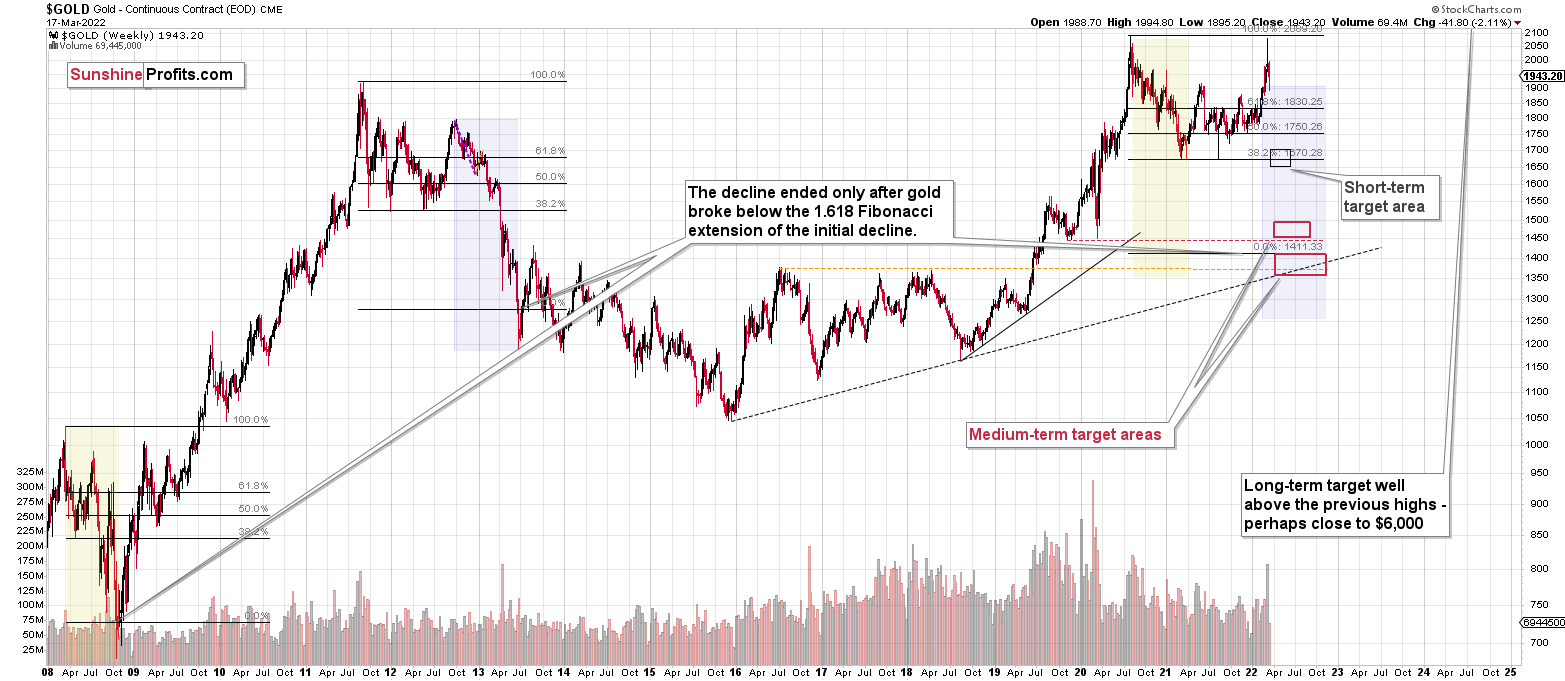
Please note that the above timing details are relatively broad and “for general overview only” – so that you know more or less what I think and how volatile I think the moves are likely to be – on an approximate basis. These time targets are not binding or clear enough for me to think that they should be used for purchasing options, warrants or similar instruments.
Summary
Summing up, despite the recent rally in gold, the outlook for junior mining stocks remains exactly as I described previously.
Crude oil’s extreme outperformance, the stock market’s weakness, and critical medium-term resistance levels reached by gold (all-time high!) and junior mining stocks, all indicate that the tops are at hand or have just formed. The huge-volume reversals in gold and (especially) mining stocks, along with silver’s short-term outperformance, all point to lower precious metals prices in the following days/weeks. It seems that the top is in.
Investing and trading are difficult. If it was easy, most people would be making money – and they’re not. Right now, it’s most difficult to ignore the urge to “run for cover” if you physically don’t have to. The markets move on “buy the rumor and sell the fact.” This repeats over and over again in many (all?) markets, and we have direct analogies to similar situations in gold itself. Junior miners are likely to decline the most, also based on the massive declines that are likely to take place (in fact, they have already started) in the stock markets.
From the medium-term point of view, the two key long-term factors remain the analogy to 2013 in gold and the broad head and shoulders pattern in the HUI Index. They both suggest much lower prices ahead.
It seems that our profits from short positions are going to become truly epic in the coming months.
After the sell-off (that takes gold to about $1,350-$1,500), I expect the precious metals to rally significantly. The final part of the decline might take as little as 1-5 weeks, so it's important to stay alert to any changes.
Most importantly, please stay healthy and safe. We made a lot of money last March and this March, and it seems that we’re about to make much more in the upcoming decline, but you have to be healthy to enjoy the results.
As always, we'll keep you - our subscribers - informed.
To summarize:
Trading capital (supplementary part of the portfolio; our opinion): Full speculative short positions (300% of the full position) in junior mining stocks are justified from the risk to reward point of view with the following binding exit profit-take price levels:
Mining stocks (price levels for the GDXJ ETF): binding profit-take exit price: $34.63; stop-loss: none (the volatility is too big to justify a stop-loss order in case of this particular trade)
Alternatively, if one seeks leverage, we’re providing the binding profit-take levels for the JDST (2x leveraged) and GDXD (3x leveraged – which is not suggested for most traders/investors due to the significant leverage). The binding profit-take level for the JDST: $14.98; stop-loss for the JDST: none (the volatility is too big to justify a SL order in case of this particular trade); binding profit-take level for the GDXD: $25.48; stop-loss for the GDXD: none (the volatility is too big to justify a SL order in case of this particular trade).
For-your-information targets (our opinion; we continue to think that mining stocks are the preferred way of taking advantage of the upcoming price move, but if for whatever reason one wants / has to use silver or gold for this trade, we are providing the details anyway.):
Silver futures downside profit-take exit price: $19.12
SLV profit-take exit price: $17.72
ZSL profit-take exit price: $38.28
Gold futures downside profit-take exit price: $1,683
HGD.TO – alternative (Canadian) inverse 2x leveraged gold stocks ETF – the upside profit-take exit price: $11.79
HZD.TO – alternative (Canadian) inverse 2x leveraged silver ETF – the upside profit-take exit price: $29.48
Long-term capital (core part of the portfolio; our opinion): No positions (in other words: cash
Insurance capital (core part of the portfolio; our opinion): Full position
Whether you already subscribed or not, we encourage you to find out how to make the most of our alerts and read our replies to the most common alert-and-gold-trading-related-questions.
Please note that we describe the situation for the day that the alert is posted in the trading section. In other words, if we are writing about a speculative position, it means that it is up-to-date on the day it was posted. We are also featuring the initial target prices to decide whether keeping a position on a given day is in tune with your approach (some moves are too small for medium-term traders, and some might appear too big for day-traders).
Additionally, you might want to read why our stop-loss orders are usually relatively far from the current price.
Please note that a full position doesn't mean using all of the capital for a given trade. You will find details on our thoughts on gold portfolio structuring in the Key Insights section on our website.
As a reminder - "initial target price" means exactly that - an "initial" one. It's not a price level at which we suggest closing positions. If this becomes the case (like it did in the previous trade), we will refer to these levels as levels of exit orders (exactly as we've done previously). Stop-loss levels, however, are naturally not "initial", but something that, in our opinion, might be entered as an order.
Since it is impossible to synchronize target prices and stop-loss levels for all the ETFs and ETNs with the main markets that we provide these levels for (gold, silver and mining stocks - the GDX ETF), the stop-loss levels and target prices for other ETNs and ETF (among other: UGL, GLL, AGQ, ZSL, NUGT, DUST, JNUG, JDST) are provided as supplementary, and not as "final". This means that if a stop-loss or a target level is reached for any of the "additional instruments" (GLL for instance), but not for the "main instrument" (gold in this case), we will view positions in both gold and GLL as still open and the stop-loss for GLL would have to be moved lower. On the other hand, if gold moves to a stop-loss level but GLL doesn't, then we will view both positions (in gold and GLL) as closed. In other words, since it's not possible to be 100% certain that each related instrument moves to a given level when the underlying instrument does, we can't provide levels that would be binding. The levels that we do provide are our best estimate of the levels that will correspond to the levels in the underlying assets, but it will be the underlying assets that one will need to focus on regarding the signs pointing to closing a given position or keeping it open. We might adjust the levels in the "additional instruments" without adjusting the levels in the "main instruments", which will simply mean that we have improved our estimation of these levels, not that we changed our outlook on the markets. We are already working on a tool that would update these levels daily for the most popular ETFs, ETNs and individual mining stocks.
Our preferred ways to invest in and to trade gold along with the reasoning can be found in the how to buy gold section. Furthermore, our preferred ETFs and ETNs can be found in our Gold & Silver ETF Ranking.
As a reminder, Gold & Silver Trading Alerts are posted before or on each trading day (we usually post them before the opening bell, but we don't promise doing that each day). If there's anything urgent, we will send you an additional small alert before posting the main one.
Thank you.
Przemyslaw Radomski, CFA
Founder, Editor-in-chief

