

Briefly: in our opinion, full (300% of the regular position size) speculative short positions in junior mining stocks are justified from the risk/reward point of view at the moment of publishing this Alert.
Yesterday’s session was nothing particularly new except for silver’s performance, which is what I will focus on in my analysis of it today.
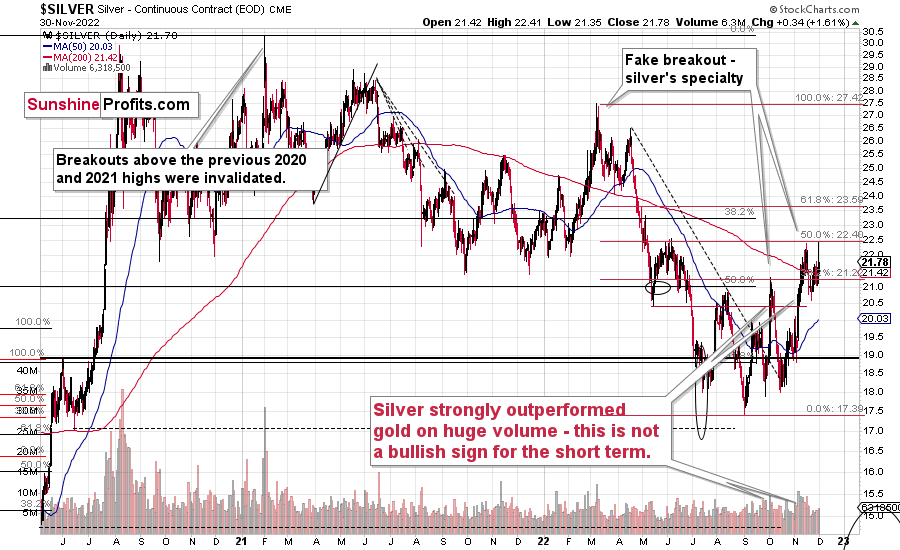
The silver market truly soared on an intraday basis, especially relative to gold. This is what we most often see at the tops or very close to them.
The reason is that the silver market is much smaller than the gold market is, and in addition to the above (and in relation to it), silver is much more popular with the investment public. The latter tends to buy close to the tops and sell close to the bottoms. Consequently, the particularly strong performance of the white metal indicates that the investment public is “buying like crazy,” and this, in turn, is a sign that a top is being formed. That’s what we saw yesterday.
Interestingly, silver’s rally yesterday was accompanied by yet another daily rally in the main stock indices. The S&P 500 moved above 4,000 once again, especially initially, and it was during this sharp rally that silver rallied the most. This tells us that perhaps similar buyers (the investment public) were buying stocks, and it serves as a small indication that stocks might have topped as well (or that they top in stocks could be just around the corner).
Technically, it was yet another move to the 50% Fibonacci retracement, so it didn’t change anything. The only new indication was gold’s outperformance, and it has bearish implications.
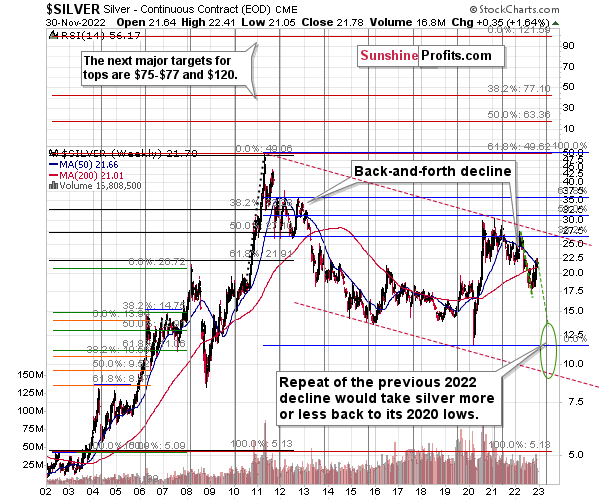
When looking at silver from a long-term point of view, it’s still obvious that the recent move higher was most likely just a corrective upswing.
What happens after corrections are over (as indicated by, i.e., silver’s outperformance)? The previous trend resumes. The previous trend was down, so that’s where silver is likely headed next.
Besides, the long-term turning point for silver is due in several months, and if silver repeats its previous 2022 decline, then it will bottom close to the turning point and also close to its 2020 low – in the first half of 2023.
It’s likely to repeat its previous 2022, because that’s what tends to happen after flag patterns, and what you see on silver’s short-term chart between September and yesterday appears to be a flag pattern.
Consequently, the current silver price forecast remains bearish, as does the outlook for the rest of the precious metals sector.
Meanwhile, let’s not forget that it’s the turn of the month and that it has important implications for the USD Index, which, in turn, has important implications for the precious metals market.
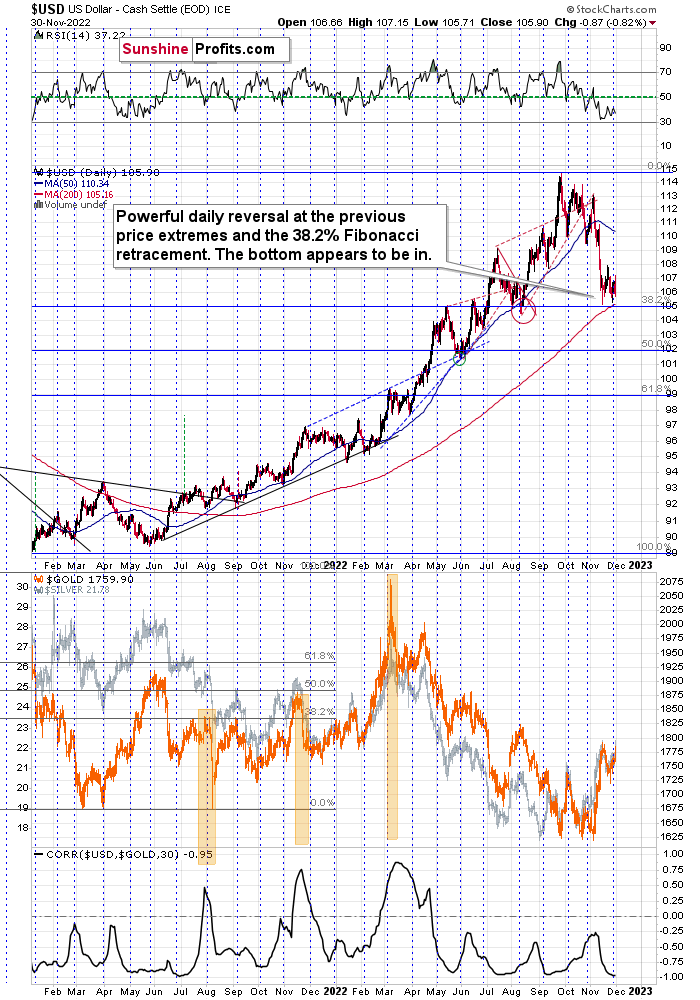
I talked about the above yesterday, but given yesterday’s and today’s pre-market declines in the USD Index, the above deserves to be emphasized once again.
At the moment of writing these words, the USD Index is once again testing its 38.2% Fibonacci retracement and most likely forming a broad bottom, just like what we saw in mid-2021.
The previous move was definitely to the downside, which means that the monthly turning point is pointing to higher USD Index values in the near term.
All in all, it seems that we won’t have to wait too long for the start of another powerful downswing in the precious metals market. And yes, I continue to think that the junior mining stocks will decline the most during this huge move lower.
Having said that, let’s take a look at the markets from a more fundamental point of view.
Gold Hears What It Wants
While Fed officials have reiterated their hawkish message in recent weeks, investors waited patiently for Powell to speak on Nov. 30; and with the crowd often hearing what they want to hear, a largely immaterial passage was enough to incite substantial optimism. Powell said:
“It makes sense to moderate the pace of our rate increases as we approach the level of restraint that will be sufficient to bring inflation down. The time for moderating the pace of rate increases may come as soon as the December meeting.”
Thus, while I’ve noted numerous times that no one expected 75 basis point rate hikes to continue in perpetuity, the crowd has run with a false narrative that smaller rate hikes are akin to rate cuts. So, with sentiment overpowering the fundamentals, risk assets rose sharply on Nov. 30.
Please see below:
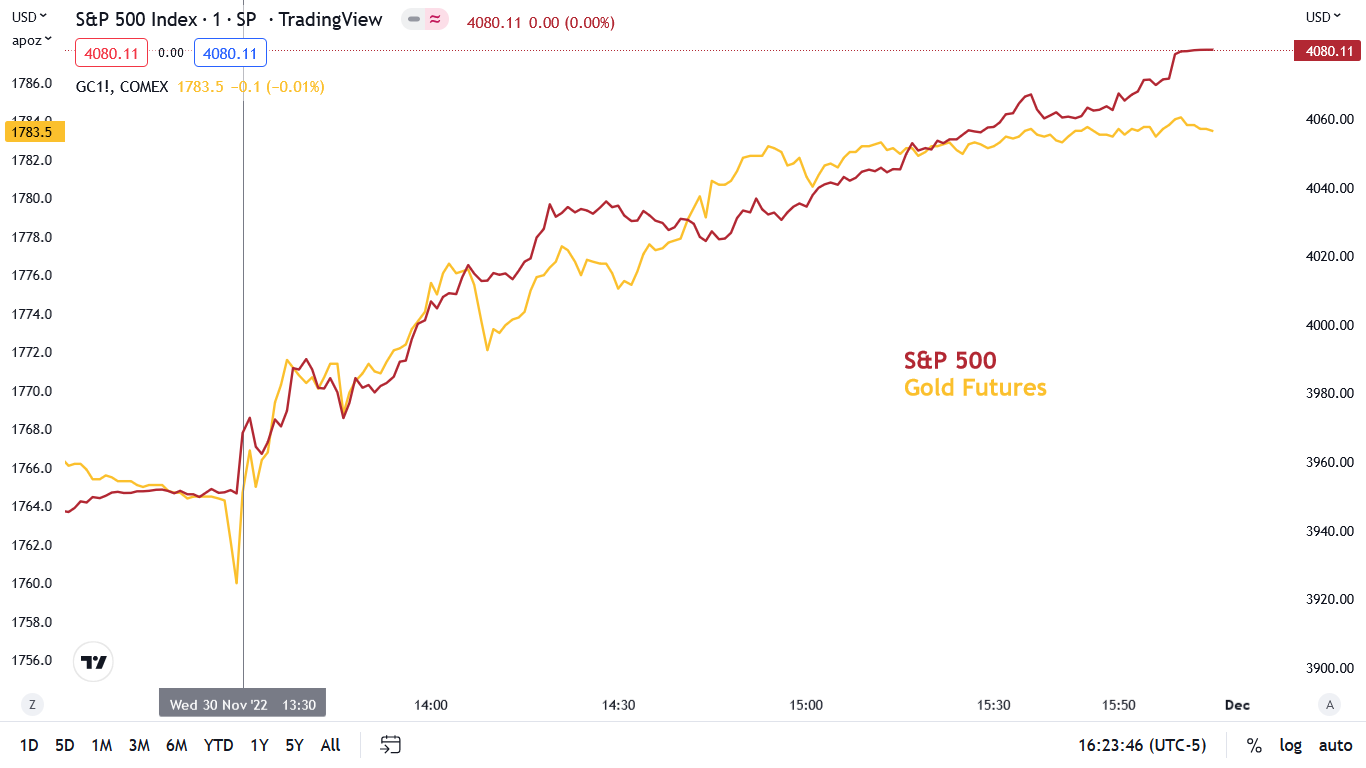
To explain, the red line above tracks the one-minute movement of the S&P 500, while the gold line above tracks the one-minute movement of the gold futures price. If you analyze the vertical gray line on the left, you can see that short squeezes reigned when Powell began speaking at 1:30 p.m. ET.
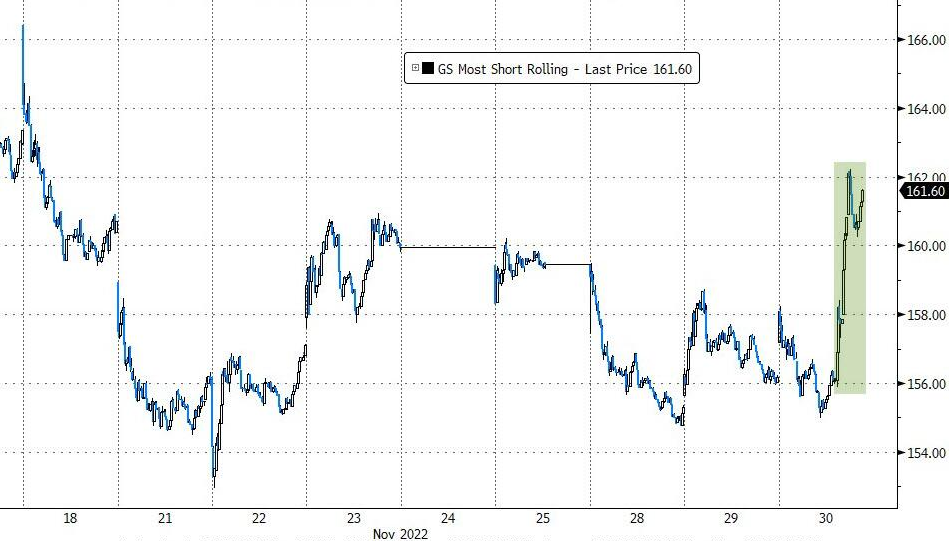
As further evidence, Goldman Sachs’ basket of the most shorted stocks rose substantially on Nov. 30, which highlighted investors’ knee-jerk reaction to Powell’s comments.
Please see below:
 Source: Bloomberg/ZeroHedge
To explain, the blue line above tracks Goldman Sachs’ basket of the most shorted stocks, and the vertical ascent on the right side of the chart depicts the magnitude of the daily squeeze. Therefore, the price action on Nov. 30 was much less bullish than it seemed.
To that point, while the consensus wants to create the fundamentals rather than accept them, Powell behaved exactly as expected. For example, if inflation dissipates, the Fed will turn dovish. If not, the central bank will remain hawkish. It’s the worst-kept secret, and was the case throughout 2021 and 2022. Yet, the crowds’ belief that the job is nearly done is where they miss the mark. Powell added:
“Given our progress in tightening policy, the timing of that moderation is far less significant than the questions of how much further we will need to raise rates to control inflation, and the length of time it will be necessary to hold policy at a restrictive level.”
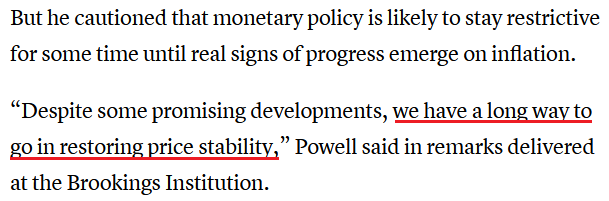
“It is likely that restoring price stability will require holding policy at a restrictive level for some time. History cautions strongly against prematurely loosening policy. We will stay the course until the job is done.”
As a result, while investors chose to prioritize Powell's December remark rather than his overall point, the reality is that plenty of hard work confronts the Fed and the financial markets in the months ahead.
Please see below:
 Source: CNBC
On top of that:
 Source: CNBC
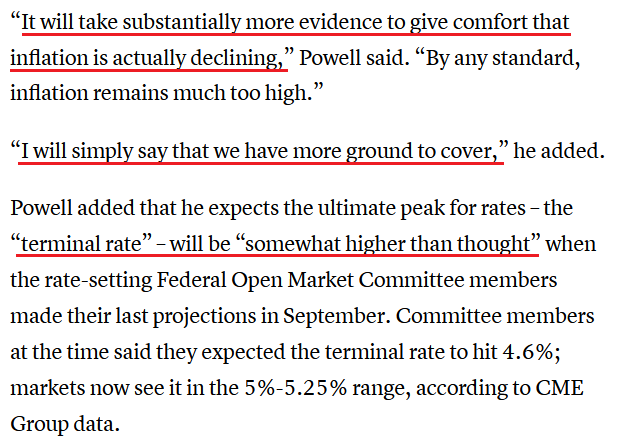
So, while risk assets boarded the bullish train on Nov. 30, the narrative pushing the gold price higher is built on a faulty foundation; and despite the notion that the Fed is near a pivot, the reality is that the FOMC’s peak U.S. federal funds rate (FFR) projection keeps increasing.
As such, while sentiment is powerful in the short term, the medium-term fundamentals remain highly alarming. With growth, inflation, employment and consumer spending still extremely resilient, the consensus underestimates this inflation fight. Consequently, our 2023 FFR estimate of 4.5% to 5.5% should prove too low when it’s all said and done.
Silver Wasn’t Nice
After a major short squeeze helped propel the silver price higher on Nov. 30, the white metal closed above its 200-day moving average. However, with liquidity-fueled assets leading the charge, dramatic declines should materialize when the bullish seasonality reverses in January.
Please see below:
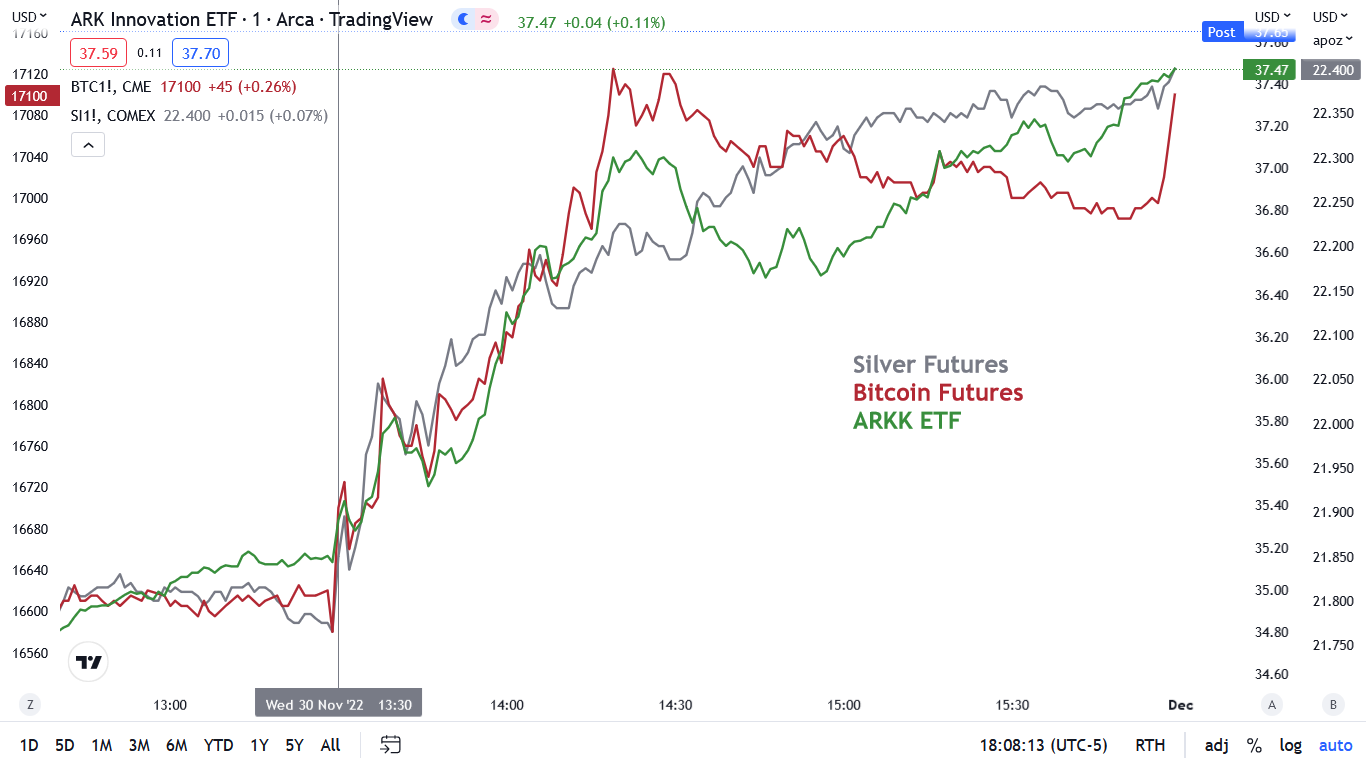
To explain, the gray, red and green lines above track the silver futures price, the Bitcoin futures price and the ARK Innovation ETF (ARKK). If you analyze the vertical gray line on the left side of the chart, you can see that the chase was on shortly after Powell spoke.
But, with liquidity-fueled assets like silver benefiting from lower interest rates and looser financial conditions, that’s the opposite of what the Fed needs to curb inflation. Therefore, while Powell reminded us that a hot labor market is at odds with his 2% inflation goal, the ‘QE kings’ are behaving as if real rates are negative and the Fed’s balance sheet is accelerating.
In contrast, Powell said on Nov. 30:
“I think for now we have to assume,” that labor supply won't rebound. “We have to do what it takes to restore balance in the labor market to get back to 2% inflation (…) by slowing job growth rather than putting people out of work.”
For context, Powell was being diplomatic when he said he wanted to avoid “putting people out of work.” Of course, he does. It’s not the Fed’s goal to crash the U.S. economy. Yet, the reality is that the Fed is unlikely to cool ~40-year high inflation with a ~50-year low unemployment rate.
Please see below:
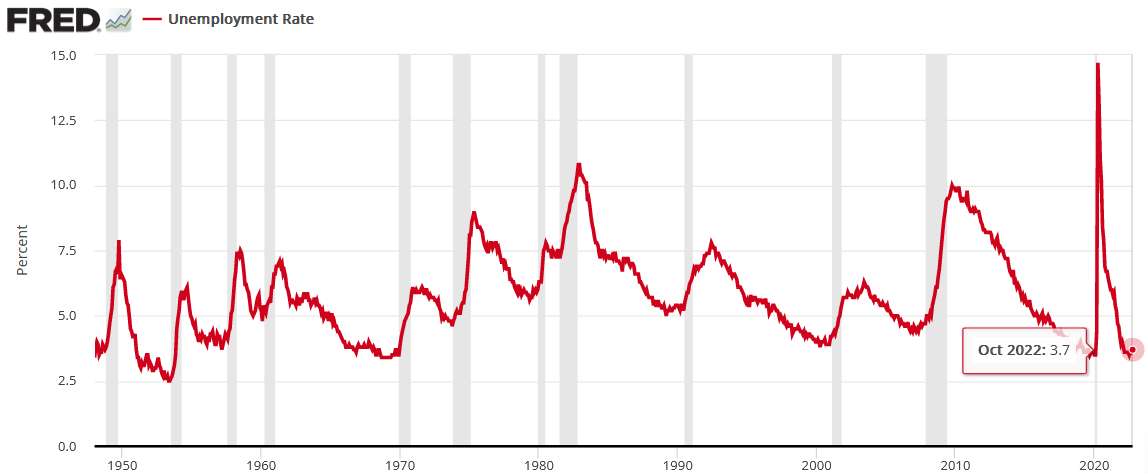
To explain, the red line above tracks the U.S. unemployment rate, and the vertical gray bars mark U.S. recessions. As you can see, the unemployment rate always hits a cycle low before rising sharply. Furthermore, no Fed committee in history wanted to put people “out of work,” but for inflation to fall, the U.S. unemployment rate must rise.
Consequently, with resilient growth, inflation, employment and consumer spending not cooperating right now, the Fed needs to push the FFR much higher, and a realization is bullish for real yields and the USD Index.
For example, the Fed released its latest Beige Book on Nov. 30. For context, the report consolidates all of the results from the regional Fed banks, so it’s akin to a nationwide survey. An excerpt read:
“Consumer prices rose at a moderate or strong pace in most Districts (…). Inflation was expected to hold steady or moderate further moving forward.”
In addition:
“Employment grew modestly in most districts, but two Districts reported flat headcounts and labor demand weakened overall. Hiring and retention difficulties eased further, although labor markets were still described as tight (…).”
“Wages increased at a moderate pace on average, but a few Districts experienced at least some relaxation of wage pressures. Opinions about the outlook pointed to stable or slowing employment growth and at least modest further wage growth moving forward.”
Thus, with output prices rising at a “moderate [to] strong pace,” while employment and wages increased at a “moderate pace,” the “tight” U.S. labor market has not experienced the demand destruction required to curb inflation.
As further evidence, ADP released its private payrolls report on Nov. 30, and the 127,000 net additions missed the consensus estimate of 200,000.
Please see below:
 Source: Investing.com
However, the official report noted that wage inflation remains robust, and investors are in la-la land if they think output inflation will fall to 2% when wages are running north of 7%.
Please see below:
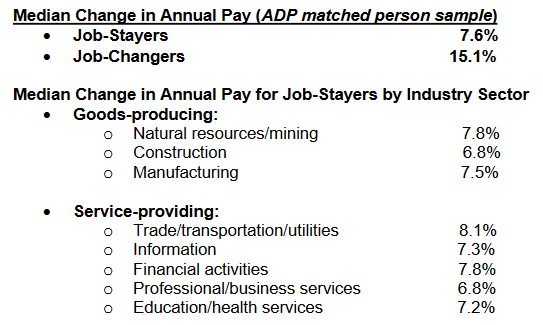 Source: ADP
To explain, ADP’s measures of wage inflation show that job-stayers enjoyed a 7.6% increase in their median annual pay in November, while job-changers recorded a 15.1% jump. Also, material wage inflation was present across several goods and service sectors, and these are not the kind of results that support a dovish pivot. If anything, the Fed will need to be more hawkish than the consensus expects, as higher wages should keep consumer spending elevated for the foreseeable future.
Overall, seasonality has the bulls in pole position, but the fundamentals have not changed: the Fed has an inflation problem, and no matter what Powell says, history shows that significant economic weakness is required to normalize the metric to 2%.
Hawkish Data Abound
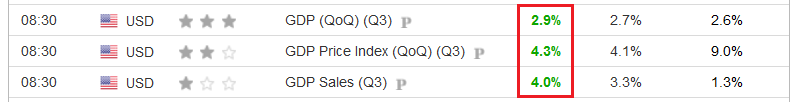
While the crowd continues to buy hope and sell reality, the recent economic data has been profoundly hawkish. For example, while preliminary Q3 U.S. real GDP growth came in at 2.6%, the figure was revised upward to 2.9% on Nov. 30.
Moreover, with the GDP Price Index (inflation) also outperforming the consensus estimate, these metrics are nowhere near the levels that coincide with dovish pivots.
Please see below:
 Source: Investing.com
The official release from the U.S. Bureau of Economic Analysis (BEA) read:
“The GDP estimate released today is based on more complete source data than were available for the ‘advance’ estimate issued last month. In the advance estimate, the increase in real GDP was 2.6 percent. The second estimate primarily reflected upward revisions to consumer spending and nonresidential fixed investment that were partly offset by a downward revision to private inventory investment.”
Thus, does “upward revisions to consumer spending and nonresidential fixed investment” sound like a backdrop where rate cuts are imminent?
To that point, the next time ZeroHedge cries wolf about a dovish pivot, please remember the site claimed that U.S. GDP growth was “rapidly collapsing” in January. Therefore, while narratives are entertaining, objectively analyzing the fundamentals is more useful in determining the path of monetary policy and the performance of the precious metals.
Please see below:
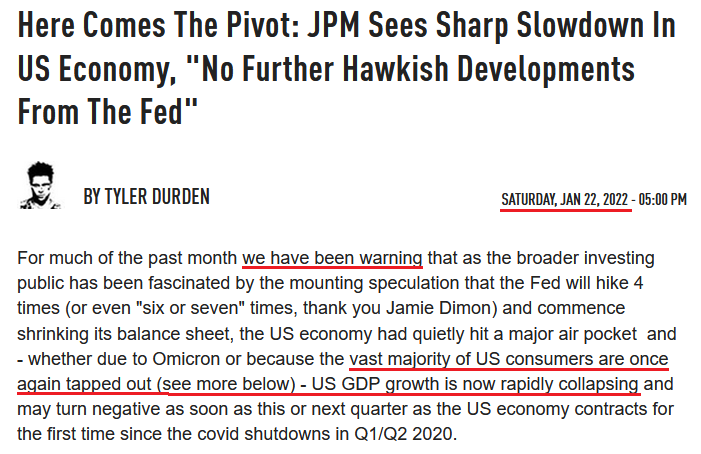 Source: ZeroHedge
Furthermore, while I warned for many months that inflation would persist for much longer than the consensus expected, the main difference between the crowd and myself is that the former assumed this bout of inflation was a supply-side spectacle. In contrast, I noted that demand was the primary driver, and that resilient consumer spending would intensify the pricing pressures. To explain, I wrote on Mar. 31:
There is a misnomer in the financial markets that inflation is a supply-side phenomenon. In a nutshell: COVID-19 restrictions, labor shortages, and manufacturing disruptions are the reasons for inflation’s reign. As such, when these issues are no longer present, inflation will normalize and the U.S. economy will enjoy a “soft landing.”
However, investors’ faith in the narrative will likely lead to plenty of pain over the medium term. For example, I’ve noted for some time that the U.S. economy remains in a healthy position; and with U.S. consumers flush with cash and a red hot labor market helping to bloat their wallets, their propensity to spend keeps economic data elevated. Likewise, while most investors assumed that consumer spending and inflation would fall off a cliff when enhanced unemployment benefits ended in September, the reality is that neither will die easy.
So, while the thesis unfolded exactly as expected, the crowd still underestimates consumers’ ability to keep inflation uplifted; and with the San Francisco Fed realizing its misstep, the data highlights why the FFR should have plenty of room to run.
Please see below:
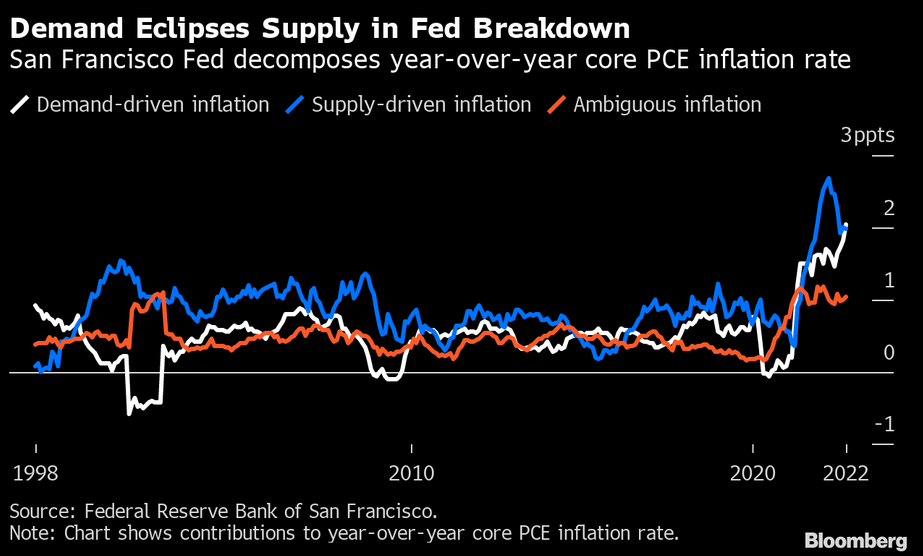
To explain, the San Francisco Fed attempted to decompose the drivers of the core Personal Consumption Expenditures (PCE) Index’s year-over-year (YoY) increase. The blue, white and orange lines above represent supply, demand and ambiguous inflation.
If you analyze the right side of the chart, you can see that the white line (demand) has now surpassed the blue line (supply) as the primary driver of inflation. Thus, while supply chains have normalized and shipping rates have declined by upwards of ~80% YoY, output inflation has barely budged. As such, resilient demand has been the culprit, and the crowd doesn’t grasp how difficult this will make the Fed’s job in 2023.
Finally, Neil Dutta, Head of Economics at Renaissance Macro Research, highlighted the conundrum on Nov. 30. He wrote:
“At the moment, the Fed, like many companies, appears to be offside on economic growth. There are rumblings that the central bank is planning to pivot toward a slower pace of interest-rate hikes – a signal it believes the economy is weakening enough to bring down inflation. But, as I outlined above, the opposite is true: real growth is picking up. This will make the Fed's job even harder and force it to dispense with the ‘pivot’ before it really begins.”
He added:
“Even with improving supply chains, a mad scramble by companies to catch up with higher-than-expected consumer demand would keep inflation higher than the Fed's 2% goal. This, in turn, would force the central bank's hand. Instead of a softening economy and moderating prices allowing the Fed to pivot toward a more relaxed policy, a robust economy and stickier inflation would push it to continue hiking interest rates for longer than anticipated.”
As a result, while it may seem counterintuitive, resilient growth and consumer spending are bearish because they will force the FFR and real interest rates higher and hurt the S&P 500 and the PMs. So, while the crowd cheers on demand destruction (pivot hope), they should learn the hard way that it’s easier to believe it than achieve it.
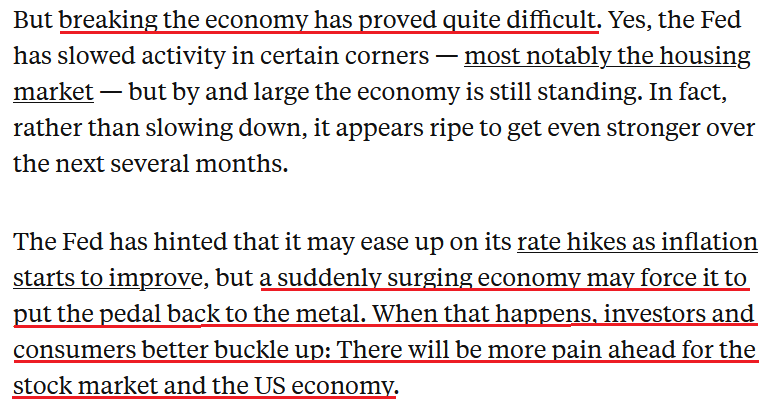 Source: Business Insider
The Bottom Line
While gold, silver, mining stocks and the S&P 500 remain uplifted, they have bought into a narrative that’s failed them many times in 2022. In a nutshell: whenever an immaterial decline in some economic data point occurs, the dip buyers assume the Fed has accomplished its goal, which means a peak FFR, real yields and USD Index.
However, sustainably normalizing inflation is much more difficult, and a few months of progress is largely immaterial, especially when all of the optimism only loosens financial conditions and creates even more inflation. Therefore, the crowd misses the forest through the trees, and a significant reality check should confront the bulls in the months ahead.
In conclusion, the PMs were mixed on Nov. 30, as despite the afternoon rally, gold ended the day in the red. Moreover, the USD Index and the U.S. 10-Year real yield were under pressure as the pivot mania intensified. But, while the narrative suggests a new bull market has begun, the medium-term technicals and fundamentals signal profound trouble ahead.
Overview of the Upcoming Part of the Decline
- It seems to me that the corrective upswing is over (or about to be over) and that the next big move lower is already underway (or that it’s about to start).
- If we see a situation where miners slide in a meaningful and volatile way while silver doesn’t (it just declines moderately), I plan to – once again – switch from short positions in miners to short positions in silver. At this time, it’s too early to say at what price levels this could take place and if we get this kind of opportunity at all – perhaps with gold prices close to $1,500 - $1,550.
- I plan to switch from the short positions in junior mining stocks or silver (whichever I’ll have at that moment) to long positions in junior mining stocks when gold / mining stocks move to their 2020 lows (approximately). While I’m probably not going to write about it at this stage yet, this is when some investors might consider getting back in with their long-term investing capital (or perhaps 1/3 or 1/2 thereof).
- I plan to return to short positions in junior mining stocks after a rebound – and the rebound could take gold from about $1,450 to about $1,550, and it could take the GDXJ from about $20 to about $24. In other words, I’m currently planning to go long when GDXJ is close to $20 (which might take place when gold is close to $1,450), and I’m planning to exit this long position and re-enter the short position once we see a corrective rally to $24 in the GDXJ (which might take place when gold is close to $1,550).
- I plan to exit all remaining short positions once gold shows substantial strength relative to the USD Index while the latter is still rallying. This may be the case with gold prices close to $1,400 and GDXJ close to $15 . This moment (when gold performs very strongly against the rallying USD and miners are strong relative to gold after its substantial decline) is likely to be the best entry point for long-term investments, in my view. This can also happen with gold close to $1,400, but at the moment it’s too early to say with certainty.
- The above is based on the information available today, and it might change in the following days/weeks.
You will find my general overview of the outlook for gold on the chart below:

Please note that the above timing details are relatively broad and “for general overview only” – so that you know more or less what I think and how volatile I think the moves are likely to be – on an approximate basis. These time targets are not binding nor clear enough for me to think that they should be used for purchasing options, warrants, or similar instruments.
Welcome to Golden Meadow
If you're reading it here, it means that you haven't joined us on Golden Meadow just yet. That's perfectly fine - take your time. Still, I wouldn't wait, because that's where the action is going to be going forward :). You'll find more details in this video.
Summary
Summing up, last week’s shooting star reversal candlestick in gold already resulted in lower gold prices, and as Bitcoin forms its short-term bottom, the big decline in the precious metals sector (especially in junior mining stocks) is likely to resume.
I would like to take this opportunity to congratulate you on your patience with this trade (and I’m grateful for your understanding that not every corrective upswing can be “caught” in trading terms). Many investors and traders panic and get out of the market exactly at the wrong time, but your patience and self-discipline mean that you’re poised to make the most of what the market brings us this and next year.
Moving back to the market, it appears to be yet another time when the markets are incorrectly expecting the Fed to make a dovish U-turn, and based on this, the part of the 2008 decline where we saw the biggest corrective upswing materialized.
In my opinion, the current trading position is going to become profitable in the following weeks, and quite possibly in the following days. And while I can’t promise any kind of performance, I fully expect it to become very profitable before it’s over and to prolong our 2022 winning streak.
After the final sell-off (that takes gold to about $1,350-$1,500), I expect the precious metals to rally significantly. The final part of the decline might take as little as 1-5 weeks, so it's important to stay alert to any changes.
To summarize:
Trading capital (supplementary part of the portfolio; our opinion): Full speculative short positions (300% of the full position) in junior mining stocks are justified from the risk to reward point of view with the following binding exit profit-take price levels:
Mining stocks (price levels for the GDXJ ETF): binding profit-take exit price: $20.32; stop-loss: none (the volatility is too big to justify a stop-loss order in case of this particular trade)
Alternatively, if one seeks leverage, we’re providing the binding profit-take levels for the JDST (2x leveraged). The binding profit-take level for the JDST: $27.87; stop-loss for the JDST: none (the volatility is too big to justify a SL order in case of this particular trade).
For-your-information targets (our opinion; we continue to think that mining stocks are the preferred way of taking advantage of the upcoming price move, but if for whatever reason one wants / has to use silver or gold for this trade, we are providing the details anyway.):
Silver futures downside profit-take exit price: $12.32
SLV profit-take exit price: $11.32
ZSL profit-take exit price: $74.87
Gold futures downside profit-take exit price: $1,504
HGD.TO – alternative (Canadian) 2x inverse leveraged gold stocks ETF – the upside profit-take exit price: $18.47
HZD.TO – alternative (Canadian) 2x inverse leveraged silver ETF – the upside profit-take exit price: $46.87
Long-term capital (core part of the portfolio; our opinion): No positions (in other words: cash)
Insurance capital (core part of the portfolio; our opinion): Full position
Whether you’ve already subscribed or not, we encourage you to find out how to make the most of our alerts and read our replies to the most common alert-and-gold-trading-related-questions.
Please note that we describe the situation for the day that the alert is posted in the trading section. In other words, if we are writing about a speculative position, it means that it is up-to-date on the day it was posted. We are also featuring the initial target prices to decide whether keeping a position on a given day is in tune with your approach (some moves are too small for medium-term traders, and some might appear too big for day-traders).
Additionally, you might want to read why our stop-loss orders are usually relatively far from the current price.
Please note that a full position doesn't mean using all of the capital for a given trade. You will find details on our thoughts on gold portfolio structuring in the Key Insights section on our website.
As a reminder - "initial target price" means exactly that - an "initial" one. It's not a price level at which we suggest closing positions. If this becomes the case (as it did in the previous trade), we will refer to these levels as levels of exit orders (exactly as we've done previously). Stop-loss levels, however, are naturally not "initial", but something that, in our opinion, might be entered as an order.
Since it is impossible to synchronize target prices and stop-loss levels for all the ETFs and ETNs with the main markets that we provide these levels for (gold, silver and mining stocks - the GDX ETF), the stop-loss levels and target prices for other ETNs and ETF (among other: UGL, GLL, AGQ, ZSL, NUGT, DUST, JNUG, JDST) are provided as supplementary, and not as "final". This means that if a stop-loss or a target level is reached for any of the "additional instruments" (GLL for instance), but not for the "main instrument" (gold in this case), we will view positions in both gold and GLL as still open and the stop-loss for GLL would have to be moved lower. On the other hand, if gold moves to a stop-loss level but GLL doesn't, then we will view both positions (in gold and GLL) as closed. In other words, since it's not possible to be 100% certain that each related instrument moves to a given level when the underlying instrument does, we can't provide levels that would be binding. The levels that we do provide are our best estimate of the levels that will correspond to the levels in the underlying assets, but it will be the underlying assets that one will need to focus on regarding the signs pointing to closing a given position or keeping it open. We might adjust the levels in the "additional instruments" without adjusting the levels in the "main instruments", which will simply mean that we have improved our estimation of these levels, not that we changed our outlook on the markets. We are already working on a tool that would update these levels daily for the most popular ETFs, ETNs and individual mining stocks.
Our preferred ways to invest in and to trade gold along with the reasoning can be found in the how to buy gold section. Furthermore, our preferred ETFs and ETNs can be found in our Gold & Silver ETF Ranking.
As a reminder, Gold & Silver Trading Alerts are posted before or on each trading day (we usually post them before the opening bell, but we don't promise doing that each day). If there's anything urgent, we will send you an additional small alert before posting the main one.
Thank you.
Przemyslaw K. Radomski, CFAFounder, Editor-in-chief

