

Briefly: in our opinion, full (300% of the regular position size) speculative short positions in junior mining stocks are justified from the risk/reward point of view at the moment of publishing this Alert.
Introduction
While weak earnings from Microsoft and Alphabet (Google) sunk the S&P 500 by 0.74% on Oct. 26, gold rallied by 0.68%, silver by 0.71%, the GDX ETF by 2.95% and the GDXJ ETF by 3.05%.
In addition, the USD Index fell by 1.15% and the U.S. 10-Year real yield rose by one basis point. As a result, while false narratives helped uplift the PMs and depress the dollar basket, 2022 has been full of countertrend moves that ended in disappointment for the risk-on crowd.
Profitless Narratives
With ZeroHedge known to exaggerate meltdown and melt-up scenarios, concern has arisen over the potential for a sharp rise or fall in U.S. Treasury yields. One the one hand, Mark Cabana, Head of U.S. Rates Strategy at Bank of America, warned that a midterm victory for the Democrats could propel interest rates substantially higher. Moreover, the “forced selling” could elicit more “stress” in the bond market.
On the other hand, whispers have grown louder about a potential “intervention” in the U.S. Treasury market, which could elicit and rally in bonds and reduce interest rates. In a nutshell: a Fed pivot is on the horizon.
However, please remember that ZeroHedge is a quasi-news organization whose goal is to increase the number of clicks on its website. Therefore, much of the information on ZeroHedge is spun in a way that generates attention but doesn’t reflect fundamental reality. To explain, I wrote on May 25:
With inflation rivaling the 1970s, still increasing month-over-month (MoM), and U.S consumers still eager to spend, a third category of investors enter the equation: the hyper-inflationists. For context, they resemble permabears, but the idea is that the Fed can't stomach a recession, so officials will let inflation rage.
Please see below:
…. A decade of dovish pivots has a generation of investors believing that the central bank is all talk and no action. However, with inflation at levels unseen in 40+ years, Powell is not out of ammunition, and the Fed pivot crowd should suffer profound disappointment as the drama unfolds.
Thus, while ZeroHedge has been screaming about a pivot for many months, positioning for “Powell capitulation” would have resulted in substantial losses.
Please see below:
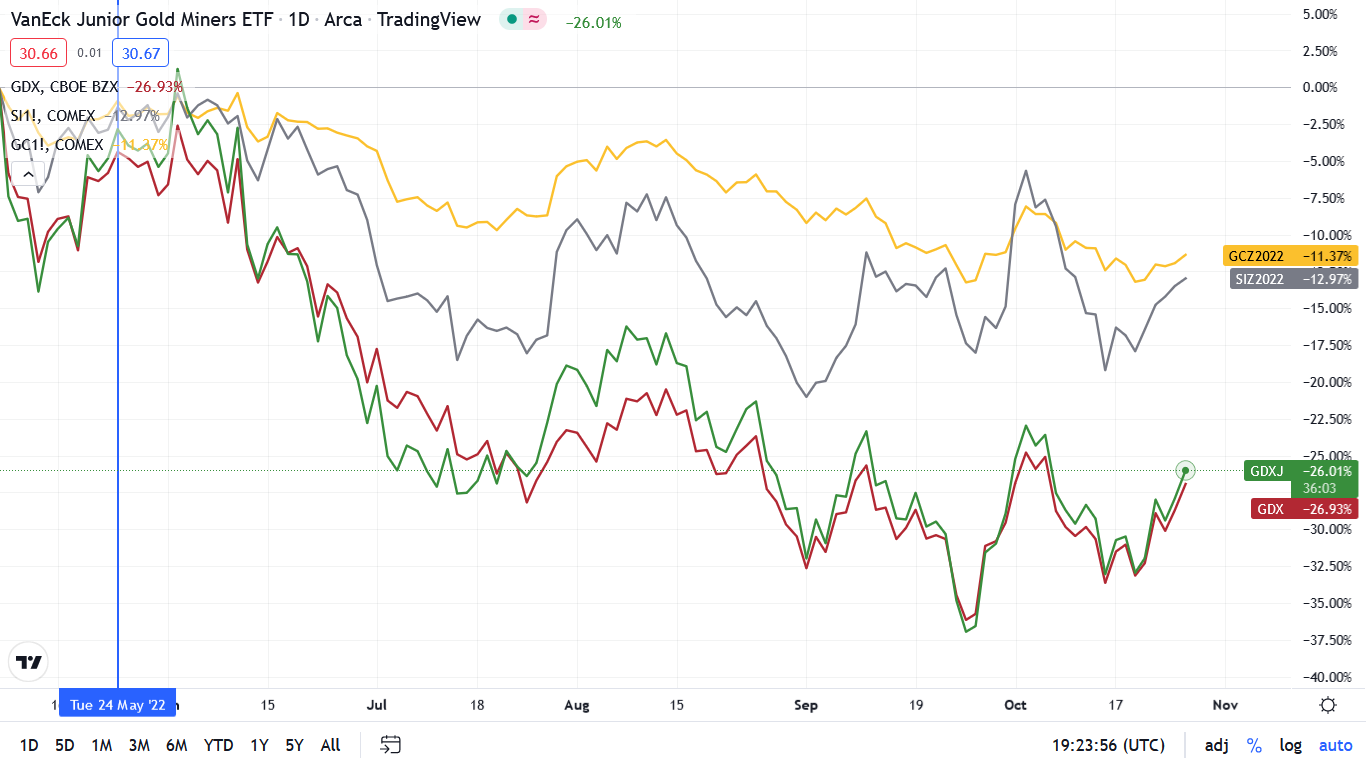
To explain, the gold, silver, red and green lines above track the performance of gold futures, silver futures, the GDX ETF and the GDXJ ETF. As you can see, the PMs have declined materially since ZeroHedge’s May 24th tweet, and mining stocks are down by more than 20%. As a result, please remember that while ZeroHedge’s articles are entertaining, they won’t make you any money.
To that point, following ZeroHedge has been the quickest way to the poor house in 2022. For example:
More importantly:
 Source: ZeroHedge
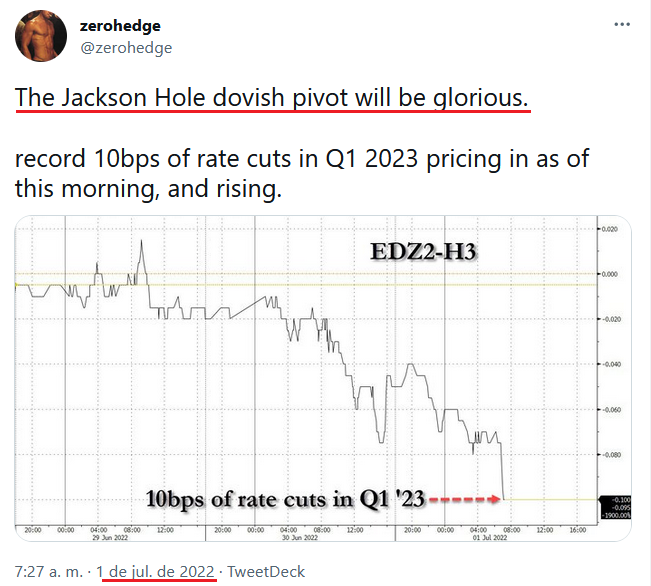
So while ZeroHedge has amplified the false pivot narrative for much of 2022, imagine if you had bought the PMs in January. You would have suffered major losses.
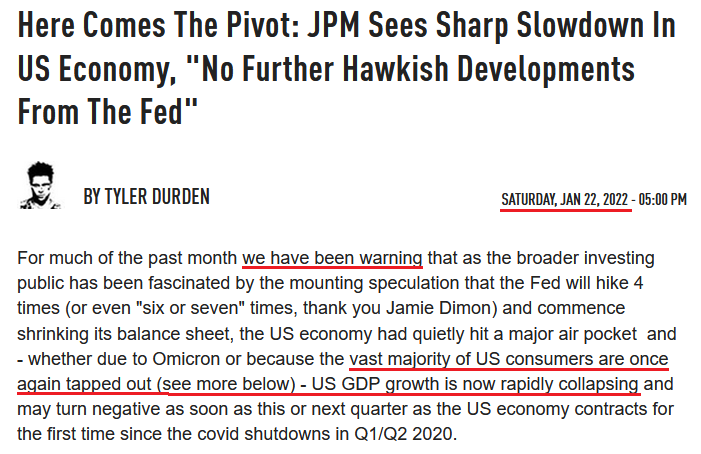
Furthermore, while the site proclaimed that “U.S. GDP growth is now rapidly collapsing” in January, it’s been several months and the Atlanta Fed raised its Q3 real GDP estimate to 3.1% on Oct. 26. Thus, it’s prudent to pay less attention to narratives and more attention to the data
Please see below:
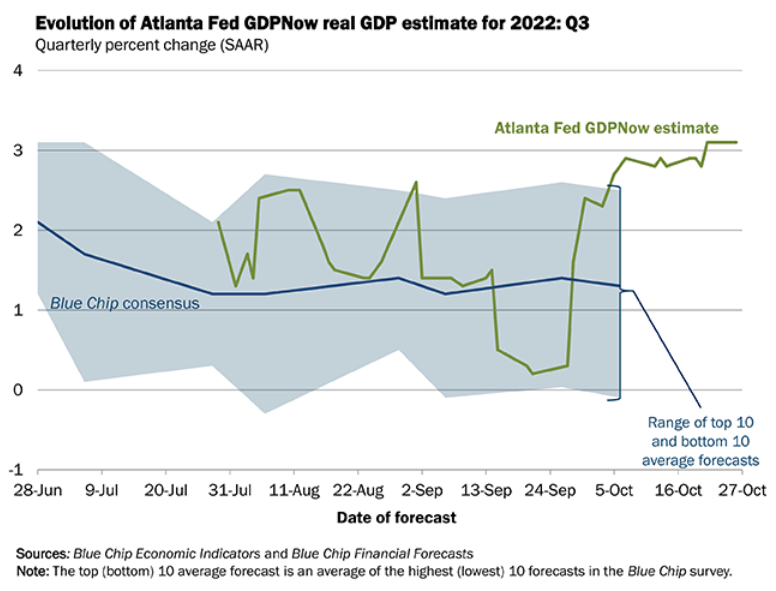
To explain, the green line above tracks the Atlanta Fed’s Q3 real GDP growth estimate, while the blue line above tracks the Blue Chip Consensus estimate (investment banks). If you analyze the right side of the chart, you can see that the green line hit a new projection high on Oct. 26. As such, ZeroHedge was, and still is, early in its doomsday prediction.
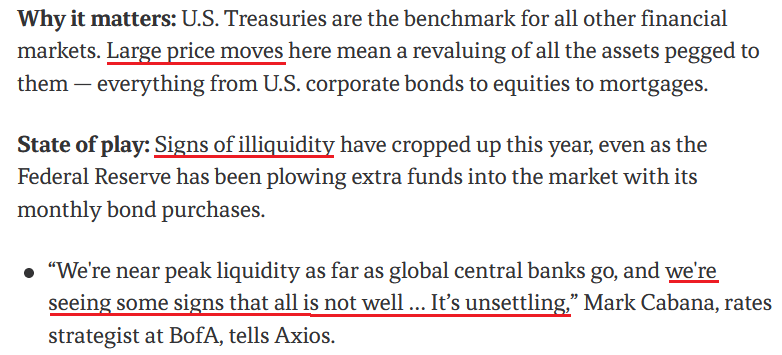
Turning to Cabana, he also has a history of perpetuating narratives that don’t come to fruition. To explain, I wrote on Oct. 4:
With tales of Treasury market illiquidity resurfacing – which could force the Fed to intervene to avoid a crash in bond prices – it’s important not to assign credibility to individuals that constantly sound the same alarm. Remember, it’s like The Boy Who Cried Wolf. They recycle the same warning, while the wolf only arrives 1% of the time.
Please see below:
 Source: Axios
To explain, the screenshot above is from an article written on Nov. 17, 2021. Here is the link if you want to read it: https://www.axios.com/2021/11/17/treasury-market-stress-signs-regulators
As you can see, Cabana said the same thing nearly a year ago. Moreover, the U.S. 10-Year Treasury yield ended the Nov. 17, 2021 session at 1.59%, while the GDXJ ETF closed at $47.38. So if you positioned for Cabana's warning back then, you would have lost a lot of money buying the U.S. 10-Year Treasury Note and the junior miners' index.
All in all, the moral of the story is to scrutinize where the information comes from; and while ZeroHedge has useful data, its analysis is biased. Therefore, if you take its conclusions at face value, you may be disappointed with the results.
What’s Wrong With the USD Index?
With the USD Index declining sharply on Oct. 26, the dollar basket has suffered in recent days. Furthermore, with risk-on currencies like the EUR, the GBP and the CAD rallying, the greenback has hit a rough patch.
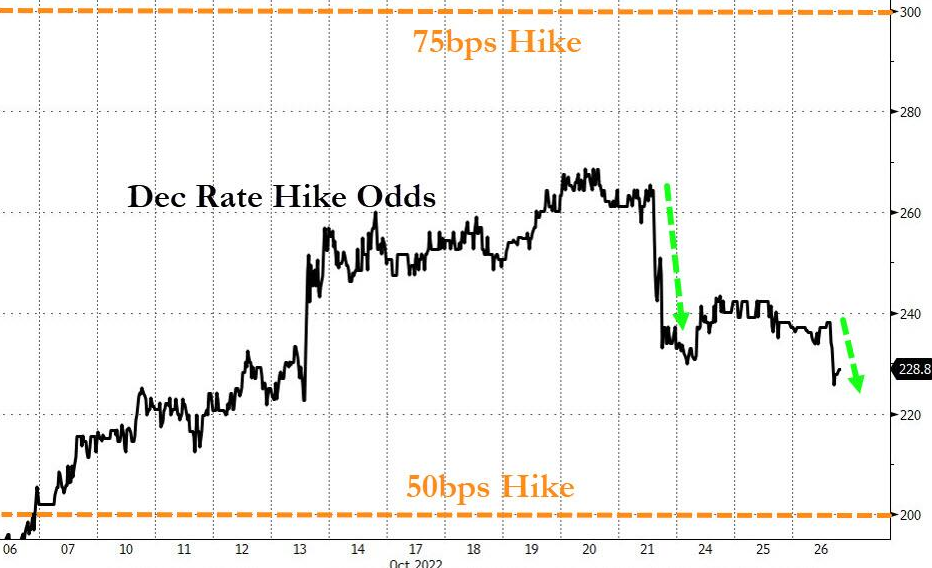
But while the weakness is bullish for gold, silver and mining stocks, the underperformance is unlikely to last. For example, the Bank of Canada (BoC) raised its overnight lending rate by 50 basis points on Oct. 26. Now, the move was relatively dovish, as market participants largely expected a 75 basis point rate hike.
Likewise, with the BoC and the Fed often following in each other’s footsteps, the odds of a 75 basis point rate hike by the latter in December retreated on Oct. 26:
Please see below:
 Source: Bloomberg/ZeroHedge
However, the BoC’s official statement read:
“Given elevated inflation and inflation expectations, as well as ongoing demand pressures in the economy, the Governing Council expects that the policy interest rate will need to rise further.”
Yet, BoC Governor Tiff Macklem (Canada’s Jerome Powell) said during his press conference:
“If we don’t do enough, Canadians will continue to endure the hardship of high inflation; and they will come to expect persistently high inflation, which will require much higher interest rates and potentially a severe recession to control inflation. Nobody wants that.
“If we do too much, we could slow the economy more than needed; and we know that has harmful consequences for people’s ability to service their debts, for their jobs and for their businesses.
“This tightening phase will draw to a close. We are getting closer, but we are not there yet.”
Thus, the last statement was music to the bulls' ears. With Macklem hinting that the BoC is "getting closer" to the end of its rate hike cycle, the crowd surmised that the Fed could be on a similar path. As a result, the buy bonds, sell the dollar trade materialized on Oct. 26, as pivot hopes intensified.
However, the BoC made a mistake. With the central bank essentially green-lighting a risk rally, the error will only cause more inflationary problems in the months ahead. As such, the BoC wants to rein in inflation without slowing the Canadian economy "more than needed."
In reality, the prospect is unrealistic and is doomed to fail. To quell inflation, the BoC needs to commit to higher interest rates, as a half-hearted attempt will lead the central bank to fail at both initiatives. So while the Fed may attempt a similar feat, it will only lead to more problems down the road. Overall, the BoC essentially performed a "transitory" part two on Oct. 26.
To that point, while the developments were bearish for the USD Index, support could be around the corner.
Please see below:
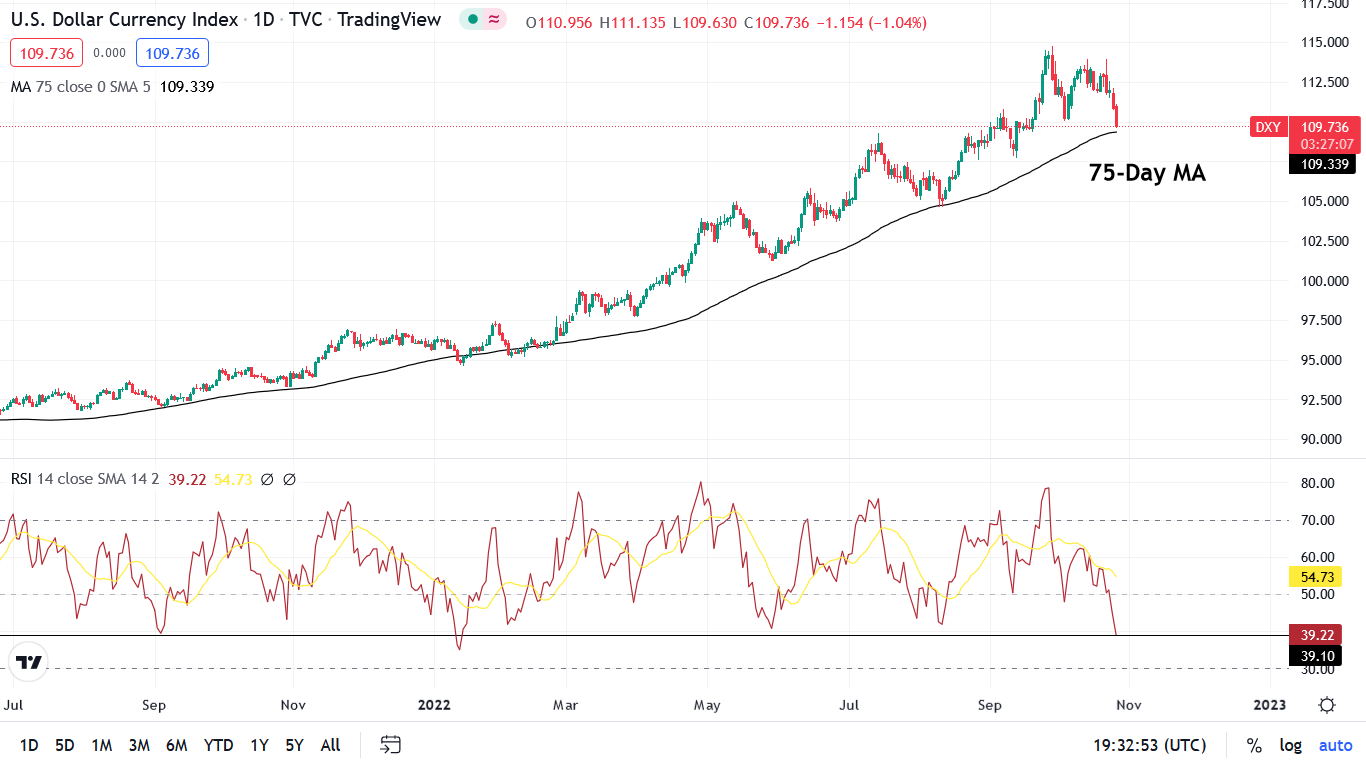
To explain, the candlestick chart above tracks the USD Index, while the black line at the top tracks its 75-day moving average. If you analyze the relationship, you can see that the 75-day MA has provided material support for the last ~16 months. Likewise, it roughly marked the bottom during the July/August pullback.
As a result, with the level fast approaching, it should help the greenback regain its footing. In addition, the USD Index’s daily RSI (the red line at the bottom) is near the levels that coincided with reversals over the last ~16 months. Thus, we may witness a comeback sooner rather than later.
Also noteworthy, Europe and Britain face worse growth-inflation dynamics than the U.S., so while sentiment has shifted, the fundamentals support a weaker EUR/USD and GBP/USD; and with Japan still implementing QE to suppress interest rates, the USD/JPY should have more upside. Therefore, the fundamentals support a stronger USD Index in the months ahead.
The Bottom Line
While gold, silver and mining stocks rallied on Oct. 26, investors are following the same losing playbook that has plagued them throughout 2022. Each time a dovish pivot is anticipated, the crowd believes the worst is in the rearview. However, you can’t reverse engineer a stable economy. With inflation still unanchored, a deceleration in rate hikes only makes a bad situation worse. So while investors may assume that cautious central banks are bullish, they’ll realize later that the policy stances create more problems than they solve.
Remember, when the Fed and the BoC called inflation “transitory” in 2021, investors happily bought into the narrative. Yet, that decision wasn’t so wise when the bear market arrived in 2022. As such, we see this as another iteration of the same mistake, and expect gold, silver and mining stocks to hit lower lows before long-term buying opportunities emerge.
In conclusion, the PMs rallied on Oct. 26, as the BoC helped uplift sentiment. However, while the USD Index often suffers when false narratives occur, it has pulled back and then ascended to new highs several times in 2022. As a result, a similar outcome should occur over the medium term.
Overview of the Upcoming Part of the Decline
- It seems to me that the corrective upswing is over, and that the next big move lower is already underway.
- If we see a situation where miners slide in a meaningful and volatile way while silver doesn’t (it just declines moderately), I plan to – once again – switch from short positions in miners to short positions in silver. At this time, it’s too early to say at what price levels this could take place and if we get this kind of opportunity at all – perhaps with gold prices close to $1,500-$1,550.
- I plan to switch from the short positions in junior mining stocks or silver (whichever I’ll have at that moment) to long positions in junior mining stocks when gold / mining stocks move to their 2020 lows (approximately). While I’m probably not going to write about it at this stage yet, this is when some investors might consider getting back in with their long-term investing capital (or perhaps 1/3 or 1/2 thereof).
- I plan to return to short positions in junior mining stocks after a rebound – and the rebound could take gold from about $1,450 to about $1,550, and it could take the GDXJ from about $20 to about $24.
- I plan to exit all remaining short positions once gold shows substantial strength relative to the USD Index while the latter is still rallying. This may be the case with gold prices close to $1,400 and GDXJ close to $15 . This moment (when gold performs very strongly against the rallying USD and miners are strong relative to gold after its substantial decline) is likely to be the best entry point for long-term investments, in my view. This can also happen with gold close to $1,400, but at the moment it’s too early to say with certainty.
- The above is based on the information available today, and it might change in the following days/weeks.
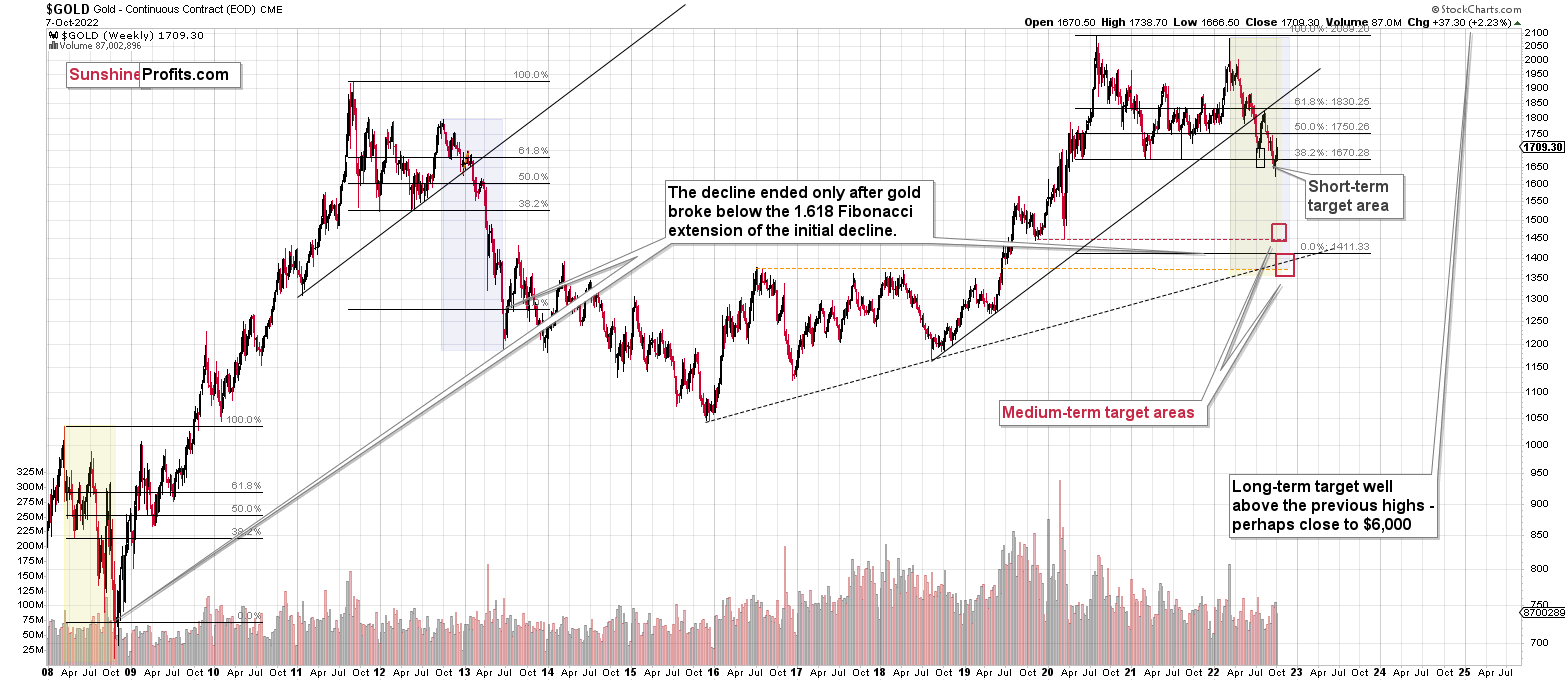
You will find my general overview of the outlook for gold on the chart below:
Please note that the above timing details are relatively broad and “for general overview only” – so that you know more or less what I think and how volatile I think the moves are likely to be – on an approximate basis. These time targets are not binding nor clear enough for me to think that they should be used for purchasing options, warrants, or similar instruments.
Summary
Summing up, it seems that the biggest part of the 2013-like decline is taking place right now, and – while I can’t make any promises regarding performance - it seems likely to me that our big profits are about to become huge, and then ridiculously big in the relatively near future.
As far as this quick corrective upswing is concerned, it seems that it might already be over.
The current quick upswing most likely doesn’t change anything. Fundamentals and technicals continue to point to lower precious metals values in the coming weeks / months. The current geopolitical news-based rally is likely to serve as nothing more than just a verification of the breakdown below the previous lows in gold.
Things might happen very fast in the coming days, and if I plan to make any adjustments, I’ll keep you informed. Still, if the targets that I’m mentioning in the “Trading” part of the summary are reached, I think that profits should be taken off the table without an additional confirmation from me. I will probably get on the long side of the market at that time, but I’ll send a confirmation if I decide to do so.
After the final sell-off (that takes gold to about $1,350-$1,500), I expect the precious metals to rally significantly. The final part of the decline might take as little as 1-5 weeks, so it's important to stay alert to any changes.
As always, we'll keep you – our subscribers – informed.
To summarize:
Trading capital (supplementary part of the portfolio; our opinion): Full speculative short positions (300% of the full position) in junior mining stocks are justified from the risk to reward point of view with the following binding exit profit-take price levels:
Mining stocks (price levels for the GDXJ ETF): binding profit-take exit price: $20.32; stop-loss: none (the volatility is too big to justify a stop-loss order in case of this particular trade)
Alternatively, if one seeks leverage, we’re providing the binding profit-take levels for the JDST (2x leveraged). The binding profit-take level for the JDST: $27.87; stop-loss for the JDST: none (the volatility is too big to justify a SL order in case of this particular trade).
For-your-information targets (our opinion; we continue to think that mining stocks are the preferred way of taking advantage of the upcoming price move, but if for whatever reason one wants / has to use silver or gold for this trade, we are providing the details anyway.):
Silver futures downside profit-take exit price: $12.32
SLV profit-take exit price: $11.32
ZSL profit-take exit price: $74.87
Gold futures downside profit-take exit price: $1,504
HGD.TO – alternative (Canadian) 2x inverse leveraged gold stocks ETF – the upside profit-take exit price: $18.47
HZD.TO – alternative (Canadian) 2x inverse leveraged silver ETF – the upside profit-take exit price: $46.87
Long-term capital (core part of the portfolio; our opinion): No positions (in other words: cash)
Insurance capital (core part of the portfolio; our opinion): Full position
Whether you’ve already subscribed or not, we encourage you to find out how to make the most of our alerts and read our replies to the most common alert-and-gold-trading-related-questions.
Please note that we describe the situation for the day that the alert is posted in the trading section. In other words, if we are writing about a speculative position, it means that it is up-to-date on the day it was posted. We are also featuring the initial target prices to decide whether keeping a position on a given day is in tune with your approach (some moves are too small for medium-term traders, and some might appear too big for day-traders).
Additionally, you might want to read why our stop-loss orders are usually relatively far from the current price.
Please note that a full position doesn't mean using all of the capital for a given trade. You will find details on our thoughts on gold portfolio structuring in the Key Insights section on our website.
As a reminder - "initial target price" means exactly that - an "initial" one. It's not a price level at which we suggest closing positions. If this becomes the case (as it did in the previous trade), we will refer to these levels as levels of exit orders (exactly as we've done previously). Stop-loss levels, however, are naturally not "initial", but something that, in our opinion, might be entered as an order.
Since it is impossible to synchronize target prices and stop-loss levels for all the ETFs and ETNs with the main markets that we provide these levels for (gold, silver and mining stocks - the GDX ETF), the stop-loss levels and target prices for other ETNs and ETF (among other: UGL, GLL, AGQ, ZSL, NUGT, DUST, JNUG, JDST) are provided as supplementary, and not as "final". This means that if a stop-loss or a target level is reached for any of the "additional instruments" (GLL for instance), but not for the "main instrument" (gold in this case), we will view positions in both gold and GLL as still open and the stop-loss for GLL would have to be moved lower. On the other hand, if gold moves to a stop-loss level but GLL doesn't, then we will view both positions (in gold and GLL) as closed. In other words, since it's not possible to be 100% certain that each related instrument moves to a given level when the underlying instrument does, we can't provide levels that would be binding. The levels that we do provide are our best estimate of the levels that will correspond to the levels in the underlying assets, but it will be the underlying assets that one will need to focus on regarding the signs pointing to closing a given position or keeping it open. We might adjust the levels in the "additional instruments" without adjusting the levels in the "main instruments", which will simply mean that we have improved our estimation of these levels, not that we changed our outlook on the markets. We are already working on a tool that would update these levels daily for the most popular ETFs, ETNs and individual mining stocks.
Our preferred ways to invest in and to trade gold along with the reasoning can be found in the how to buy gold section. Furthermore, our preferred ETFs and ETNs can be found in our Gold & Silver ETF Ranking.
As a reminder, Gold & Silver Trading Alerts are posted before or on each trading day (we usually post them before the opening bell, but we don't promise doing that each day). If there's anything urgent, we will send you an additional small alert before posting the main one.
Thank you.
Przemyslaw K. Radomski, CFA
Founder, Editor-in-chief

