

Briefly: in our opinion, full (300% of the regular position size) speculative short positions in junior mining stocks are justified from the risk/reward point of view at the moment of publishing this Alert.
As announced, in today's article I will focus on the fundamental part. However, what is worth emphasizing is that, despite the lack of a significant decline, junior miners still didn't give a good account of themselves.
It was a relatively uneventful trading day, as gold declined by 0.30%, the GDX ETF by 0.64%, the GDXJ ETF by 0.96% and the USD Index by 0.27%. In contrast, silver rallied by 0.20%.
However, the GDXJ ETF continued to underperform the S&P 500, as the latter declined by 0.30%. Therefore, our short position continues to execute, and more downside should confront the pair over the medium term.
PMI Problems
With investors in wait-and-see mode for the next fundamental catalyst to propel financial assets in either direction, the prospect of pension fund rebalancing has market participants relatively upbeat. Moreover, with Independence Day on Jul. 4, we may have to wait until after the holiday for the next bout of volatility.
However, while short-term sentiment may have found a floor, the medium-term fundamentals continue to deteriorate. For example, the Dallas Fed released its Texas Manufacturing Outlook Survey on Jun. 27. The headline index declined from -7.3 to -17.7, as the figure “reached lows last seen in May 2020.” In addition, “the outlook uncertainty index shot up to 43.7, a 17-point jump from May.”
More importantly:
“Labor market measures continued to indicate robust employment growth and longer workweeks. The employment index moved down six points to 15.2 but remained well above its series average of 7.7. Twenty-four percent of firms noted net hiring, while 9 percent noted net layoffs. The hours worked index pushed up further, from 7.4 to 11.8.”
In addition:
“Prices and wages continued to increase strongly. The raw materials prices index edged down to 57.5, a reading still more than twice its average of 28.0. The finished goods prices index also moved down, from 41.8 to 33.8, but remained highly elevated. The wages and benefits index came in at 49.9, unchanged from May and markedly higher than its 20.4 average.”
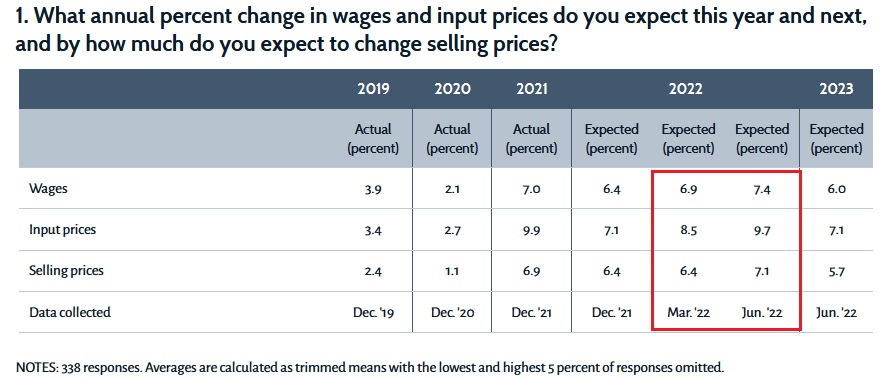
As a result, hawkish implications for the Fed’s dual mandate – maximum employment and price stability – remain alive and well in Texas. Moreover, while output has suffered amid higher interest rates, the pricing pressures remain problematic. For example, with manufacturers increasing their inflation expectations in June, the Fed’s catch-22 is on full display.
Please see below:
 Source: Dallas Fed
To explain, survey respondents are periodically asked about their wage, input, and output price expectations. If you analyze the red box, you can see that all three increased from March to June. Therefore, while investors hope that a few rate hikes will suppress inflation’s reign, manufacturing firms in Texas expect more inflation now than they did in March. As a result, six rate hikes (25 basis point increments) have done little to curb realized or expected inflation.
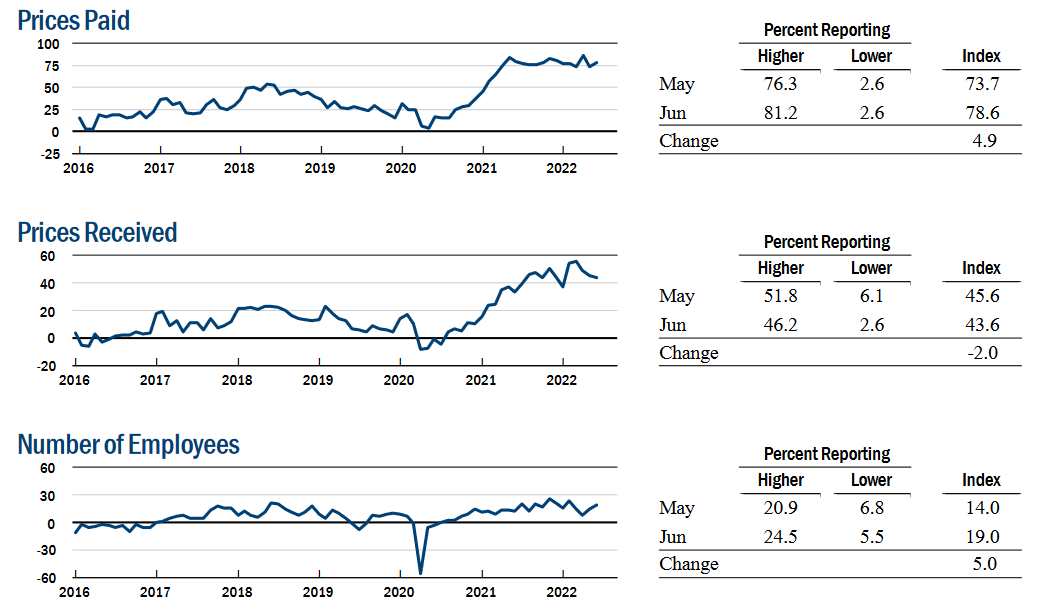
Likewise, the New York Fed released its Empire Manufacturing Survey on Jun. 15. Moreover, while the headline index increased month-over-month (MoM), so did inflation. The report revealed:
“The index for the number of employees increased five points to 19.0, pointing to a solid increase in employment, and the average workweek index came in at 6.4, indicating a small increase in hours worked.”
In addition:
“The prices paid index rose five points to 78.6, several points below its recent record high, and the prices received index edged down to a still elevated 43.6, signaling ongoing substantial increases in both input prices and selling prices.”
Please see below:
 Source: New York Fed
Singing a similar tune, the Philadelphia Fed released its Manufacturing Business Outlook Survey on Jun. 16. The headline index declined six points to -3.3. However:
“Firms continued to report increases in employment, and the employment index moved up from 25.5 to 28.1. More than 31 percent of the firms reported increases in employment, compared with 3 percent that reported decreases; 66 percent reported no change. The average workweek index decreased 4 points, to 11.8.”
Likewise:
“The indicators for prices paid and prices received continue to indicate widespread price increases but decreased this month.”
Therefore, while inflation was less fierce in Philadelphia, both prices paid and received indexes remain stubbornly high.
Please see below:
 Source: Philadelphia Fed
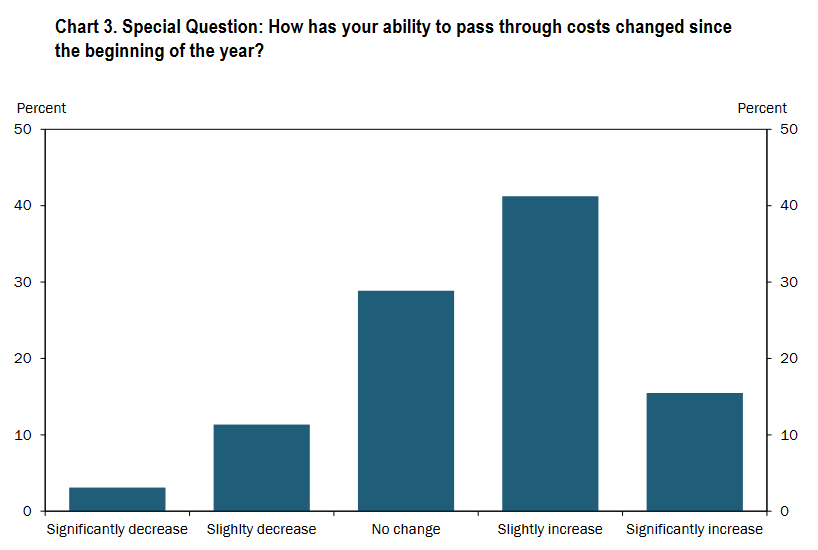
Finally, the Kansas City Fed released its Tenth District Manufacturing Activity survey on Jun. 23. The headline index also declined, falling from 23 in May to 12 in June. Moreover, while the employment index also declined, the prices received index increased from 42 in May to 51 in June.
Furthermore, the majority of respondents claim it’s easier to raise prices now than in January.
Please see below:
 Source: KC Fed
If you analyze the blue bars furthest to the right, you can see that roughly 55% of respondents said their ability to pass through higher input costs has either “slightly” or “significantly” increased since the start of the year.
As a result, inflation dynamics are not heading in the Fed’s desired direction. Therefore, the central bank will have to choose between supporting growth and stoking inflation or pressuring growth and defeating inflation. However, I’ve long warned that the former approach pushed the U.S. into recession four times over ~12 years in the 1970s/1980s.
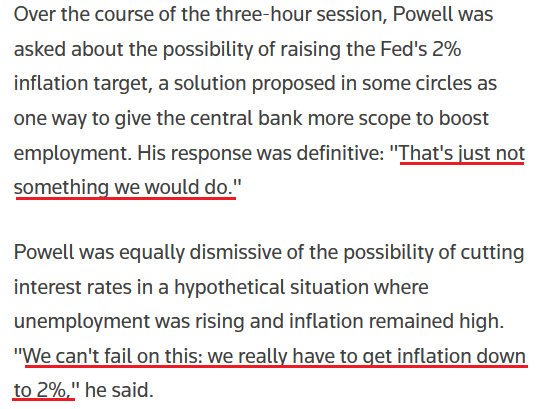
Thus, a half-hearted approach to calming the pricing pressures results in more long-term damage than simply raising rates and inducing a recession. Furthermore, I noted on Jun. 23 that Fed Chairman Jerome Powell understands the precarious pitfalls and realizes that a dovish pivot would be a disaster. I wrote:
I warned on numerous occasions that letting inflation rage would be the worst long-term outcome for the U.S. economy. In a nutshell: turning dovish would hurt the U.S. dollar and embolden commodity traders to bid up prices even more.
As a result, Powell must follow through with his hawkish threats or the progress will reverse and he’ll be back to square one. However, he sounds like a man who realizes that fighting inflation is the only plausible path forward. Moreover, a rising unemployment rate won’t be enough to deter future rate hikes.
Please see below:
 Source: Reuters
Melancholy in Michigan
The University of Michigan released its Consumer Sentiment Index on Jun. 24. Moreover, with the index hitting a new all-time low, I’ve highlighted how inflation is both a financial and political problem. The report revealed:
“The final June reading confirmed the early-June decline in consumer sentiment, settling 0.2 Index points below the preliminary reading and 14.4% below May for the lowest reading on record. Consumers across income, age, education, geographic region, political affiliation, stockholding, and homeownership status all posted large declines.”
“About 79% of consumers expected bad times in the year ahead for business conditions, the highest since 2009. Inflation continued to be of paramount concern to consumers; 47% of consumers blamed inflation for eroding their living standards, just one point shy of the all-time high last reached during the Great Recession.”
Likewise:
“Consumers also expressed the highest level of uncertainty over long-run inflation since 1991, continuing a sharp increase that began in 2021.”
Please see below:
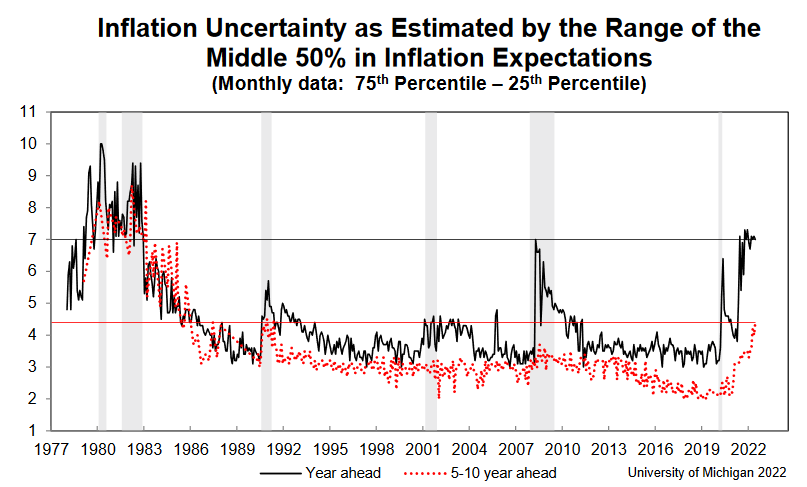
To explain, the black and red dotted lines above track respondents’ median one-year and 5-10-year inflation uncertainty. If you analyze the right side of the chart, you can see that the black line is on par with the global financial crisis (GFC) highs. However, the red dotted line has eclipsed its GFC highs, as long-term inflation has become embedded in Americans’ psyches.
Again, the gray bars on the left show how high inflation is the perfect predictor of U.S. recessions. Therefore, the Fed must address the problem to avoid a decade of economic fits and starts.
To that point, the 1970s-like sentiment-unemployment rate divergence has likely sowed the seeds of an economic malaise.
Please see below:
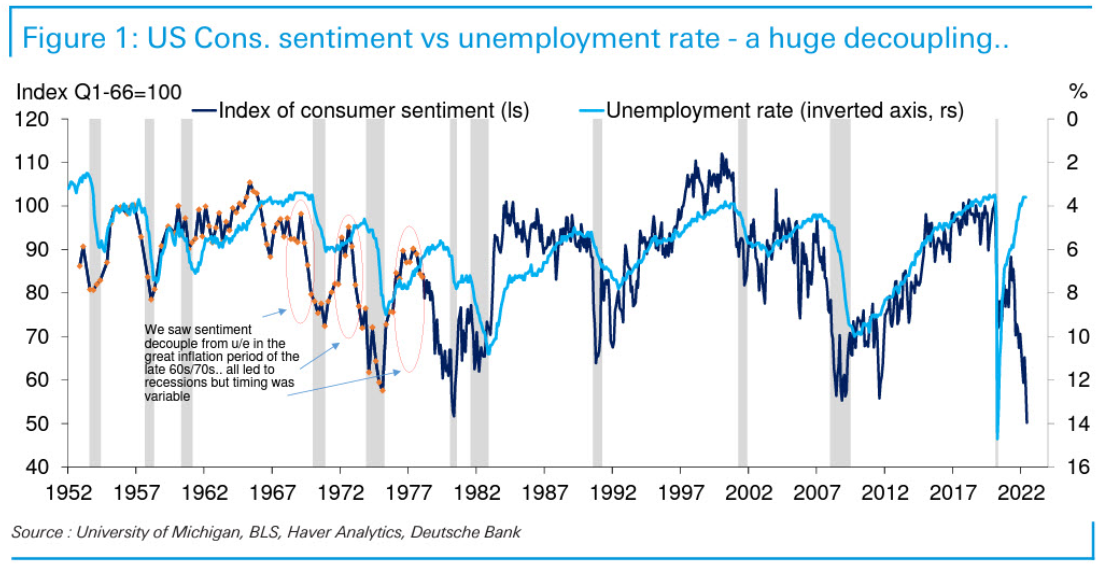
To explain, the dark blue line above tracks the University of Michigan’s Consumer Sentiment Index, while the light blue line above tracks the inverted U.S. unemployment rate. For context, inverted means the latter’s scale is flipped upside down, and a rising light blue line represents a falling U.S. unemployment rate.
Moreover, if you analyze the left side of the chart, the vertical gray bars and annotations show how unanchored inflation often decouples sentiment from the unemployment rate and results in a recession. Likewise, the epic divergence on the right side of the chart is even worse.
In a nutshell: failing to curb the pricing pressures eventually leads to demand destruction, a rising unemployment rate and a recession. Therefore, if Fed officials fail to act, history shows that inflation will inflict pain. As such, directly dealing with the issue is the lesser of two evils.
The Bottom Line
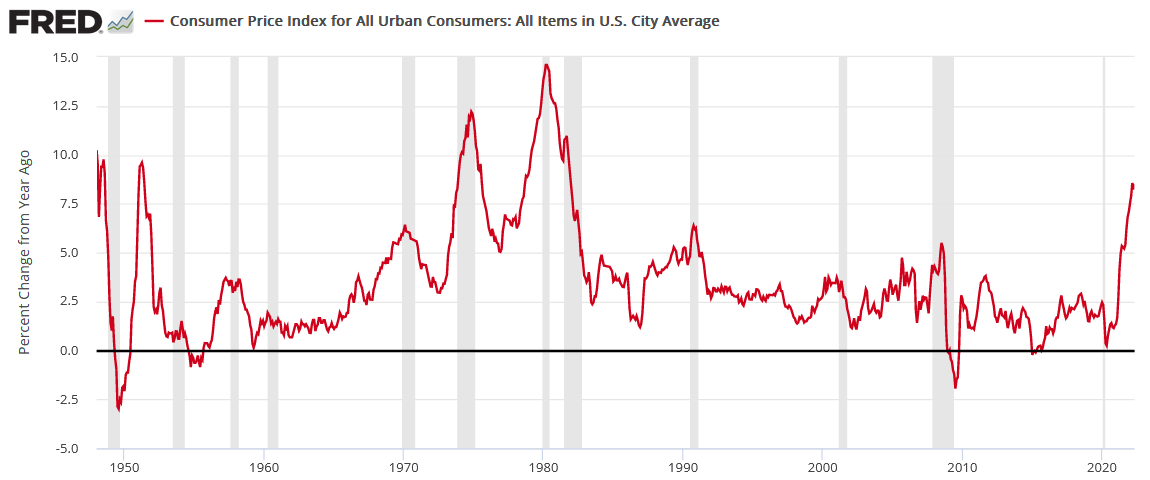
While investors assume that weakening growth will provoke a dovish pivot, a patient Powell won’t cure the U.S.’s economic ills. In contrast, turning dovish would worsen the situation and elicit a re-enactment of the 1950s to 1980s. As evidence, notice how the gray bars (recessions) on the left side of the chart above are more clustered together than on the right? Well, it’s no coincidence that these periods culminated with unanchored inflation. Moreover, the chart below highlights the ominous dynamic.
As such, if Powell wants the U.S. to enjoy a post-1983 economic environment, he needs to get inflation under control.
In conclusion, the PMs were mixed on Jun. 27, as silver ended the day in the green. However, with investors awaiting the next fundamental catalyst, the short-term price action may be subdued. Despite that, the medium-term outlook is unchanged: hawkish Fed policy is necessary to curb inflation, and that realization should uplift the USD Index and U.S. real yields. As a result, the PMs should head in the opposite direction over the medium term.
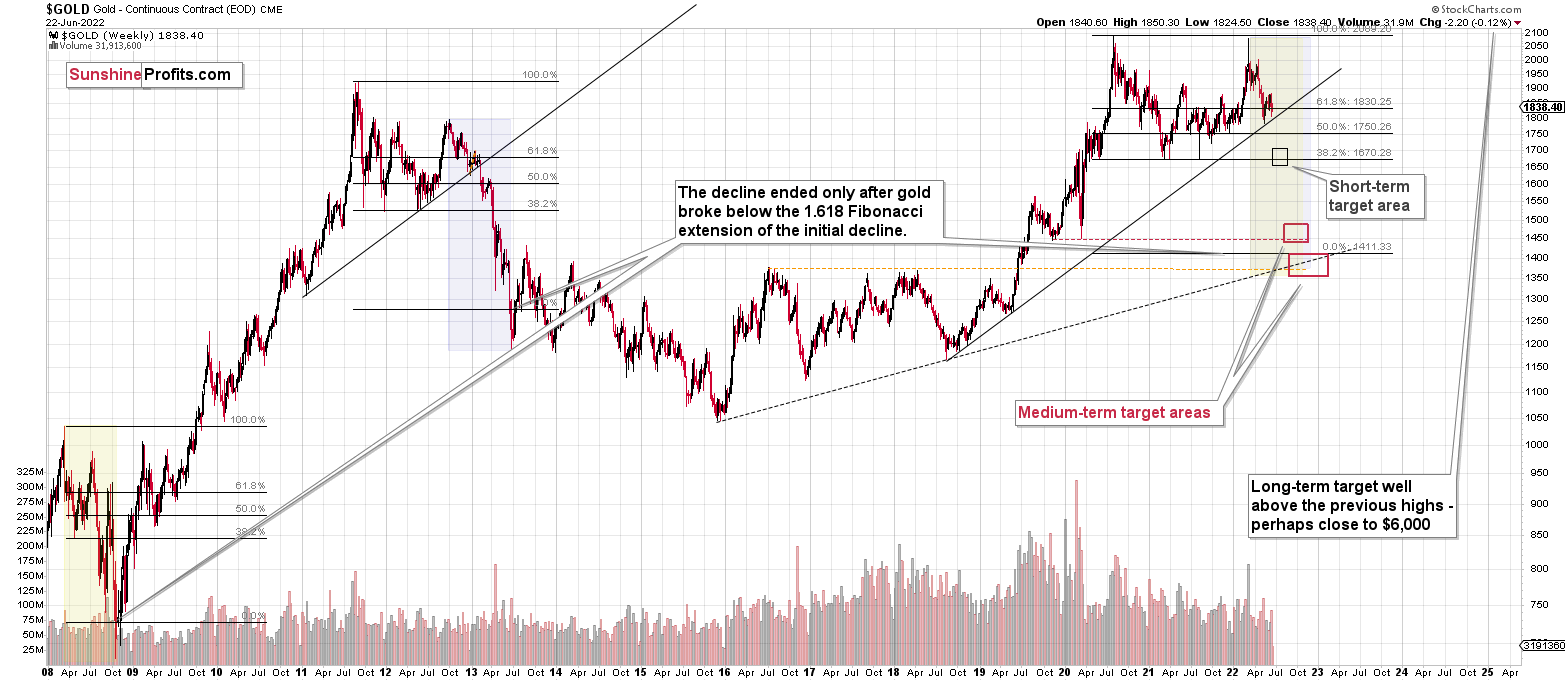
Overview of the Upcoming Part of the Decline
- It seems to me that the precious metals market is already in its medium-term decline that is about to take it much lower (to the 2021 lows in case of gold - $1,650 - $1,700)
- If we see a situation where miners slide in a meaningful and volatile way while silver doesn’t (it just declines moderately), I plan to – once again – switch from short positions in miners to short positions in silver. At this time, it’s too early to say at what price levels this could take place and if we get this kind of opportunity at all – perhaps with gold prices close to $1,600.
- I plan to exit all remaining short positions once gold shows substantial strength relative to the USD Index while the latter is still rallying. This may be the case with gold close to $1,400. I expect silver to fall the hardest in the final part of the move. This moment (when gold performs very strongly against the rallying USD and miners are strong relative to gold after its substantial decline) is likely to be the best entry point for long-term investments, in my view. This can also happen with gold close to $1,400, but at the moment it’s too early to say with certainty.
- The above is based on the information available today, and it might change in the following days/weeks.
You will find my general overview of the outlook for gold on the chart below:
Please note that the above timing details are relatively broad and “for general overview only” – so that you know more or less what I think and how volatile I think the moves are likely to be – on an approximate basis. These time targets are not binding or clear enough for me to think that they should be used for purchasing options, warrants, or similar instruments.
Summary
Summing up, it seems to me that the short-term rally in the precious metals market is over, and the decline will now continue. And the tiny correction’s days are likely numbered, too.
I previously wrote that the profits from the previous long position (congratulations once again) were likely to further enhance the profits on this huge decline, and that’s exactly what happened. The profit potential with regard to the upcoming gargantuan decline remains huge.
As investors are starting to wake up to reality, the precious metals sector (particularly junior mining stocks) is declining sharply. Here are the key aspects of the reality that market participants have ignored:
- rising real interest rates,
- rising USD Index values.
Both of the aforementioned are the two most important fundamental drivers of the gold price. Since neither the USD Index nor real interest rates are likely to stop rising anytime soon (especially now that inflation has become highly political), the gold price is likely to fall sooner or later. Given the analogy to 2012 in gold, silver, and mining stocks, “sooner” is the more likely outcome.
After the final sell-off (that takes gold to about $1,350-$1,500), I expect the precious metals to rally significantly. The final part of the decline might take as little as 1-5 weeks, so it's important to stay alert to any changes.
Also, on an administrative note, due to Przemysław Radomski’s travel schedule, todays’s and Wednesday’s regular Gold & Silver Trading Alerts will cover the fundamental part of the analysis. However, if anything major happens and it impacts his views on the positions that are currently justified from the risk-to-reward point of view, he’ll send you a quick intraday message.
As always, we'll keep you – our subscribers – informed.
To summarize:
Trading capital (supplementary part of the portfolio; our opinion): Full speculative short positions (300% of the full position) in junior mining stocks are justified from the risk to reward point of view with the following binding exit profit-take price levels:
Mining stocks (price levels for the GDXJ ETF): binding profit-take exit price: $27.32; stop-loss: none (the volatility is too big to justify a stop-loss order in case of this particular trade)
Alternatively, if one seeks leverage, we’re providing the binding profit-take levels for the JDST (2x leveraged). The binding profit-take level for the JDST: $18.35; stop-loss for the JDST: none (the volatility is too big to justify a SL order in case of this particular trade).
For-your-information targets (our opinion; we continue to think that mining stocks are the preferred way of taking advantage of the upcoming price move, but if for whatever reason one wants / has to use silver or gold for this trade, we are providing the details anyway.):
Silver futures downside profit-take exit price: $17.22
SLV profit-take exit price: $16.22
ZSL profit-take exit price: $41.47
Gold futures downside profit-take exit price: $1,706
HGD.TO – alternative (Canadian) 2x inverse leveraged gold stocks ETF – the upside profit-take exit price: $11.87
HZD.TO – alternative (Canadian) 2x inverse leveraged silver ETF – the upside profit-take exit price: $31.87
Long-term capital (core part of the portfolio; our opinion): No positions (in other words: cash)
Insurance capital (core part of the portfolio; our opinion): Full position
Whether you’ve already subscribed or not, we encourage you to find out how to make the most of our alerts and read our replies to the most common alert-and-gold-trading-related-questions.
Please note that we describe the situation for the day that the alert is posted in the trading section. In other words, if we are writing about a speculative position, it means that it is up-to-date on the day it was posted. We are also featuring the initial target prices to decide whether keeping a position on a given day is in tune with your approach (some moves are too small for medium-term traders, and some might appear too big for day-traders).
Additionally, you might want to read why our stop-loss orders are usually relatively far from the current price.
Please note that a full position doesn't mean using all of the capital for a given trade. You will find details on our thoughts on gold portfolio structuring in the Key Insights section on our website.
As a reminder - "initial target price" means exactly that - an "initial" one. It's not a price level at which we suggest closing positions. If this becomes the case (as it did in the previous trade), we will refer to these levels as levels of exit orders (exactly as we've done previously). Stop-loss levels, however, are naturally not "initial", but something that, in our opinion, might be entered as an order.
Since it is impossible to synchronize target prices and stop-loss levels for all the ETFs and ETNs with the main markets that we provide these levels for (gold, silver and mining stocks - the GDX ETF), the stop-loss levels and target prices for other ETNs and ETF (among other: UGL, GLL, AGQ, ZSL, NUGT, DUST, JNUG, JDST) are provided as supplementary, and not as "final". This means that if a stop-loss or a target level is reached for any of the "additional instruments" (GLL for instance), but not for the "main instrument" (gold in this case), we will view positions in both gold and GLL as still open and the stop-loss for GLL would have to be moved lower. On the other hand, if gold moves to a stop-loss level but GLL doesn't, then we will view both positions (in gold and GLL) as closed. In other words, since it's not possible to be 100% certain that each related instrument moves to a given level when the underlying instrument does, we can't provide levels that would be binding. The levels that we do provide are our best estimate of the levels that will correspond to the levels in the underlying assets, but it will be the underlying assets that one will need to focus on regarding the signs pointing to closing a given position or keeping it open. We might adjust the levels in the "additional instruments" without adjusting the levels in the "main instruments", which will simply mean that we have improved our estimation of these levels, not that we changed our outlook on the markets. We are already working on a tool that would update these levels daily for the most popular ETFs, ETNs and individual mining stocks.
Our preferred ways to invest in and to trade gold along with the reasoning can be found in the how to buy gold section. Furthermore, our preferred ETFs and ETNs can be found in our Gold & Silver ETF Ranking.
As a reminder, Gold & Silver Trading Alerts are posted before or on each trading day (we usually post them before the opening bell, but we don't promise doing that each day). If there's anything urgent, we will send you an additional small alert before posting the main one.
Thank you.
Przemyslaw Radomski, CFA
Founder, Editor-in-chief

