

Briefly: in our opinion, full (300% of the regular position size) speculative short positions in junior mining stocks are justified from the risk/reward point of view at the moment of publishing this Alert.
PLEASE NOTE:
Dear Subscribers,
there will be no regular Gold & Silver Trading Alert tomorrow, but if anything major happens, you will be informed via intraday Alerts.
Stay tuned!
While the S&P 500 continued its squeeze higher on Oct. 28, the short covering has morphed into another bout of FOMO. However, while stock investors assume that a dovish pivot is on the horizon, operating in a vacuum should prove painful for the bulls.
For example, gold, silver, and mining stocks declined on Oct. 28, as the PMs did not share the S&P 500’s enthusiasm. Furthermore, the USD Index rose slightly, and the U.S. 10-Year Treasury yield closed back above 4%. Likewise, the futures market has priced in a peak U.S. federal funds rate (FFR) of 4.90% in May 2023.
As a result, the bond, FX, commodity, and futures markets are not buying the S&P 500’s pivot prediction.
Please see below:
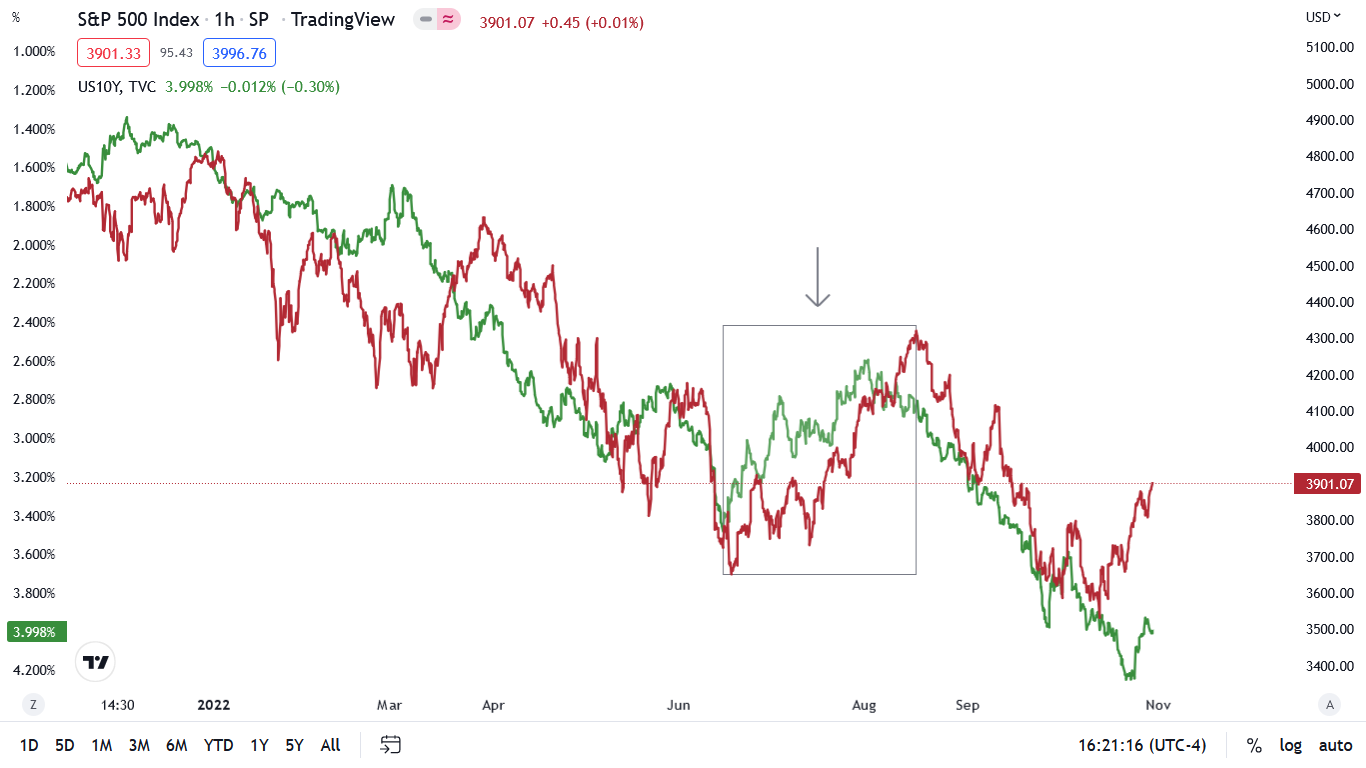
To explain, the red line above tracks the one-hour movement of the S&P 500, while the green line above tracks the inverted (down means up) one-hour movement of the U.S. 10-Year Treasury yield. As you can see, higher interest rates have weighed on the S&P 500 in 2022.
Moreover, the box with the arrow shows how a sharp decline in the U.S. 10-Year Treasury yield (green line rising) helped underwrite the S&P 500’s June to August rally. However, if you analyze the right side of the chart, you can see that the U.S. 10-Year Treasury yield’s recent pullback was relatively small.
Also, with the Treasury benchmark rising on Oct. 28, bond investors are not positioning for a pivot.
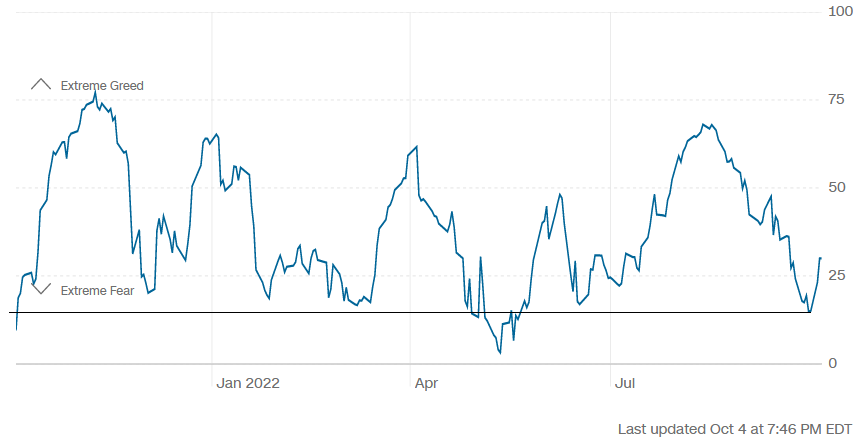
In addition, sentiment is an important component; and when CNN’s Fear & Greed Index highlighted investors’ anxiety, I warned on Oct. 5 that depressed sentiment supported a bear market rally. I wrote:
Because asset prices don’t move in a straight line, countertrend moves are an unfortunate byproduct of medium-term investing. So while the GDXJ ETF’s recent uprising is far from fun, bear market rallies are commonplace along the journey to a final low (…).
CNN’s Fear & Greed Index hit abnormally low levels, which signaled extreme fear in the financial markets.
Please see below:
 Source: CNN
To explain, the blue line above tracks CNN’s Fear & Greed Index. If you analyze the horizontal black line, you can see that the index ended September at its lowest level since May. Thus, over-positioning helped fuel the S&P 500’s squeeze higher.
However, with the metric now at one of its highest levels in 2022, fear has turned into greed, and sentiment has flipped from bullish to bearish.
Please see below:
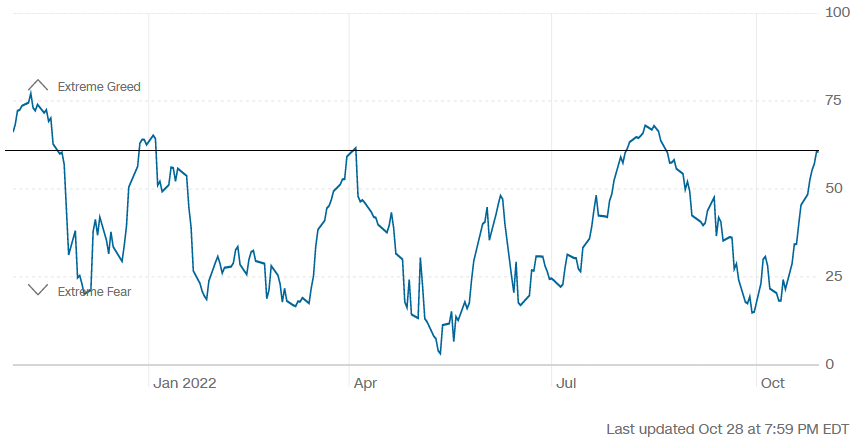
To explain, the horizontal black line above shows that CNN’s Fear & Greed Index is only one and seven points away from its April and August 2022 peaks. Moreover, these were the highest readings since the 2022 bear market took shape.
As a result, while the S&P 500 may not turn on a dime, the bear market rally is long in the tooth and a medium-term reversal should weigh heavily on gold, silver and mining stocks.
Data-Driven Decisions
While narratives are entertaining, the data determines the direction of the fundamentals; and with more hawkish economic releases hitting the wire in recent days, the results are bullish for the FFR, real yields, and the USD Index.
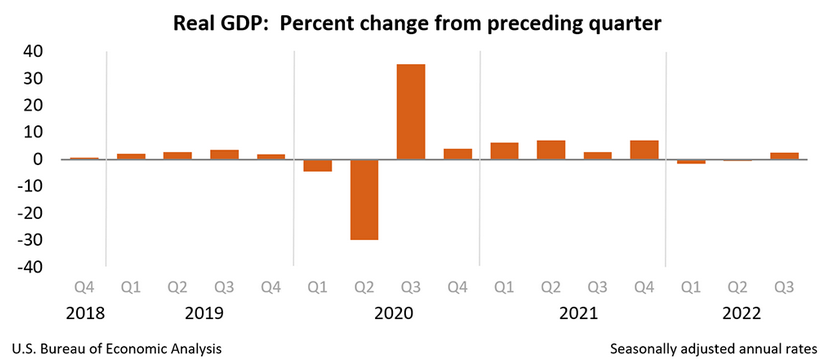
For example, the U.S. Bureau of Economic Analysis (BEA) released its advanced estimate of Q3 real GDP growth on Oct. 27. The report revealed:
Real GDP “increased at an annual rate of 2.6 percent in the third quarter of 2022,” which “reflected increases in exports, consumer spending, nonresidential fixed investment, federal government spending, and state and local government spending, that were partly offset by decreases in residential fixed investment and private inventory investment.”
As such, while the recession crowd has grown confident in recent months, unanchored inflation and resilient growth should keep the Fed’s foot on the hawkish accelerator.
Please see below:
Likewise, with Americans’ spending behavior continuing to outperform, we haven’t reached the demand destruction required to warrant a dovish pivot.
Please see below:
 Source: Investing.com
To explain, the BEA revealed on Oct. 28 that personal income increased by 0.4% month-over-month (MoM) in September, which exceeded the consensus estimate. More importantly, personal spending increased by 0.6% MoM, which highlights Americans' ability and willingness to splurge. Thus, I've warned repeatedly that the Fed's inflation fight will be one of attrition.
To that point, the BEA also revealed on Oct. 28 that the headline PCE Index increased from 6.22% year-over-year (YoY) in August to 6.24% YoY in September, while the core PCE Index increased from 4.89% YoY in August to 5.15% YoY in September.
Please see below:
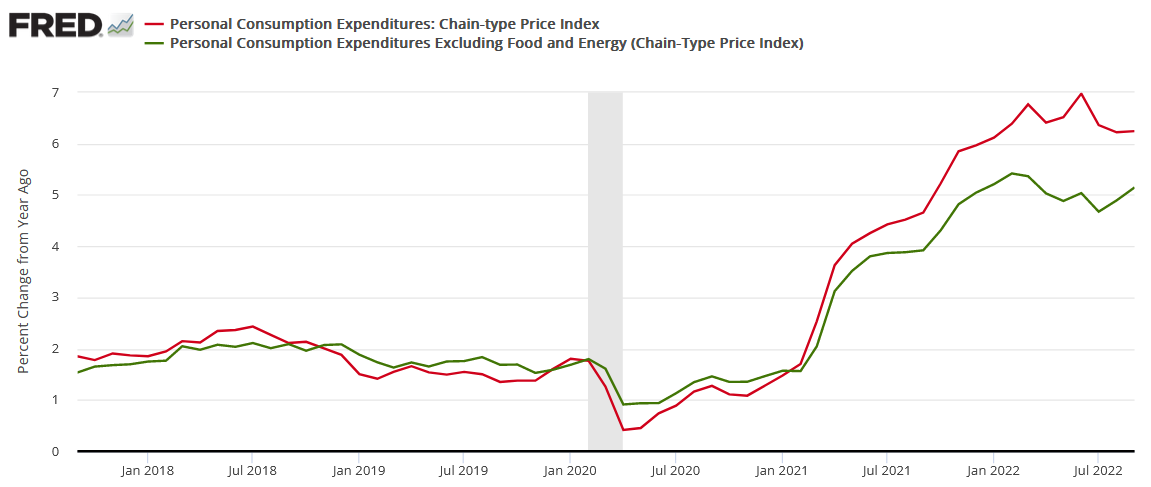
To explain, the red and green lines above track the YoY percentage changes in the headline and core PCE Indexes. For context, the latter excludes the inflationary impacts of food and energy, but it’s a better indicator of consumer inflation, and the metric has increased YoY for the last two months.
Therefore, the crowd doesn’t realize that bullish corporate earnings (outside of Big Tech) are also bullish for the FFR. In a nutshell: when corporate prints are resilient, demand allows companies to pass on higher input costs, which stokes inflation. As such, what’s perceived as constructive is actually destructive. To explain, I wrote on Oct. 18:
Narratives don't create recessions, and the important point is that the longer consumer spending remains elevated, the higher the FFR will need to rise; and while investor sentiment was boosted by short-covering and resilient corporate earnings, the latter's strength is bearish because it means the Fed has much more work to do.
So, while the crowd may celebrate that earnings have 'held up,' the reality is that the longer they remain durable, the longer inflation will persist.
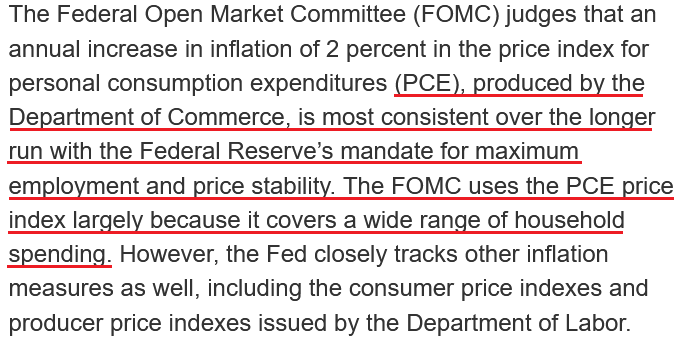
In addition, while the Consumer Price Index (CPI) garners all of investors' attention, please remember that the PCE Index is the Fed's preferred inflation gauge; and with the headline and core metrics increasing YoY in September, nothing in the data supports a pivot.
Please see below:
 Source: U.S. Fed
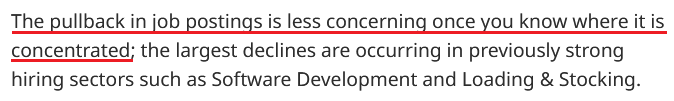
Finally, Indeed released its latest U.S. labor market update on Oct. 27. The report revealed:
“The U.S, labor market remains hot. As the U.S. economy bounces back from the initial COVID-19 shock, demand for labor has grown much more quickly than supply. Employment has rebounded, wages are growing quickly, and joblessness is approaching pre-pandemic levels. The labor market is, however, showing some signs of normalizing, particularly as demand for workers cools….
“As of October 21, 2022, job postings on Indeed were 48.8% above their pre-pandemic baseline. New job postings, defined as those on Indeed for seven days or less, are also well above their pre-pandemic baseline, up 55%. While job posting growth has slowed, the leveling out has been relatively moderate.”
Please see below:
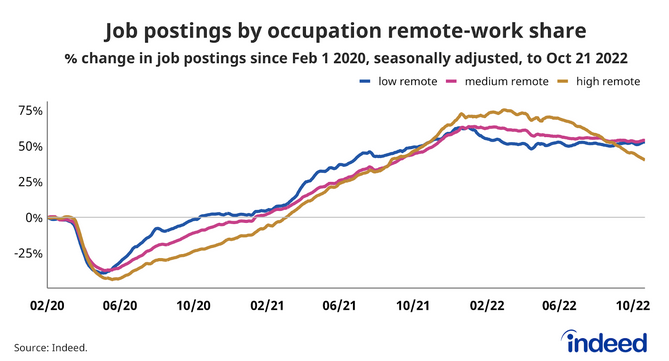
To explain, the blue, pink, and brown lines above track the percentage change in job postings for low, medium, and highly remote positions. If you analyze the movement of the brown line, you can see that highly remote opportunities have fallen somewhat materially. However, these are predominantly work-from-home listings in sectors that benefited from the pandemic.
In contrast, the blue and pink lines have barely budged, which highlights how employment opportunities for in-person roles remain resilient despite the Fed’s 12 25 basis point rate hikes in 2022. As a result, demand has not normalized, and the FFR needs to go much higher to curb inflation.
 Source: Indeed
Technically Speaking
Gold declined visibly on Friday, but the decline in silver and mining stocks was less visible. Why is that so? It’s quite obvious if you focus on what happened in the main stock indices.
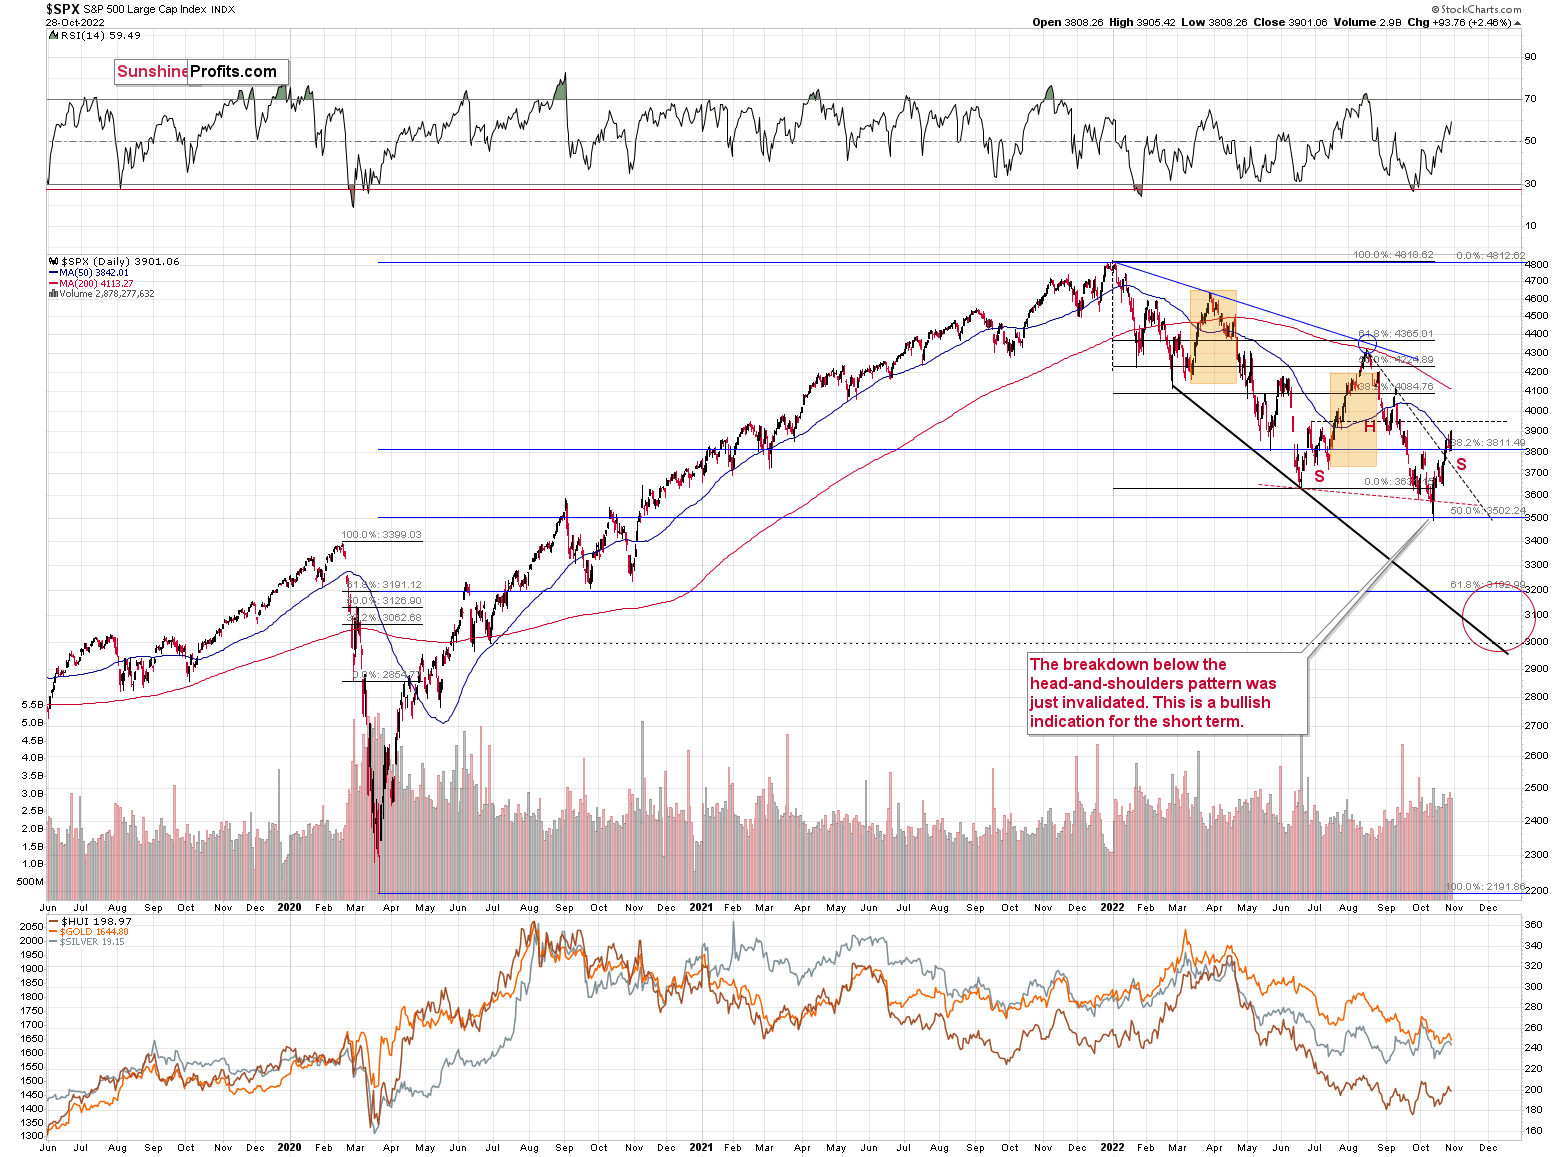
The S&P 500 rallied to new monthly highs, which caught investors’ eyes. However, as the index didn’t move above its June 2022 high, the head and shoulders formation could still be completed.
Consequently, nothing really changed based on Friday’s session, and what I wrote in Friday’s extensive analysis remains up-to-date.
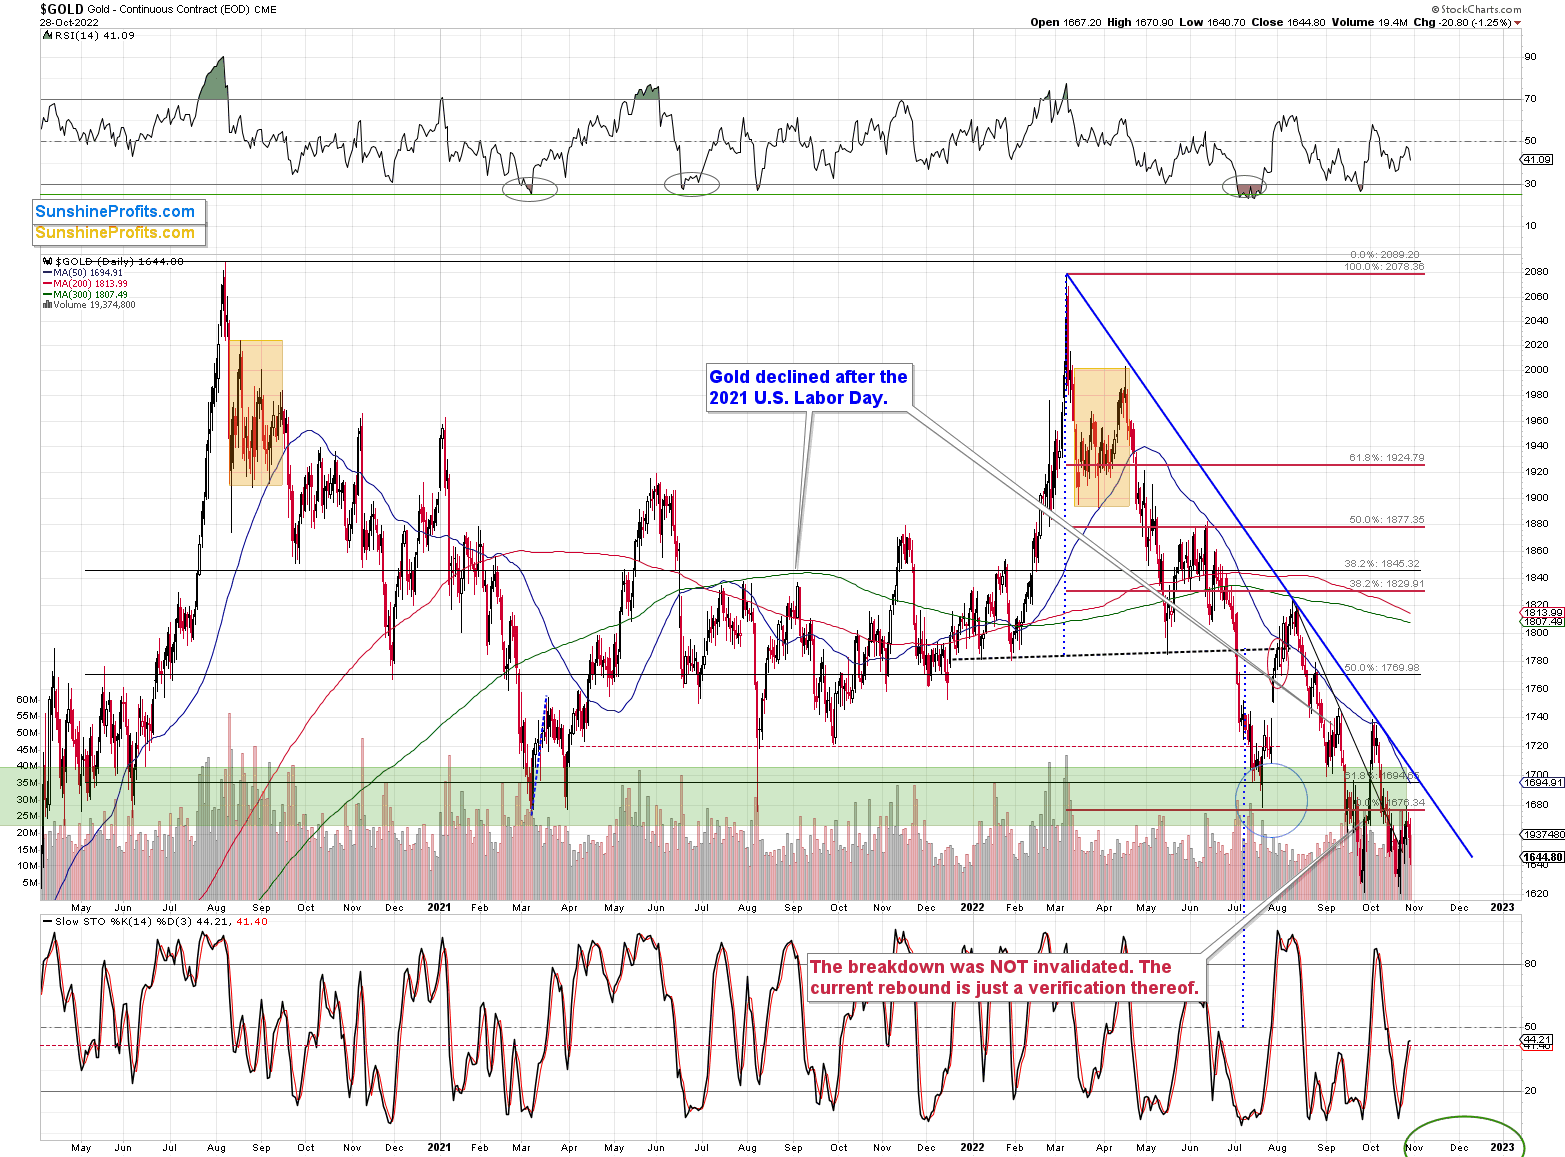
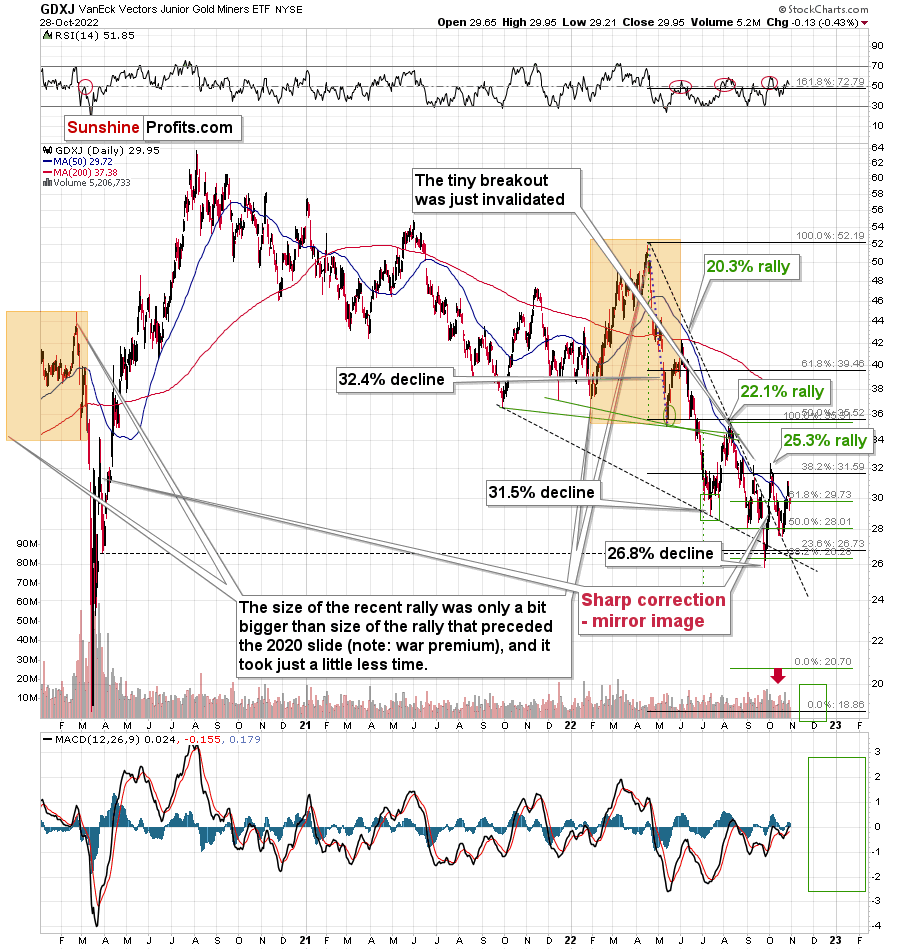
Gold is now relatively close to its 2022 lows, while junior miners are not, and it’s most likely due to the stock market’s recent strength.
Can this positive impact from stocks remain intact? It can, but it’s highly unlikely. The increasing real rates are simply strongly bearish, and for the above to happen, two things need to take place at the same time:
- Stocks would have to continue to rally in the following weeks / months.
- The relatively strong impact that stocks recently had on the junior miners’ performance would have to persist for longer.
Both are unlikely.
Starting with the latter, gold is ultimately a much more important price driver for junior miners than stocks are. After all, gold is the only current or expected source of revenue (thus profits) in the future.
As for the former, the rally is likely to be reversed, as I explained many times. For example, that’s what the world stock ($MSWORLD) index very strongly implies (you will find its analysis in Friday’s Gold & Silver Trading Alert).
The Bottom Line
While the stock market heads in one direction, the bond, FX, commodity, and futures markets have headed in another. Moreover, with employment still resilient and inflation highly problematic, the prospect of a pivot is more semblance than substance. Therefore, while the Fed could pull a Bank of Canada (BoC) and surprise with 50 basis points on Nov. 2 (though, unlikely), the FFR’s peak is much more important than what happens at any single meeting. Thus, the stock bulls should learn this lesson the hard way over the medium term.
In conclusion, the PMs declined on Oct. 28, as the S&P 500’s bullish price action contrasted the moves in other markets. So, while the USD Index and the U.S. 10-Year real yield have largely been in consolidation mode, it’s normal for a cooling-off period to occur after such strong rallies. However, we expect the pair to hit higher highs in the months ahead, and a realization should culminate with lower lows for gold, silver, mining stocks and the S&P 500.
Overview of the Upcoming Part of the Decline
- It seems to me that the corrective upswing is over, and that the next big move lower is already underway.
- If we see a situation where miners slide in a meaningful and volatile way while silver doesn’t (it just declines moderately), I plan to – once again – switch from short positions in miners to short positions in silver. At this time, it’s too early to say at what price levels this could take place and if we get this kind of opportunity at all – perhaps with gold prices close to $1,500 - $1,550.
- I plan to switch from the short positions in junior mining stocks or silver (whichever I’ll have at that moment) to long positions in junior mining stocks when gold / mining stocks move to their 2020 lows (approximately). While I’m probably not going to write about it at this stage yet, this is when some investors might consider getting back in with their long-term investing capital (or perhaps 1/3 or 1/2 thereof).
- I plan to return to short positions in junior mining stocks after a rebound – and the rebound could take gold from about $1,450 to about $1,550, and it could take the GDXJ from about $20 to about $24.
- I plan to exit all remaining short positions once gold shows substantial strength relative to the USD Index while the latter is still rallying. This may be the case with gold prices close to $1,400 and GDXJ close to $15 . This moment (when gold performs very strongly against the rallying USD and miners are strong relative to gold after its substantial decline) is likely to be the best entry point for long-term investments, in my view. This can also happen with gold close to $1,400, but at the moment it’s too early to say with certainty.
- The above is based on the information available today, and it might change in the following days/weeks.
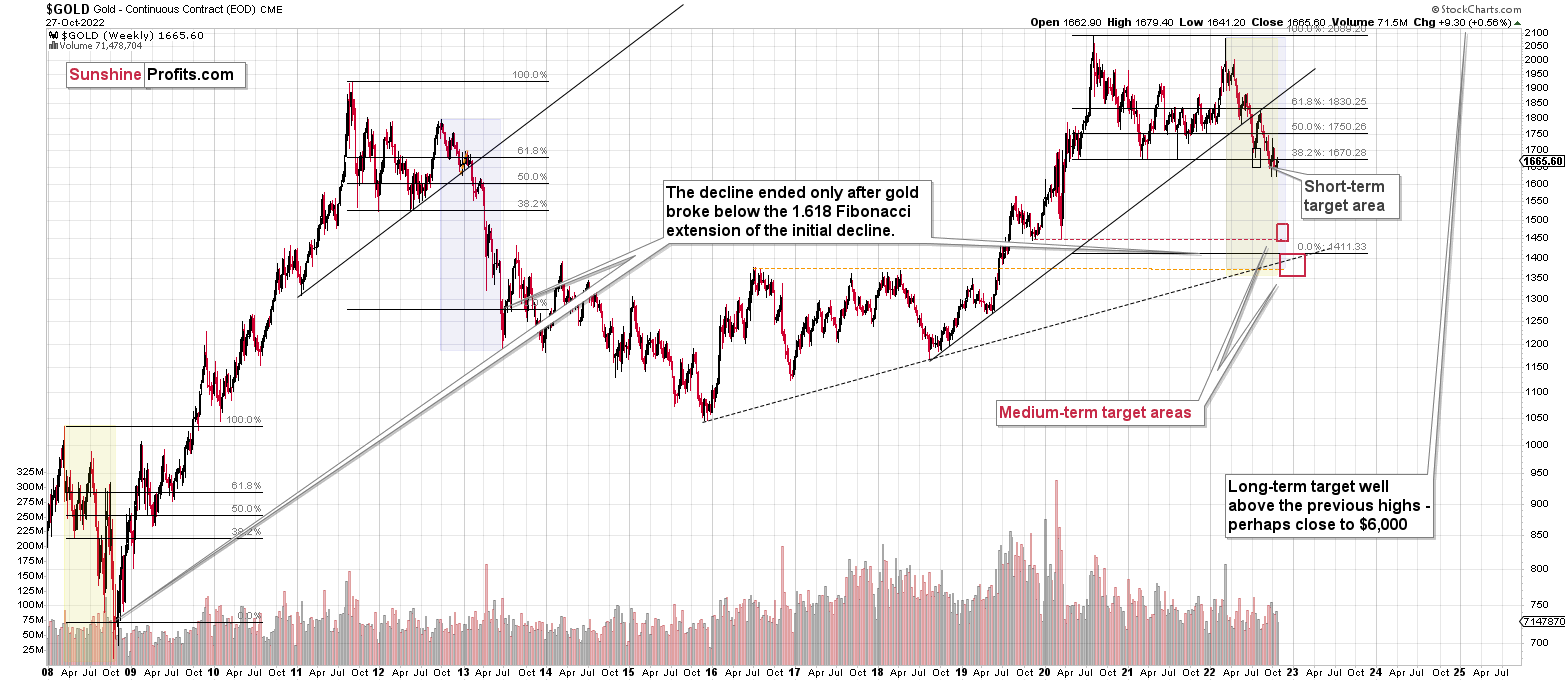
You will find my general overview of the outlook for gold on the chart below:
Please note that the above timing details are relatively broad and “for general overview only” – so that you know more or less what I think and how volatile I think the moves are likely to be – on an approximate basis. These time targets are not binding nor clear enough for me to think that they should be used for purchasing options, warrants, or similar instruments.
Summary
Summing up, it seems that the biggest part of the 2013-like decline is taking place right now, and – while I can’t make any promises regarding performance - it seems likely to me that our big profits are about to become huge, and then ridiculously big in the relatively near future.
As I have written before, the recent upswing didn’t change anything. While the mining stocks appeared “strong” recently, it seems to me that it’s just a reflection of the temporary (in my view) strength in the general stock market. And as stocks decline, mining stocks – and especially junior mining stocks – are likely to truly slide.
Things might happen very fast in the coming days, and if I plan to make any adjustments, I’ll keep you informed. Still, if the targets that I’m mentioning in the “Trading” part of the summary are reached, I think that profits should be taken off the table without an additional confirmation from me. I will probably get on the long side of the market at that time, but I’ll send a confirmation if I decide to do so.
After the final sell-off (that takes gold to about $1,350-$1,500), I expect the precious metals to rally significantly. The final part of the decline might take as little as 1-5 weeks, so it's important to stay alert to any changes.
As always, we'll keep you – our subscribers – informed.
To summarize:
Trading capital (supplementary part of the portfolio; our opinion): Full speculative short positions (300% of the full position) in junior mining stocks are justified from the risk to reward point of view with the following binding exit profit-take price levels:
Mining stocks (price levels for the GDXJ ETF): binding profit-take exit price: $20.32; stop-loss: none (the volatility is too big to justify a stop-loss order in case of this particular trade)
Alternatively, if one seeks leverage, we’re providing the binding profit-take levels for the JDST (2x leveraged). The binding profit-take level for the JDST: $27.87; stop-loss for the JDST: none (the volatility is too big to justify a SL order in case of this particular trade).
For-your-information targets (our opinion; we continue to think that mining stocks are the preferred way of taking advantage of the upcoming price move, but if for whatever reason one wants / has to use silver or gold for this trade, we are providing the details anyway.):
Silver futures downside profit-take exit price: $12.32
SLV profit-take exit price: $11.32
ZSL profit-take exit price: $74.87
Gold futures downside profit-take exit price: $1,504
HGD.TO – alternative (Canadian) 2x inverse leveraged gold stocks ETF – the upside profit-take exit price: $18.47
HZD.TO – alternative (Canadian) 2x inverse leveraged silver ETF – the upside profit-take exit price: $46.87
Long-term capital (core part of the portfolio; our opinion): No positions (in other words: cash)
Insurance capital (core part of the portfolio; our opinion): Full position
Whether you’ve already subscribed or not, we encourage you to find out how to make the most of our alerts and read our replies to the most common alert-and-gold-trading-related-questions.
Please note that we describe the situation for the day that the alert is posted in the trading section. In other words, if we are writing about a speculative position, it means that it is up-to-date on the day it was posted. We are also featuring the initial target prices to decide whether keeping a position on a given day is in tune with your approach (some moves are too small for medium-term traders, and some might appear too big for day-traders).
Additionally, you might want to read why our stop-loss orders are usually relatively far from the current price.
Please note that a full position doesn't mean using all of the capital for a given trade. You will find details on our thoughts on gold portfolio structuring in the Key Insights section on our website.
As a reminder - "initial target price" means exactly that - an "initial" one. It's not a price level at which we suggest closing positions. If this becomes the case (as it did in the previous trade), we will refer to these levels as levels of exit orders (exactly as we've done previously). Stop-loss levels, however, are naturally not "initial", but something that, in our opinion, might be entered as an order.
Since it is impossible to synchronize target prices and stop-loss levels for all the ETFs and ETNs with the main markets that we provide these levels for (gold, silver and mining stocks - the GDX ETF), the stop-loss levels and target prices for other ETNs and ETF (among other: UGL, GLL, AGQ, ZSL, NUGT, DUST, JNUG, JDST) are provided as supplementary, and not as "final". This means that if a stop-loss or a target level is reached for any of the "additional instruments" (GLL for instance), but not for the "main instrument" (gold in this case), we will view positions in both gold and GLL as still open and the stop-loss for GLL would have to be moved lower. On the other hand, if gold moves to a stop-loss level but GLL doesn't, then we will view both positions (in gold and GLL) as closed. In other words, since it's not possible to be 100% certain that each related instrument moves to a given level when the underlying instrument does, we can't provide levels that would be binding. The levels that we do provide are our best estimate of the levels that will correspond to the levels in the underlying assets, but it will be the underlying assets that one will need to focus on regarding the signs pointing to closing a given position or keeping it open. We might adjust the levels in the "additional instruments" without adjusting the levels in the "main instruments", which will simply mean that we have improved our estimation of these levels, not that we changed our outlook on the markets. We are already working on a tool that would update these levels daily for the most popular ETFs, ETNs and individual mining stocks.
Our preferred ways to invest in and to trade gold along with the reasoning can be found in the how to buy gold section. Furthermore, our preferred ETFs and ETNs can be found in our Gold & Silver ETF Ranking.
As a reminder, Gold & Silver Trading Alerts are posted before or on each trading day (we usually post them before the opening bell, but we don't promise doing that each day). If there's anything urgent, we will send you an additional small alert before posting the main one.
Thank you.
Przemyslaw K. Radomski, CFA
Founder, Editor-in-chief

