

Briefly: in our opinion, full (300% of the regular position size) speculative short positions in junior mining stocks are justified from the risk/reward point of view at the moment of publishing this Alert.
The situation in the precious metals market continues to develop in tune with my previous expectations, and the profits on our short position in junior miners have just increased (and this happened soon after we took profits from previous long positions).
Since the above is the case, practically everything that I wrote yesterday remains up-to-date, and thus, today’s analysis will serve as a quick update. Let’s start with the USD Index and my previous comments on it:
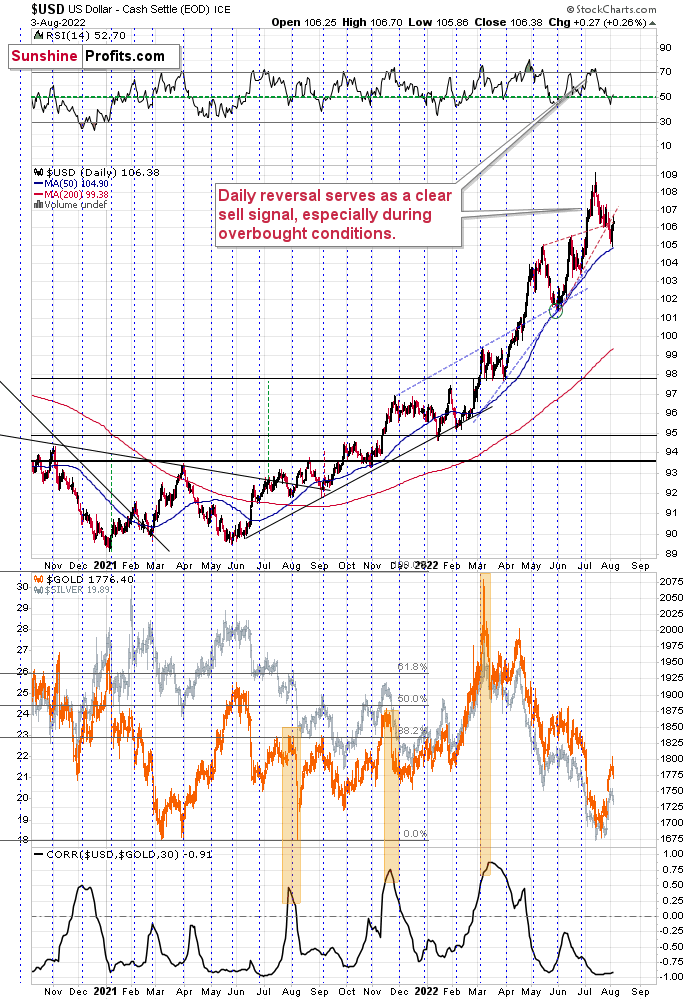
This move is in tune with what we saw at previous local bottoms. The RSI moved slightly below 50, and it’s the turn of the month – this combination was enough to trigger rallies in the U.S. dollar index.
Let’s keep in mind that the latter tends to form important bottoms close to the middle of the year.
So, the scenario in which the USD Index bottoms shortly (or that it just bottomed) seems quite likely.
There’s also the possibility that the USD Index keeps declining until it reaches the very strong support at about the 104 level – the previous long-term highs. Right now, it’s at about 105.5, which means that it could decline by another 1.5 index points or so. It doesn’t necessarily mean that gold, silver, and mining stocks would need to rally substantially if the above materialized. Conversely, since gold might now be reluctant to react to the USD’s lead and miners might be reluctant to react to gold’s lead, it seems that the possible upside for junior miners is very limited.
In other words, even if the big decline really picks up in a few weeks, I think that the risk-to-reward ratio already favors being on the short side of the precious metals sector. In particular, on the short side of junior mining stocks.
That’s exactly what happened.
The USD Index declined quite visibly yesterday [on Tuesday], almost reached its 50-day moving average, and then rallied back up – very close to the turn of the month.
Was that the final short-term bottom? It might have been, but it could still be the case that it moves to 104 in order to bottom there. However, even if that happens, it won’t change the fact that gold didn’t want to react to lower USDX prices recently, and thus the additional decline in the USDX would only be likely to trigger back-and-forth movement in gold, not a profound rally.
As far as gold is concerned, I previously wrote the following:
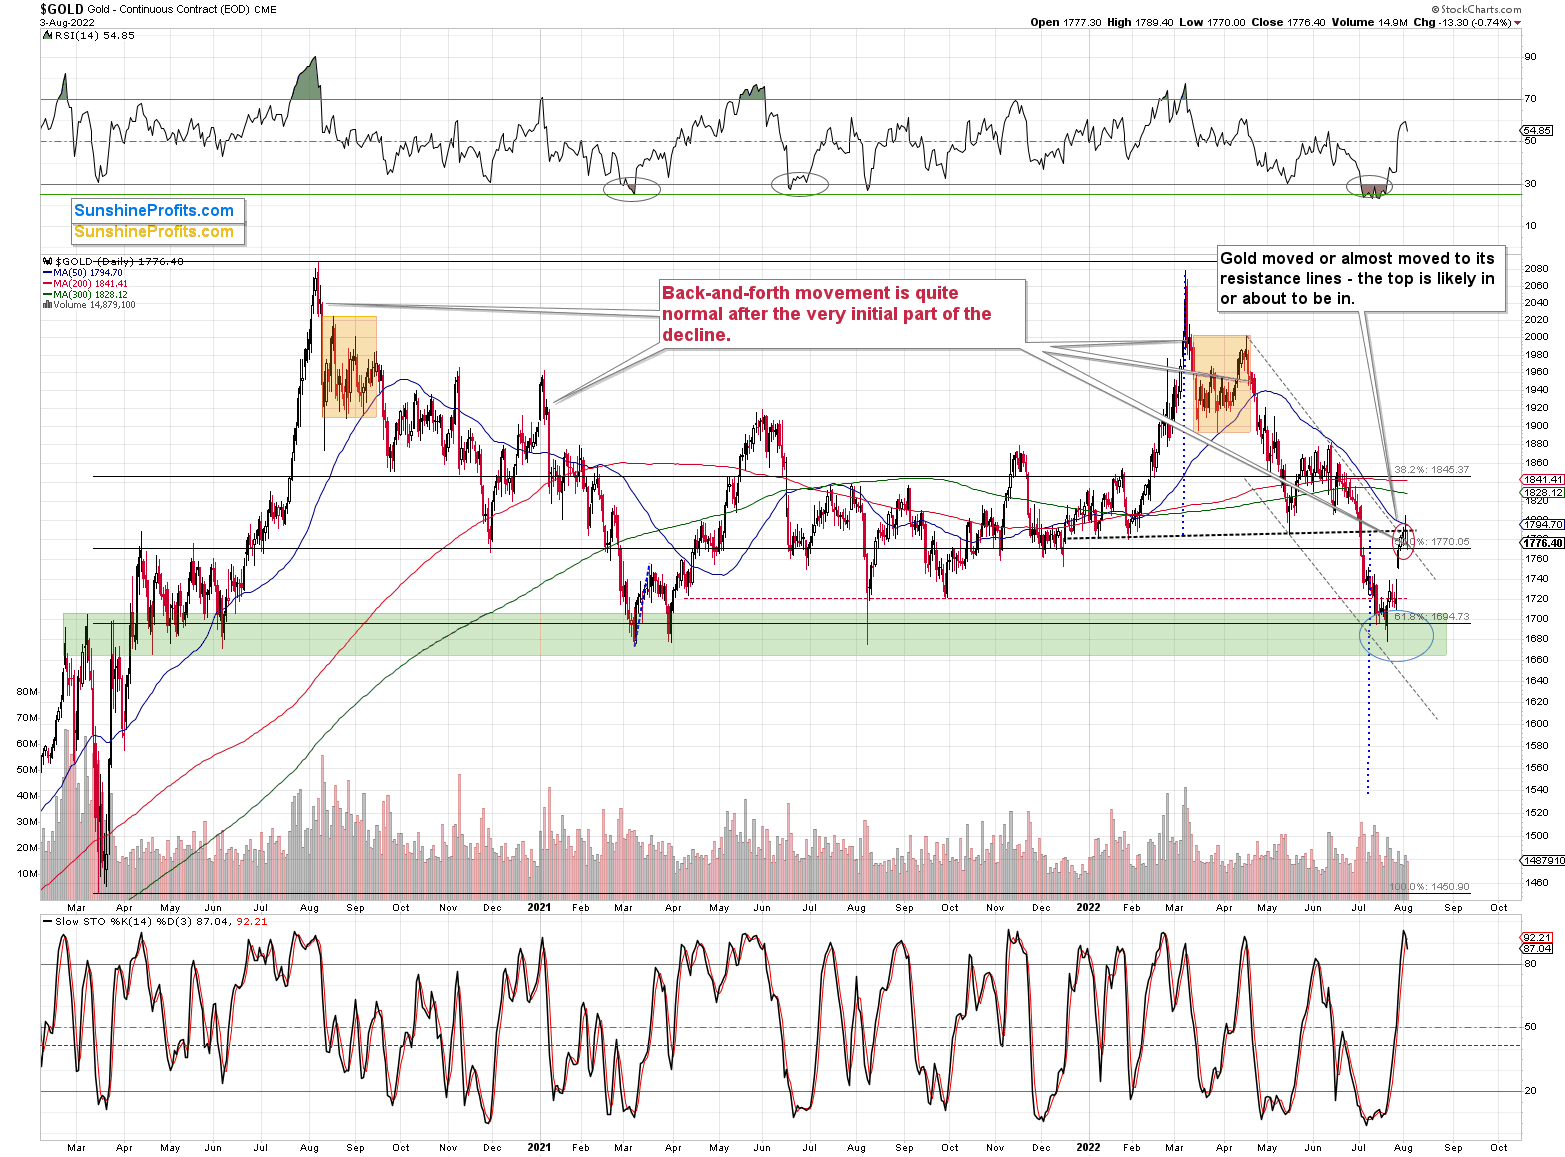
The above gold futures chart doesn’t fully show the extent of yesterday’s decline (the data will likely catch up after today’s session), but it does tell us that gold just verified the move back to the neck level of the previously broken head and shoulders pattern. A decline from here will have profoundly bearish implications because, based on this pattern, gold is likely to decline to at least $1,540.
Indeed, the above chart shows a decline in gold futures and some intraday back-and-forth movement. Please note that this kind of movement is what tends to take place right after the very first part of a bigger decline. I featured some of those cases on the above chart (pointers coming from the red comment box).
Consequently, what we see right now is bearish. Moreover, if we don’t see a decline today, it will be in tune with what we saw previously.
While the GLD ETF moved higher by 0.24% yesterday, the GDXJ ETF – a proxy for junior mining stocks – declined by 1.72% (in terms of the daily closing prices).
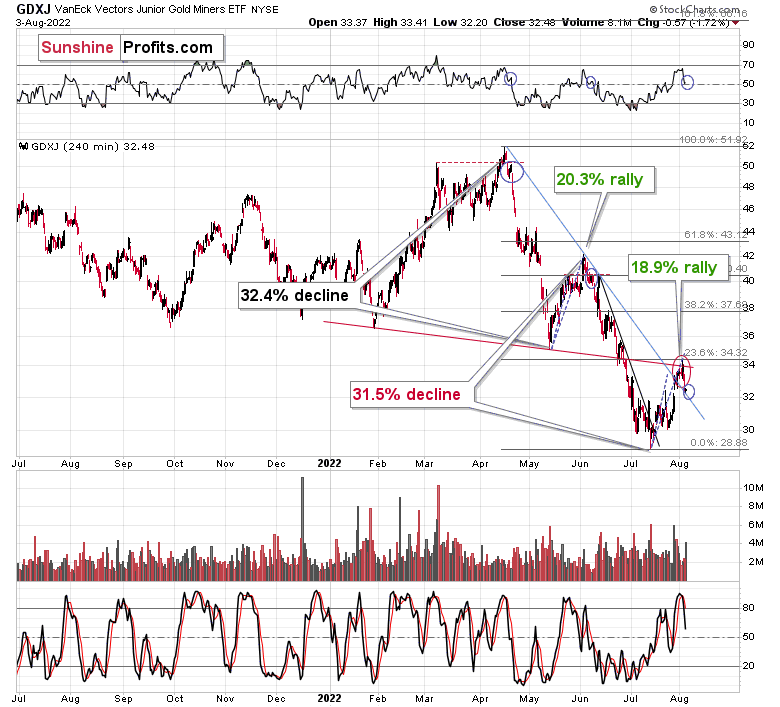
After moving to the 23.6% Fibonacci retracement level and above the neck level of the previously broken head and shoulders pattern, the GDXJ declined, and ended the day 1.34% higher, thus making our short positions profitable.
The stochastic indicator flashed a sell signal, and there were only a few times this year when that happened, while the RSI was very close to the 70 level. That was during the March, April, and early-June peaks. These were all important tops, and the two most recent ones were followed by significant short-term declines. It seems that we’re likely to see one once again.
This means that my previous comments on the above chart remain up-to-date.
What’s also quite interesting on the above chart is the similarity between the recent upswing and the one that we saw in May and early June. In fact, even the timing relative to the days of the month is similar.
The previous rally started right before the middle of May, while the current upswing began just before the middle of July. The previous one consisted of two smaller rallies, which I marked with blue dashed lines and copied to the current situation. The first part of the move that we saw in July was not as big as in May, but the timing of the reversals was almost identical.
The second small rally is also aligned – at least so far. If this self-similar pattern is to continue, junior mining stocks are likely to top any day now, and the same goes for other mining stocks, silver, and gold. In fact, perhaps they have just topped.
Please note that juniors paused at their declining support line, and this support could trigger a small upswing, but it’s likely to be too small to justify any changes in trading positions. In fact, a pause after the initial part of the decline is normal in the case of junior miners (just like it is for gold). I marked the previous similar cases with blue ellipses. We saw something similar (with RSI at similar levels) in mid-April and in early June. The declines resumed after a quick pause, and I expect something similar to happen again this time.
Please note how silver verified its breakdown below the $20 level and the May bottom.
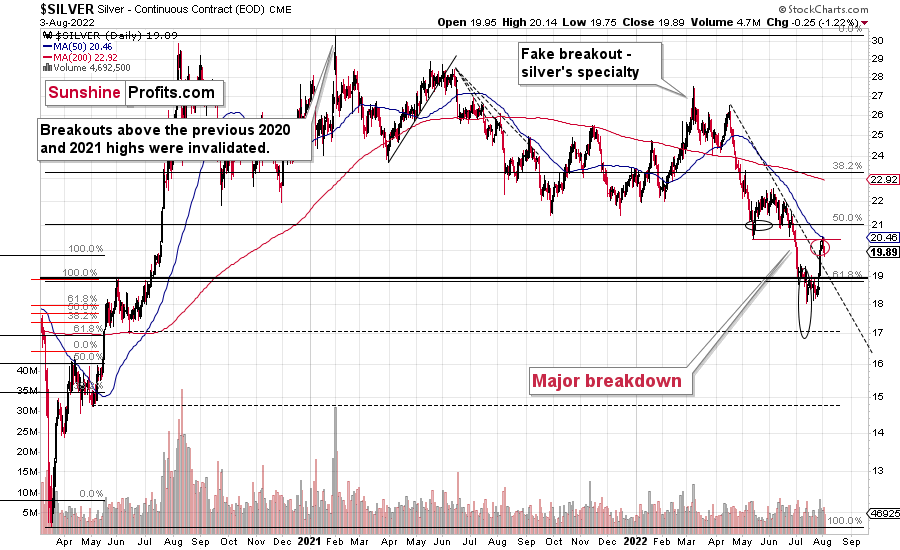
This is a textbook example of what breakdown verification should look like.
Also, as you may recall, silver and mining stocks (in particular, junior mining stocks) tend to be influenced by the performance of the general stock market.
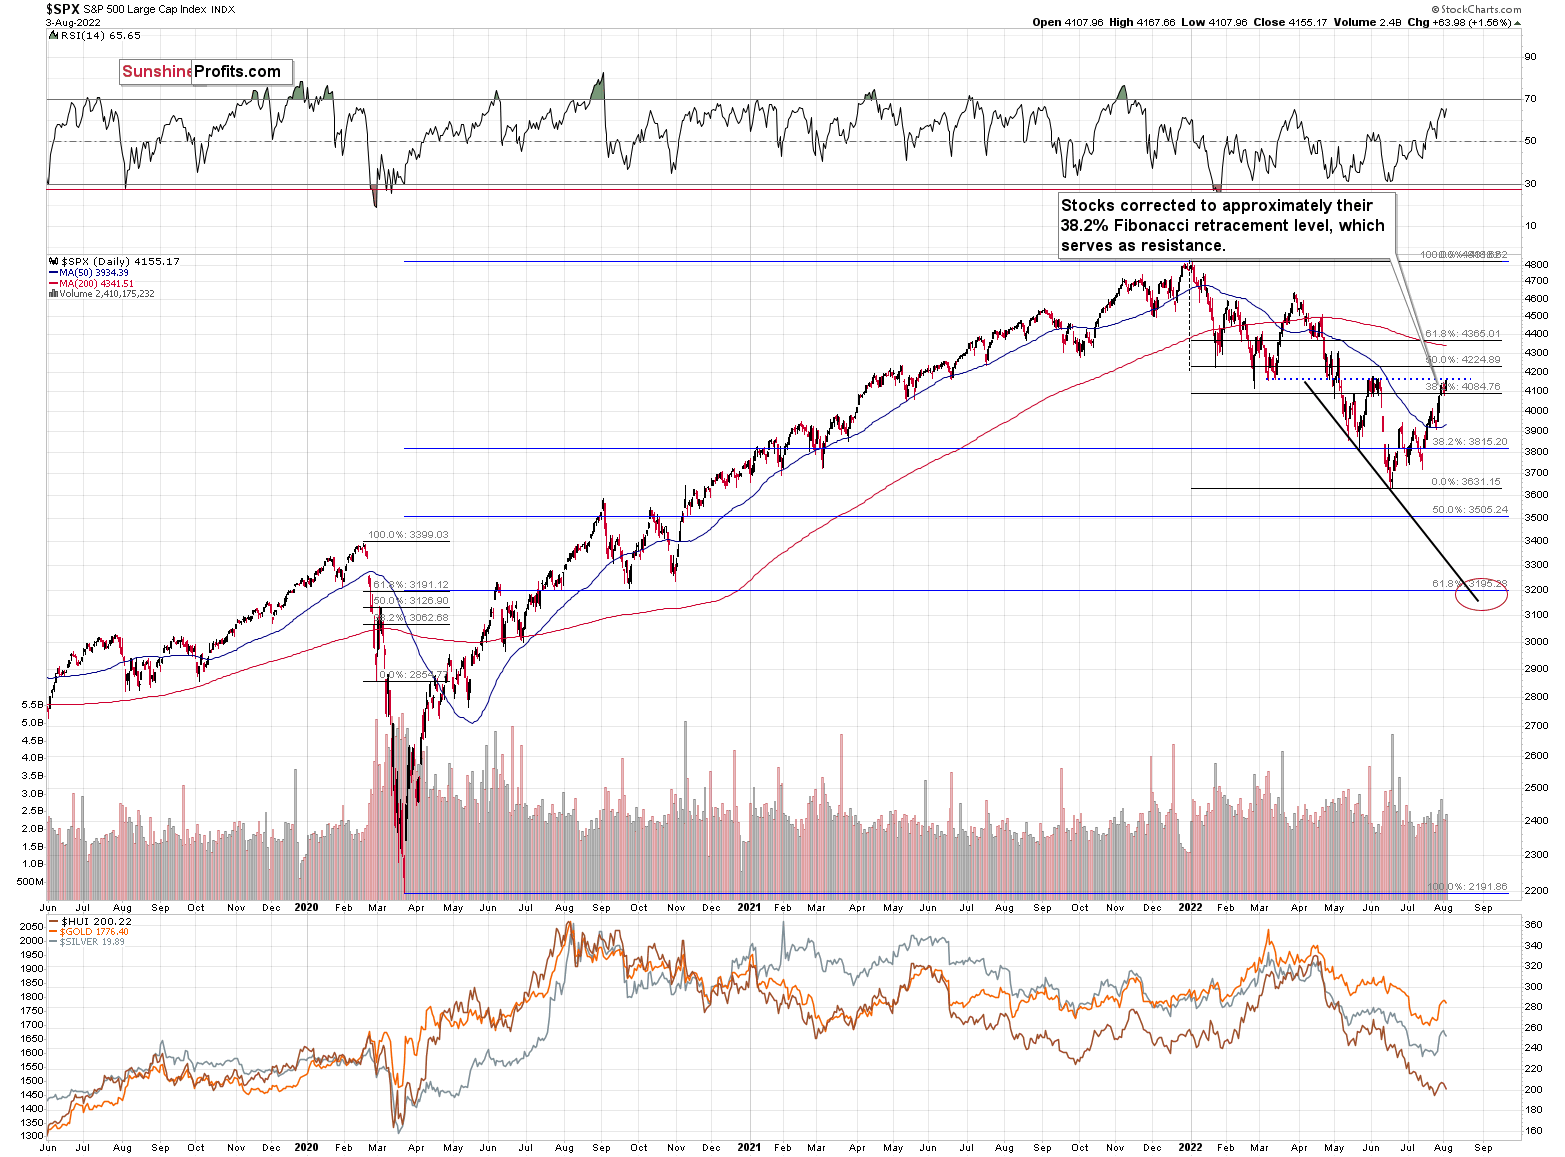
Interestingly, the S&P 500 index has just moved to its previous highs and March lows. This resistance might cause this rally to end. Consequently, silver and miners might get another bearish push soon (not necessarily immediately, though).
Having said that, let’s take a look at the market from a more fundamental point of view.
The Hawks Can Fly
With the GDXJ ETF underperforming the S&P 500 again on Aug. 3, the equities' uprising didn't help the junior miners. Moreover, with gold and silver also suffering mightily, the PMs confront a treacherous medium-term backdrop.
To that point, Fed officials were at it again on Aug. 3, as they attempted to reverse some of the damage caused by Chairman Jerome Powell on Jul. 27. Furthermore, while the general stock market ignored the hawkish warnings, the PMs' price action was more reflective of the fundamental reality.
For example, Minneapolis Fed President Neel Kashkari (a reformed dove) said on Aug. 3:
"Some financial markets are indicating they expect us to cut interest rates next year. I don't want to say it's impossible, but it seems like that's a very unlikely scenario right now given what I know about the underlying inflation dynamics. The more likely scenario is we would continue raising [interest rates] and then we would sit there until we have a lot of confidence that inflation is well on its way back down to 2%."
Likewise, Richmond Fed President Thomas Barkin said on Aug. 3:
"We are committed to returning inflation to our 2% target and have made clear we will do what it takes."
Piling on, San Francisco Fed President Mary Daly said on Aug. 3: "in my judgment, we’re not even up to neutral right now." As a result:
"If we just see inflation roaring ahead undauntedly, the labor market showing no signs of slowing, then we'll be in a different position where a 75 basis-point increase might be more appropriate. But I go in with the 50 in mind [for September] as I look at the data coming in."
In addition, St. Louis Fed President James Bullard said on Aug. 3:
"I think we’ll probably have to be higher for longer in order to get the evidence that we need to see that inflation is actually turning around (…). We still have some ways to go here to get to restrictive monetary policy.”
"I’ve argued now with the hotter inflation numbers in the spring, we should get to 3.75% to 4% this year. Exactly whether you want to do that at a particular meeting or some other meeting is a great question. I’ve liked front-loading. I think it enhances our inflation-fighting credentials."
Thus, while Fed officials’ hawkish calls went unanswered by the general stock market, the USD Index and the futures market understood the ramifications.
Please see below:
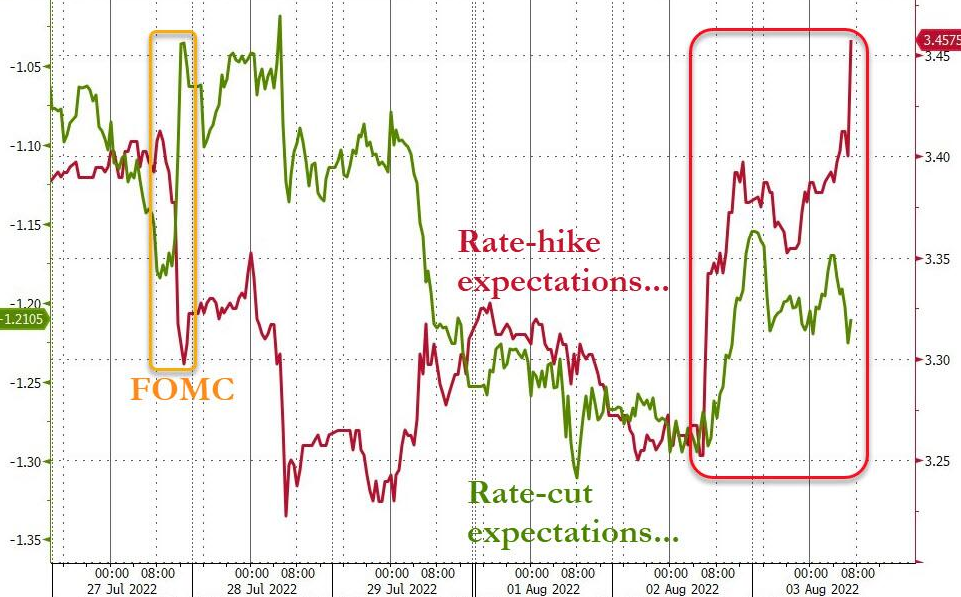 Source: Bloomberg/Zero Hedge
To explain, the red line above tracks investors' rate hike expectations, while the green line above tracks investors' rate cut expectations. If you analyze the right side of the chart, you can see that the red line soared on Aug. 3, while the green line retreated. As a result, the re-pricing is bullish for the USD Index and bearish for gold, silver, and mining stocks.
Furthermore, notice the opposite divergence on the left side of the chart. You can see that Powell's dovish press conference on Jul. 27 (labeled "FOMC") increased rate cut expectations and reduced rate hike expectations. Therefore, while we were long the GDXJ ETF at the time, I warned on Jul. 28 that Powell made a material mistake. I wrote:
While Powell’s monetary missteps have been on display for 24+ months, he continues to repeat the same blunders. However, with the old Wall Street adage of ‘take what the market gives you’ proving prescient on Jul. 27, we don’t mind being long the GDXJ ETF and profiting from the short-term sugar high. Therefore, we expect the junior miners’ uprising to continue in the days ahead.
In contrast, with Powell’s preference for patience poised to prove extremely costly over the medium term, we’ll be careful not to overstay our welcome.
As such, while we’ve switched back to the short side and rate hike expectations have somewhat normalized, gold, silver, and mining stocks’ medium-term fundamental outlooks are profoundly bearish. Thus, more downside should confront the trio in the months ahead.
The Elephant in the Room
While the futures market now expects a ~3.5% U.S. federal funds rate (FFR), the consensus still materially underestimates the stickiness of inflation. For example, the Institute for Supply Management's (ISM) price indexes declined sharply in both their manufacturing and services PMIs.
However, the results coincided with a month where commodity prices fell hard and fears of a recession gripped Wall Street. Therefore, with these developments reversing recently, and Powell's rhetoric loosening financial conditions, the forward-looking backdrop isn't so optimistic.
Furthermore, I've noted how corporate earnings calls provide important clues about the inflation dynamics confronting some of the largest companies in the U.S. Moreover, with most 'macro' analysts ignoring the realities on the ground, they miss the critical details of why inflation remains so problematic.
To that point, 3M released its second-quarter earnings on Jul. 26. For context, the conglomerate has operations in several industries and has a more than $80 billion market cap. CFO Monish Patolawala said during the Q2 earnings call:
“Halfway through 2022, we have experienced approximately $480 million of raw materials and logistics headwinds (…). As I mentioned in my prepared remarks, we are managing inflation through pricing actions. And in the second half, we continue to see broad-based inflation.”
As a result, while the Fed has hiked interest rates nine times (25 basis point increments) in 2022, 3M has seen the inflation backdrop worsen since January.
Please see below:
 Source: 3M/The Motley Fool
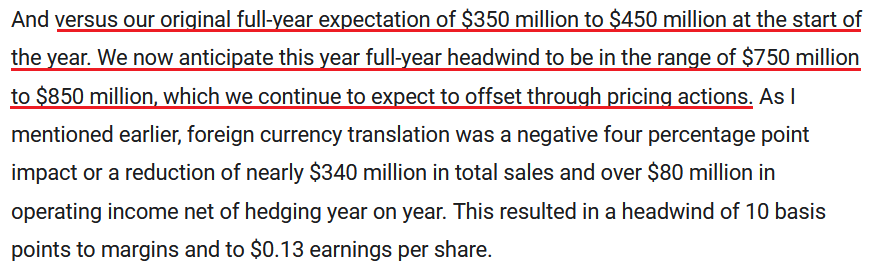
Likewise, Kimberly-Clark – a manufacturer of personal care products with a more than $40 billion market cap – released its second-quarter earnings on Jul. 26. CEO Mike Hsu said during the Q2 earnings call:
“For the year, we're now anticipating $300 million of additional input cost inflation. We remain committed to recovering and eventually expanding our margins, and thus we've taken further action to realize additional pricing and cost savings to mitigate these headwinds. We continue to expect pricing cost savings to fully offset the effects of inflation over time.”
As such, Kimberly-Clark raised its prices by 9% in Q2 (the red box), which is higher than the 7% (the blue box) realized over the last six months. In a nutshell: it means that price increases were higher in Q2 than in Q1.
Please see below:
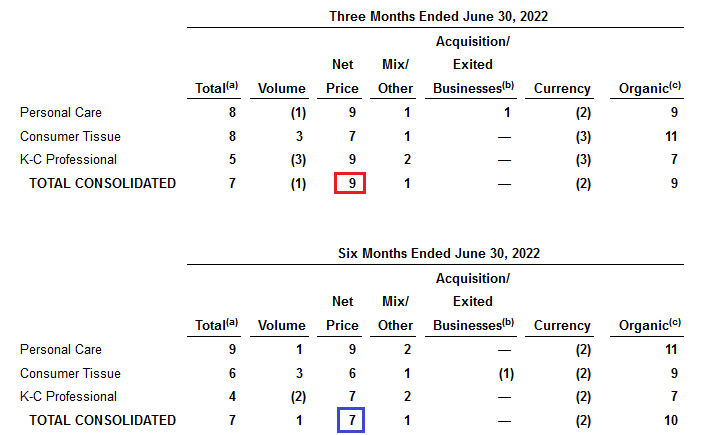 Source: Kimberly-Clark
Furthermore, CFO Nelson Urdaneta said:
“As a reminder, we will continue to realize pricing and based on what we've got today and what we saw in Q2 that will play out in the second half.” Thus, management expects even higher prices in Q3.
Please see below:
 Source: Kimberly-Clark/The Motley Fool
Finally, Marriott International – the largest hotel company in the U.S. – released its second-quarter earnings on Aug. 2. CEO Tony Capuano said during the Q2 earnings call:
“Our sales team remains focused on driving group average [daily] rate, which has been steadily rising for new bookings. At our hotels in the U.S. and Canada, ADR for group bookings made in January, was just above 2019 levels. But by June, the rate had risen to up 16% (...).”
“While we are closely monitoring consumer and macroeconomic trends, we have yet to see signs of a slowdown in global lodging demand. On the contrary, the pent-up demand for all types of travel, the shift of spending towards experiences versus goods, sustained high levels of employment and the lifting of travel restrictions and opening borders in most markets around the world are fueling travel.”
For context, ADR measures the average daily rate hoteliers charge for a room during a specific period. Moreover, with Marriott International’s consolidated U.S. and Canada ADR up by 30.1% (the red box) in Q2, that’s an awful lot of price increases.
Please see below:
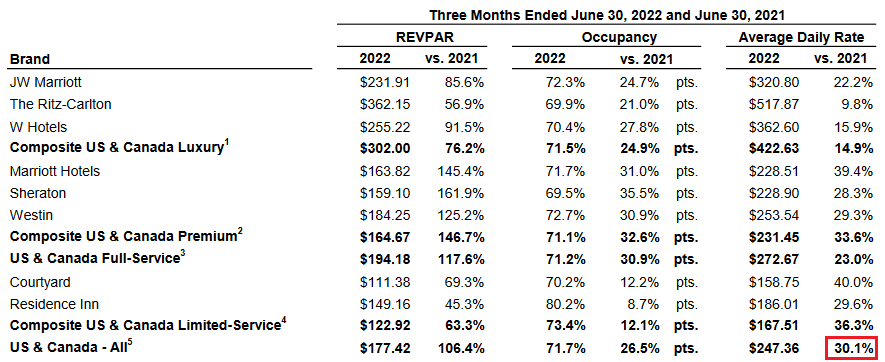 Source: Marriott International
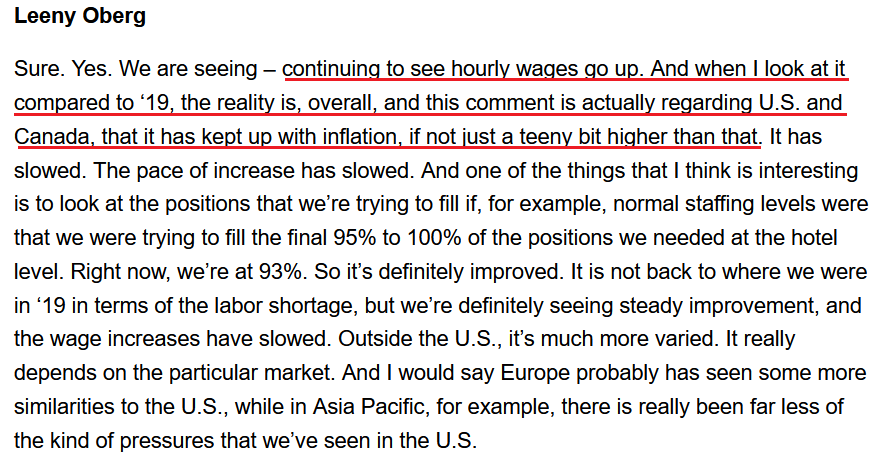
In addition, CFO Leeny Oberg said that “profit margins at our U.S. managed hotels were three percentage points higher than 2019 levels in the second quarter despite meaningful wage and benefit inflation.”
As a result, while the Atlanta Fed’s Wage Growth Tracker hit an all-time high in June and Oberg noted that the “pace of increase has slowed,” hourly wages are still rising.
Please see below:
 Source: Marriott International/The Motley Fool
Thus, while the consensus assumes that a 3% to 3.5% FFR will be enough to cure inflation, the reality is that major corporations are still increasing their prices. Moreover, how can we get back to 2% when U.S. market leaders are pricing above 9%? As such, gold, silver, and mining stocks should suffer material drawdowns when investors realize the current liquidity drain is not nearly hawkish enough.
The Bottom Line
While the S&P 500 showed relative strength on Aug. 3, bulls still underestimate the amount of tightening necessary to curb inflation. Moreover, with the U.S. 10-Year real yield declining on Aug. 3, financial conditions are way too loose to alleviate the pricing pressures. Therefore, several asset classes should experience material re-pricings in the months ahead.
In conclusion, the PMs declined on Aug. 3, and the GDXJ ETF was a noticeable underperformer. Moreover, with the relationship likely to persist over the medium term, shorting the junior miners offers the best risk-reward proposition.
Overview of the Upcoming Part of the Decline
- It seems to me that the corrective upswing is either over or about to be over, and that the next big move lower is about to start.
- If we see a situation where miners slide in a meaningful and volatile way while silver doesn’t (it just declines moderately), I plan to – once again – switch from short positions in miners to short positions in silver. At this time, it’s too early to say at what price levels this could take place and if we get this kind of opportunity at all – perhaps with gold prices close to $1,600.
- I plan to exit all remaining short positions once gold shows substantial strength relative to the USD Index while the latter is still rallying. This may be the case with gold prices close to $1,400. I expect silver to fall the hardest in the final part of the move. This moment (when gold performs very strongly against the rallying USD and miners are strong relative to gold after its substantial decline) is likely to be the best entry point for long-term investments, in my view. This can also happen with gold close to $1,400, but at the moment it’s too early to say with certainty.
- The above is based on the information available today, and it might change in the following days/weeks.
You will find my general overview of the outlook for gold on the chart below:
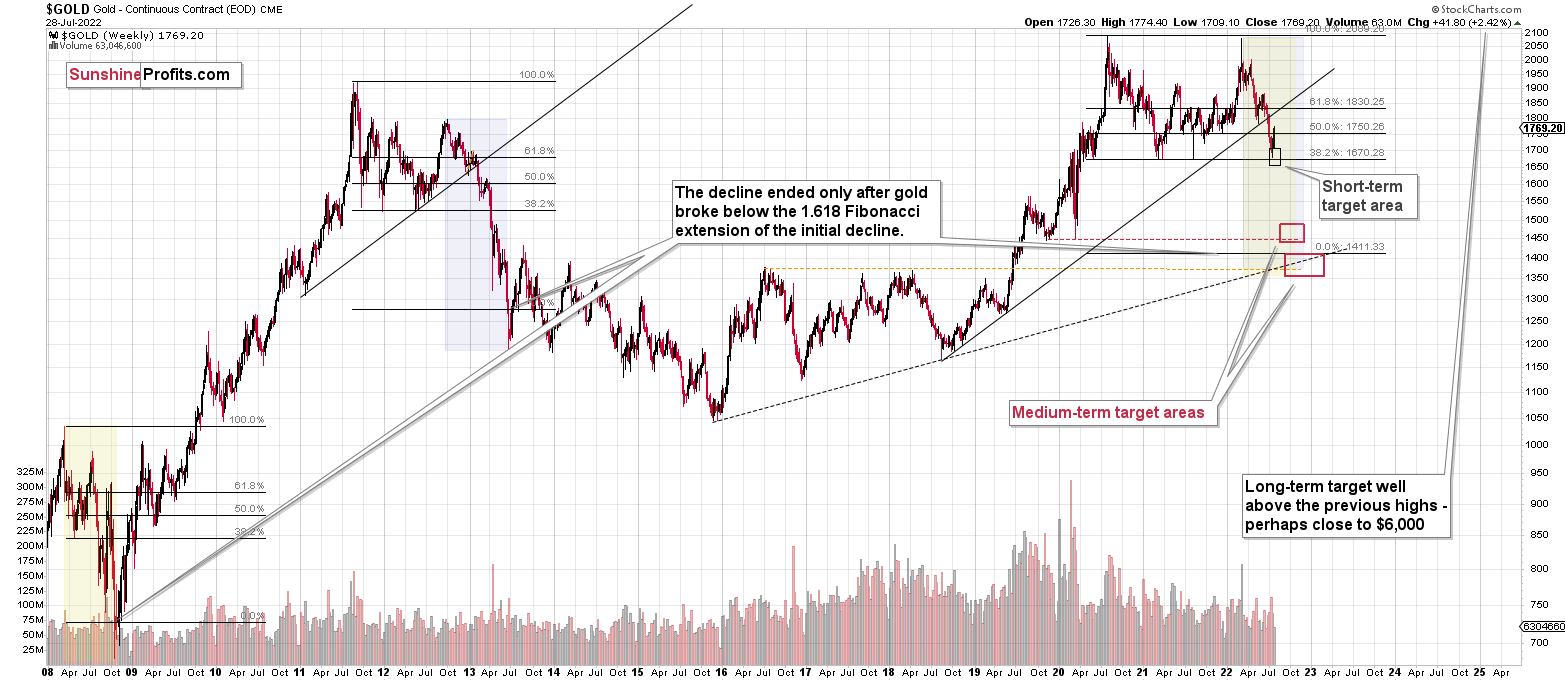
Please note that the above timing details are relatively broad and “for general overview only” – so that you know more or less what I think and how volatile I think the moves are likely to be – on an approximate basis. These time targets are not binding nor clear enough for me to think that they should be used for purchasing options, warrants, or similar instruments.
Letters to the Editor
Q: Thank you for your analyses. They are really helpful and reliable. I buy gold for the purpose of saving value and long-term investment. How many years do you expect gold will take to reach prices of $3000 and $6000? Thanks in advance and have a nice day.
A: In my opinion, it could take between 2 and 7 years. Probably (of course, no guarantees) 2-3 years for $3,000 and 3-7 years for $6,000. I know it’s a broad range, but there are too many unknowns that would impact it.
Q: I've been looking at the 3 to 5-year history of JNUG and NUGT. JNUG had a high of $42,510 5 years ago and NUGT had a high of $86,045 5 years ago. Am I reading these charts correctly, and if so, can you tell me what was going on in the market at the time of these astronomical highs? I’m very curious. Thank you in advance for your thoughts.
A: At that time, the prices were not that high, even though the data says so. The point is that the value of both leveraged ETFs declined significantly over time, and as that happened, their values would have to move below $1, which would cause them to be out of reach of many institutional investors (they have limits on investing in penny stocks). Consequently, reverse splits were orchestrated – e.g., in the case of a 25 for 1 reverse split, the owner of 25 old shares gets 1 new share that’s 25 times as expensive.
The data providers have to somehow adjust for the above. After all, no value was really created – it’s just a technical-administrative thing – so the prices shouldn’t be rallying on the chart. This would make their analysis impossible.
In order to make the prices comparable, the older (pre-split) prices were adjusted. That’s what you see on the long-term JDST and NUGT charts.
Why would JDST and NUGT prices decline so much over time? Mostly because of their inherent mechanics. They provide daily leverage, nothing more, nothing less (okay, there are some fees too). Sometimes this works to one’s advantage, but it usually doesn’t. The reason is that when something declines by a certain percentage, you have to get more than an equivalent (nominally) gain to get even.
For example, if something declines by 30%, then if it rallies by 30%, you only get 0.7 x 1.3 = 0.91 of the original value. This effect is stronger in the case of bigger moves. E.g., 0.99 x 1.01 = 0.9999, which it’s very close to 1. However, 0.2 x 1.8 = 0.36 (only a bit more than one third of the original value).
Since the leveraged ETFs multiply the daily moves, over time, the above effect slowly adds up. The more broad price swings we see in both directions, the more of the value it “eats”.
That’s why these leveraged ETFs are not a good store of value in the long run, but might be useful tools for short- and medium-term trades for more advanced traders.
Summary
Summing up, it seems that the corrective upswing is over (or close to being over), which means that the powerful medium-term downtrend can now resume.
Last week, we closed yet another profitable trade in a row. This year’s profits are already enormous, but it seems likely to me that they will grow even more in the following weeks and months. Making money on corrections during powerful trends is a difficult feat, but you managed to do just that – congratulations!
Moreover, please note that it’s not only the profits on the long positions that are so great about this success – it’s also the ability to get back on the short side of the market at more favorable (higher) prices, thus increasing the likely profits from the current trade. Congratulations, once again!
Also, please note that I will be updating the targets for the leveraged ETFs as we move closer to them, as their prices will depend on the path prices take to reach their targets.
After the final sell-off (that takes gold to about $1,350-$1,500), I expect the precious metals to rally significantly. The final part of the decline might take as little as 1-5 weeks, so it's important to stay alert to any changes.
As always, we'll keep you – our subscribers – informed.
To summarize:
Trading capital (supplementary part of the portfolio; our opinion): Full speculative short positions (300% of the full position) in junior mining stocks are justified from the risk to reward point of view with the following binding exit profit-take price levels:
Mining stocks (price levels for the GDXJ ETF): binding profit-take exit price: $20.32; stop-loss: none (the volatility is too big to justify a stop-loss order in case of this particular trade)
Alternatively, if one seeks leverage, we’re providing the binding profit-take levels for the JDST (2x leveraged). The binding profit-take level for the JDST: $29.87; stop-loss for the JDST: none (the volatility is too big to justify a SL order in case of this particular trade).
For-your-information targets (our opinion; we continue to think that mining stocks are the preferred way of taking advantage of the upcoming price move, but if for whatever reason one wants / has to use silver or gold for this trade, we are providing the details anyway.):
Silver futures downside profit-take exit price: $12.32
SLV profit-take exit price: $11.32
ZSL profit-take exit price: $79.87
Gold futures downside profit-take exit price: $1,504
HGD.TO – alternative (Canadian) 2x inverse leveraged gold stocks ETF – the upside profit-take exit price: $19.87
HZD.TO – alternative (Canadian) 2x inverse leveraged silver ETF – the upside profit-take exit price: $49.87
Long-term capital (core part of the portfolio; our opinion): No positions (in other words: cash)
Insurance capital (core part of the portfolio; our opinion): Full position
Whether you’ve already subscribed or not, we encourage you to find out how to make the most of our alerts and read our replies to the most common alert-and-gold-trading-related-questions.
Please note that we describe the situation for the day that the alert is posted in the trading section. In other words, if we are writing about a speculative position, it means that it is up-to-date on the day it was posted. We are also featuring the initial target prices to decide whether keeping a position on a given day is in tune with your approach (some moves are too small for medium-term traders, and some might appear too big for day-traders).
Additionally, you might want to read why our stop-loss orders are usually relatively far from the current price.
Please note that a full position doesn't mean using all of the capital for a given trade. You will find details on our thoughts on gold portfolio structuring in the Key Insights section on our website.
As a reminder - "initial target price" means exactly that - an "initial" one. It's not a price level at which we suggest closing positions. If this becomes the case (as it did in the previous trade), we will refer to these levels as levels of exit orders (exactly as we've done previously). Stop-loss levels, however, are naturally not "initial", but something that, in our opinion, might be entered as an order.
Since it is impossible to synchronize target prices and stop-loss levels for all the ETFs and ETNs with the main markets that we provide these levels for (gold, silver and mining stocks - the GDX ETF), the stop-loss levels and target prices for other ETNs and ETF (among other: UGL, GLL, AGQ, ZSL, NUGT, DUST, JNUG, JDST) are provided as supplementary, and not as "final". This means that if a stop-loss or a target level is reached for any of the "additional instruments" (GLL for instance), but not for the "main instrument" (gold in this case), we will view positions in both gold and GLL as still open and the stop-loss for GLL would have to be moved lower. On the other hand, if gold moves to a stop-loss level but GLL doesn't, then we will view both positions (in gold and GLL) as closed. In other words, since it's not possible to be 100% certain that each related instrument moves to a given level when the underlying instrument does, we can't provide levels that would be binding. The levels that we do provide are our best estimate of the levels that will correspond to the levels in the underlying assets, but it will be the underlying assets that one will need to focus on regarding the signs pointing to closing a given position or keeping it open. We might adjust the levels in the "additional instruments" without adjusting the levels in the "main instruments", which will simply mean that we have improved our estimation of these levels, not that we changed our outlook on the markets. We are already working on a tool that would update these levels daily for the most popular ETFs, ETNs and individual mining stocks.
Our preferred ways to invest in and to trade gold along with the reasoning can be found in the how to buy gold section. Furthermore, our preferred ETFs and ETNs can be found in our Gold & Silver ETF Ranking.
As a reminder, Gold & Silver Trading Alerts are posted before or on each trading day (we usually post them before the opening bell, but we don't promise doing that each day). If there's anything urgent, we will send you an additional small alert before posting the main one.
Thank you.
Przemyslaw Radomski, CFA
Founder, Editor-in-chief

