

Briefly: in our opinion, full (300% of the regular position size) speculative short positions in junior mining stocks are justified from the risk/reward point of view at the moment of publishing this Alert.
In my Friday’s analysis, I wrote about the very bearish medium-term trend the precious metals sector is currently in, and in today’s issue, I’ll supplement it with the timeliest details that relate directly to the specific factors that we have right now. These are:
- We’re right after U.S. Labor Day, and the gold price behaves very specifically at this time of the year.
- It’s the September before the U.S. mid-term elections, and there’s also a very specific tendency present in the S&P 500 that’s related to this time.
Let’s start with the first point.
Actually, I already wrote about gold’s behavior after U.S. Labor Day last year, and what happened next confirmed this tendency even more. Quoting my Sep. 1, 2021 analysis:
The U.S. Labor Day is almost here, and thus the time for gold’s rally is running out. Tick-tock, tick-tock… and then the party stops.
Chart analysis is a very interesting activity. You need to keep your mind open, your cognitive and emotional biases at bay, and you have to stay humble, as you always have something new to discover and you might need to change your mind in a flash. Moreover, the indications can arrive from all over the place. You can expect that the key signal will come from this price analysis technique, or that one, or maybe based on the price link between some assets. Or it could even be the case that it will not be the price or volume that will be critical in a given situation… but time.
The cyclical nature of many areas of life is present in the markets, and it is usually the case that the seasonal factors have only a mild effect on the prices while other factors are much more important, as they are specific to a given situation. Sometimes, however, we have a recurring event that’s so precise in its implications and so accurate that its importance could dwarf other techniques.
This could be the case with gold’s post-U.S. Labor-Day performance.
A poet might say that at that time, a golden dolphin jumps joyfully into the air, shining briefly in the evening sun, preparing for a deep and dangerous dive.
A data scientist might say that 10 out of 10 efficiency with regard to short-term implications and 8 out of 10 performance with regard to medium-term implications is something that seems opposite to the efficient market theory, even in its weak form.
A trader might say: “Great! Let’s make some money on it!”
I’ll let you be the judge as to which approach is best, while I will feature my observations regarding gold’s price performance around U.S. Labor Day.
(…)
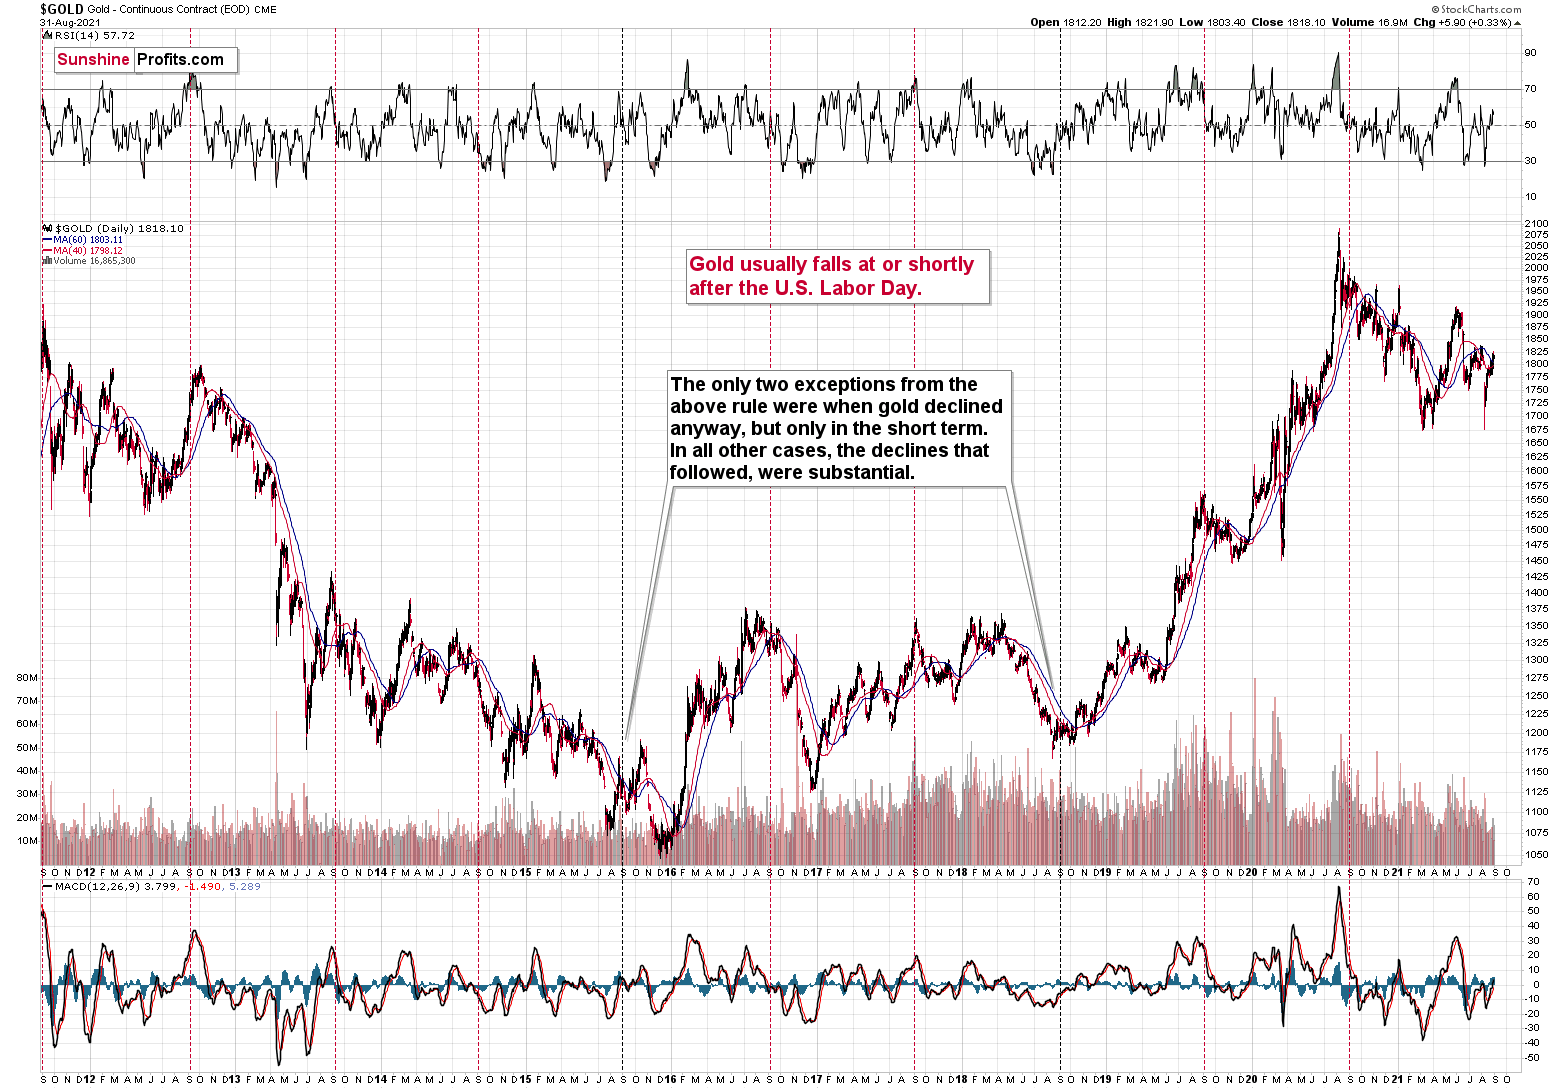
We’re now less than one week away from Labor Day in the U.S., which is particularly important for the gold price movement.
You see, in the previous 10 years, gold almost always declined profoundly right after U.S. Labor Day — I marked that on the above chart with red, dashed lines. There were only two cases (in 2015 and in 2018) when gold didn’t slide profoundly after that day, but… it was when gold declined in the short term anyway. There was simply no major downswing later.
In other words, in all 10 of the previous 10 years, gold moved lower in the short term after U.S. Labor Day. Of course, it’s debatable what one describes as the short term. In this case, I mean a period between a few days and a few weeks. Then again, if you look at the chart, it’s clear what we can expect. Please have a look at how far gold usually falls (red lines) and how far it fell during the exceptionally bullish years when it declined just in the short run.
This is very important, as it tells us that even if gold doesn’t decline this week, it will be very likely to do so based on this surprisingly accurate cyclicality.
What happened next?
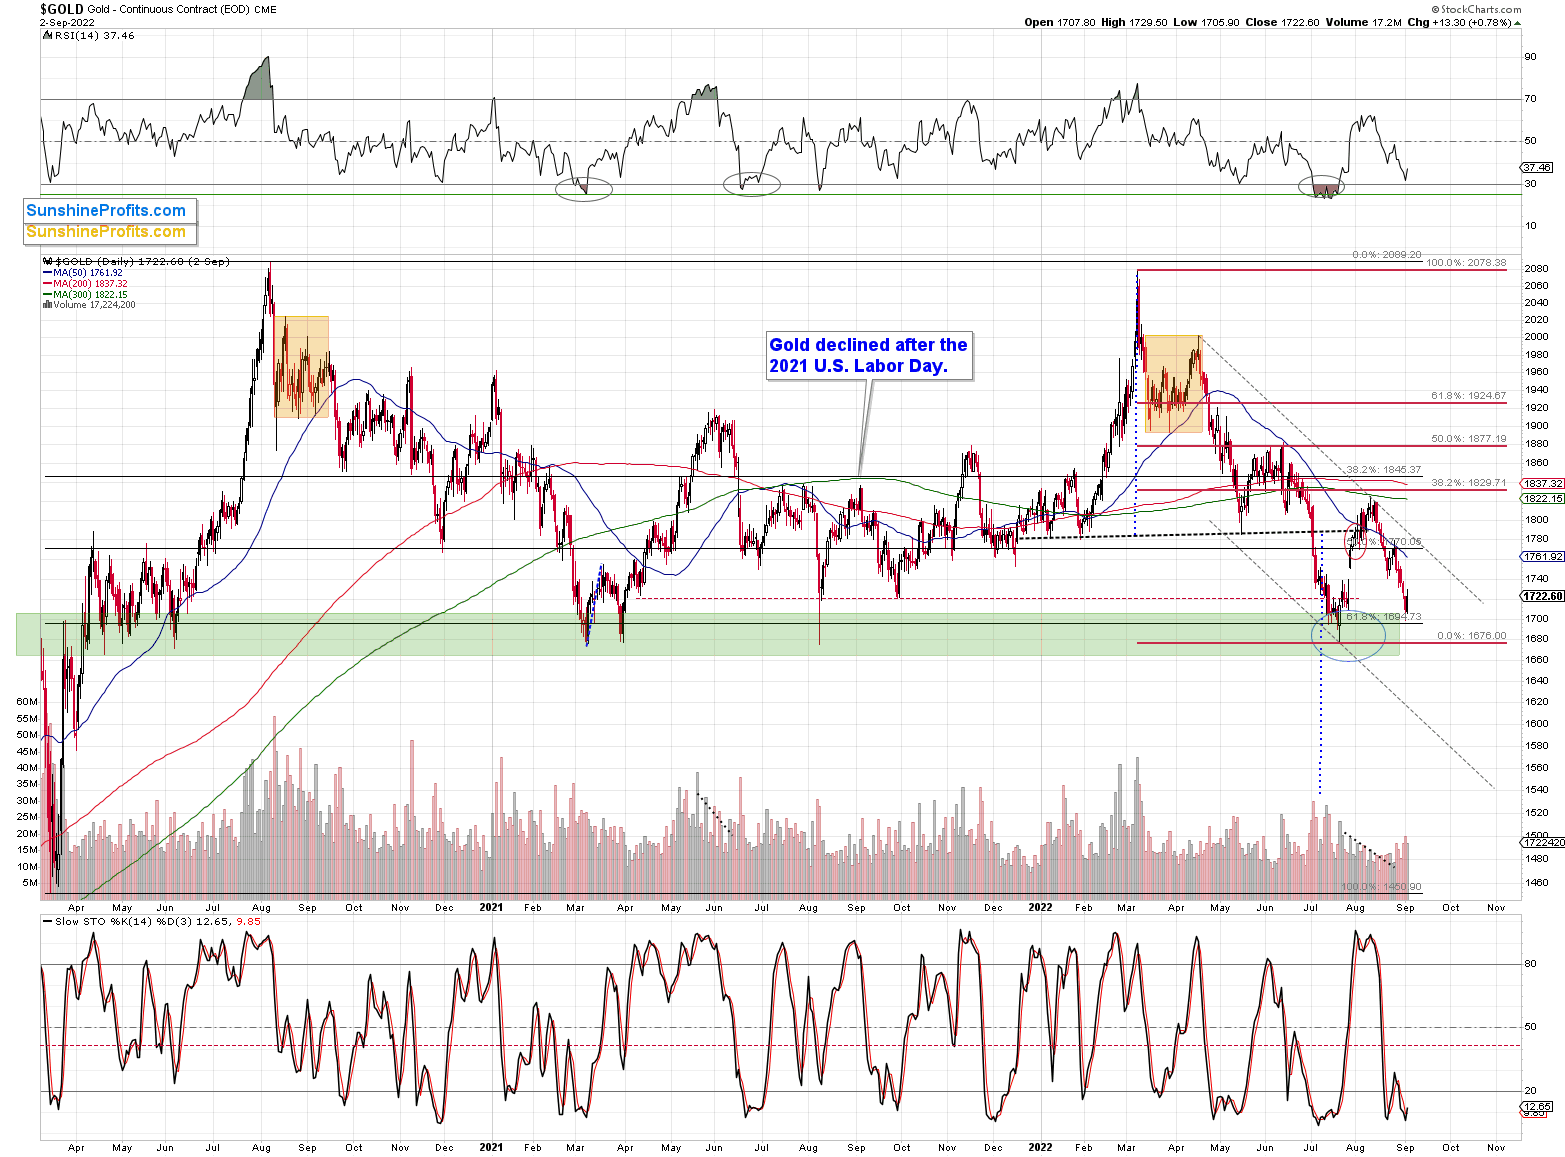
Gold declined, just as I had expected it to – no surprise here.
So, what is the gold price likely to do next based on such an effective historical tendency? That’s right, even though – of course – it’s not guaranteed, gold’s price is likely to decline.
As for the second above-mentioned point, I’ll provide you with some more context.
September Blues
Despite the S&P 500’s afternoon sell-off on Sep. 2, the PMs managed to sidestep the volatility. However, with September being a notoriously difficult month for risk assets, volatility should reign, and a realization is profoundly bearish for gold, silver, and mining stocks.
For example, data from Bank of America shows that September is the S&P 500’s worst month when leading up to mid-term elections.
Please see below:
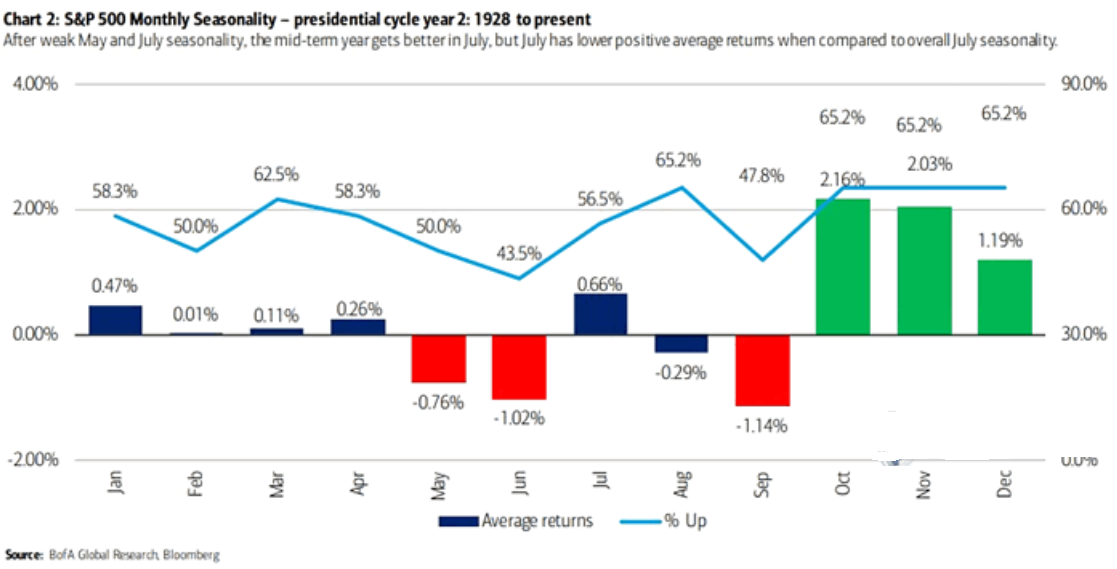
To explain, the blue, red and green bars above track the average monthly percentage gains and losses realized by the S&P 500 during mid-term election cycles. Moreover, the light blue line above tracks the percentage of months that the S&P 500 has delivered a positive return.
If you analyze the red bar under “Sep,” you can see that September is often a painful month for the bulls. Likewise, only 47.8% of September months have ended green, and only June has a worse track record. Therefore, while the GDXJ ETF rallied on Sep. 2, the trend is unlikely to continue.
As further evidence, overall seasonality also paints an ominous portrait of the back half of the month.
Please see below:
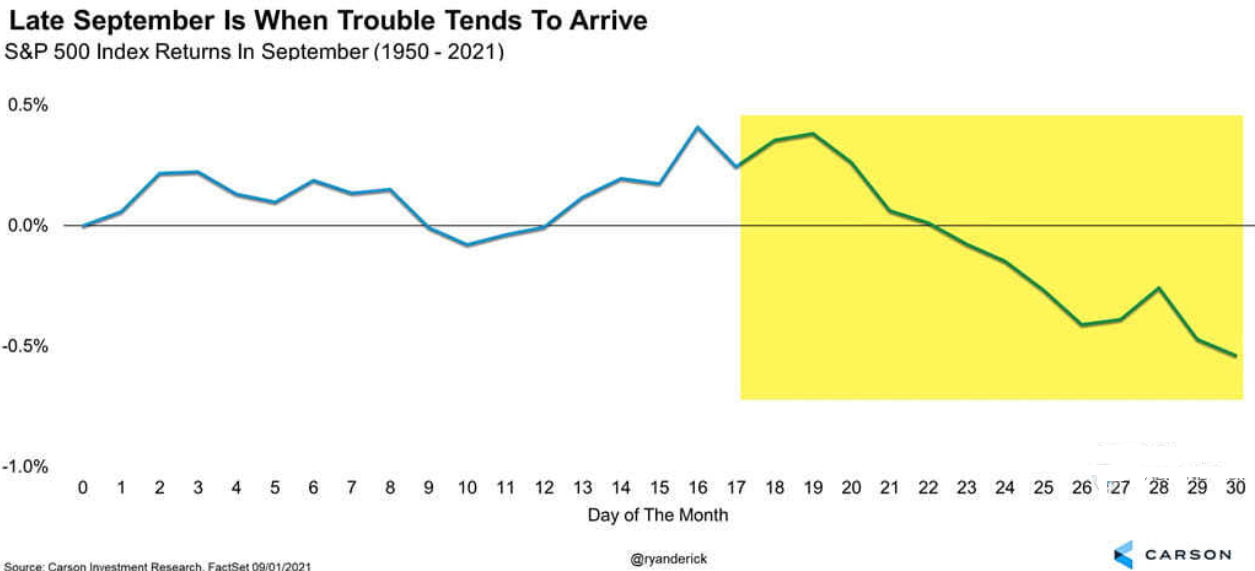
To explain, the blue line above tracks the S&P 500’s seasonality trend in September. If you analyze the left side of the chart, you can see that optimism often peaks at mid-month. Thus, while the bulls may put on brave faces over the next couple of weeks, their optimism should turn to pessimism as the month unfolds.
Furthermore, the narrative on Wall Street is that ‘everyone is bearish.’ However, actions speak louder than words, and fund flows are nowhere near levels that signal capitulation.
Please see below:
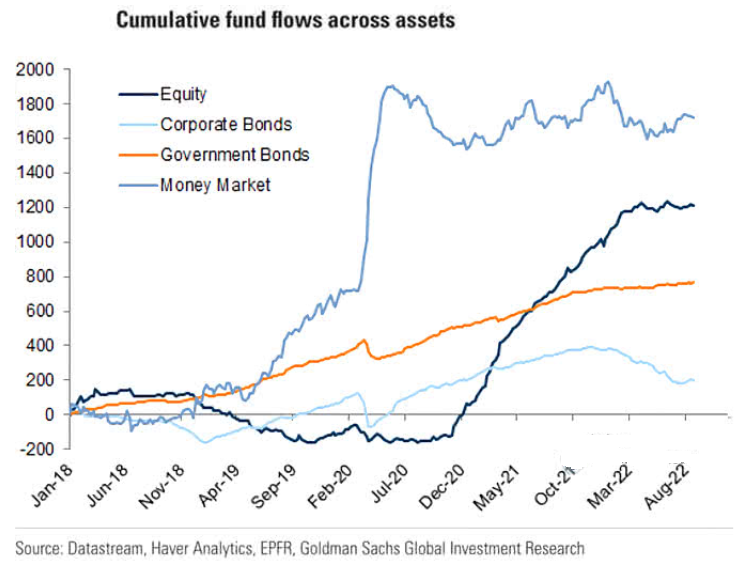
To explain, the various lines above track the cumulative flows into different financial assets. If you analyze the trajectory of the dark blue line, you can see that equity flows have barely budged despite the recent volatility. Therefore, with the passive crowd still armed with plenty of selling power, more downside should materialize when they realize the Fed can’t engineer a soft landing.
Furthermore, please note that earnings season begins next month; and with analysts’ assumptions still overly optimistic, a reversion to the mean could have drastic consequences for the S&P 500 and the PMs.
Please see below:
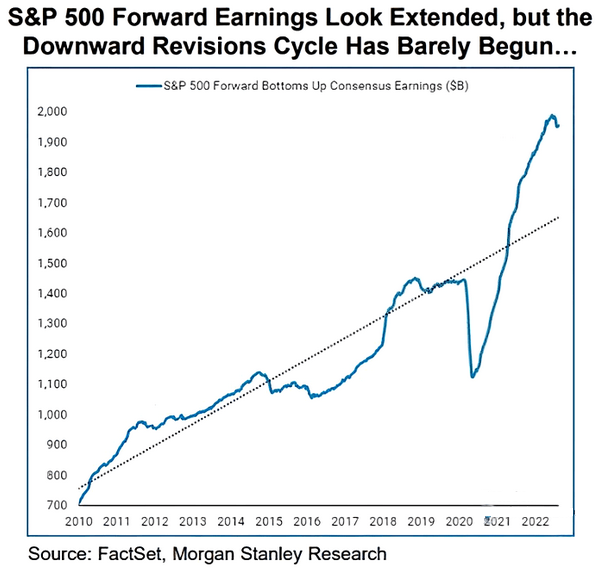
To explain, the blue line above tracks analysts’ consensus S&P 500 earnings expectations, while the black line above tracks the ~12-year trend. If you analyze the material gap on the right side of the chart, you can see that inflation, rate hikes, and European energy issues are far from priced in. Therefore, if corporate earnings reconnect with their ~12-year trend, the S&P 500 would have to decline substantially even if its current forward price-to-earnings (P/E) ratio of 16.5x holds.
However, that prospect is unlikely, given the S&P 500’s forward P/E suffered mightily during historical recessions. Thus, the ‘P’ and the ‘E’ should come under pressure in the months ahead.
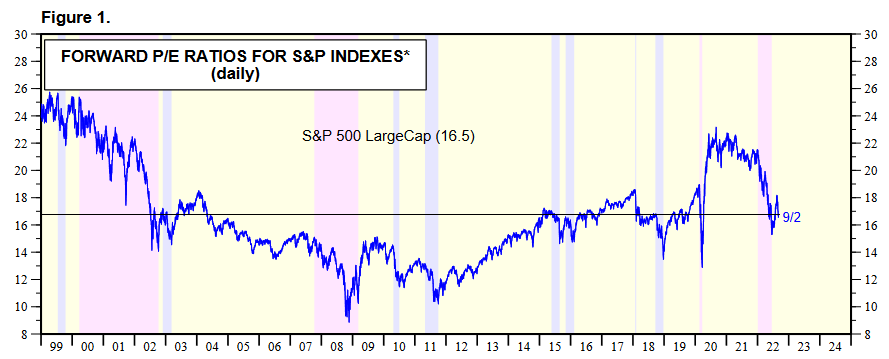 Source: Yardeni.com
Overall, the S&P 500’s short-and-medium-term outlook is profoundly bearish, and the GDXJ ETF is much more correlated to the performance of stocks. As such, the latter should realize new lows sooner rather than later. In addition, our gold seasonality chart highlights why September is often an ominous month for the yellow metal.
Please see below:
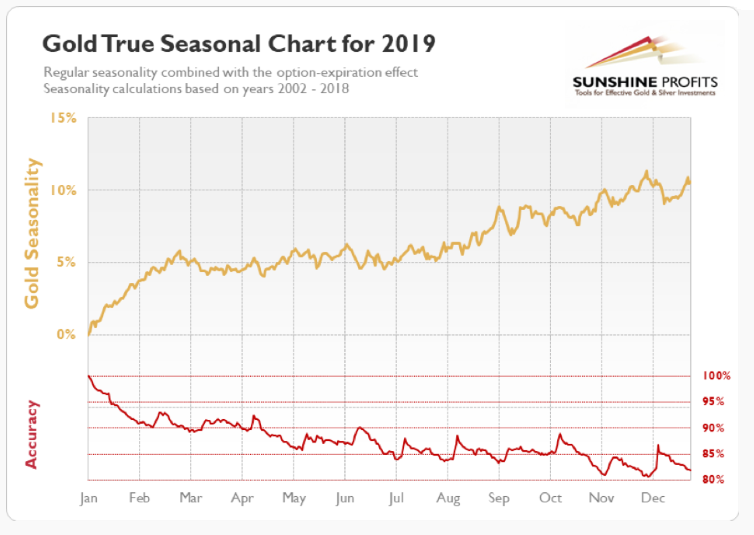
To explain, the gold line above shows how the yellow metal often declines sharply at the beginning of September and reverses those losses mid-month before declining once again. Moreover, while the timing contrasts the S&P 500, the important point is that downside is often prevalent at some point after the Labor Day holiday. As such, more bearish fireworks should erupt in the coming days and weeks.
Fueling the Fed
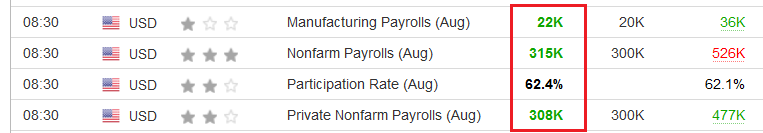
With U.S. nonfarm payrolls outperforming expectations on Sep. 2, a resilient U.S. labor market is profoundly bullish for future Fed policy.
Please see below:
 Source: Investing.com
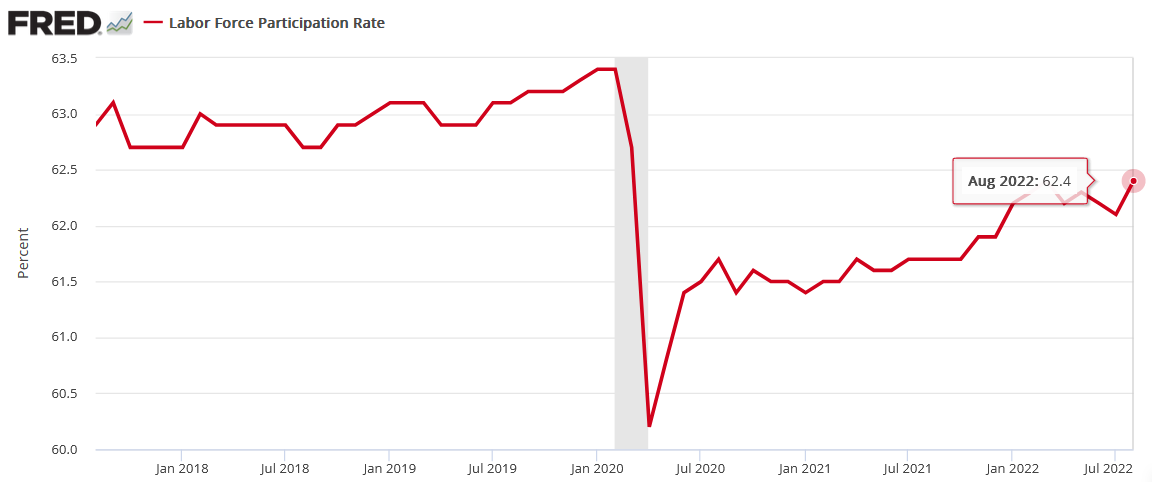
To explain, U.S. job growth outperformed across the board, and the data should embolden the Fed to continue its rate hike cycle. Moreover, while the labor force participation rate inched up in August – which is bearish for wage inflation – the metric is still below its pre-COVID-19 high. Therefore, we’re far from levels that would normalize wage inflation to 2%.
Please see below:
To that point, ADP released its private payrolls report on Sep. 1. Furthermore, while the data is often a poor predictor of U.S. nonfarm payrolls, the firm’s compensation findings are extremely relevant.
Please see below:
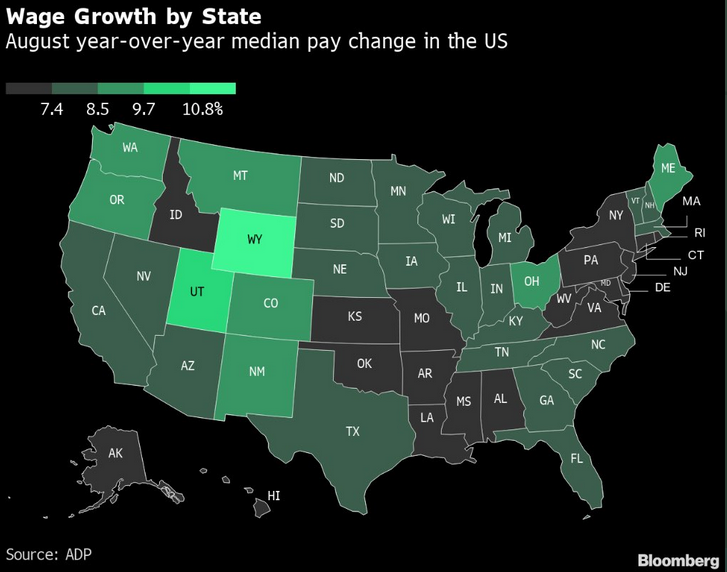
To explain, the map above marks ADP’s wage growth findings in all U.S. states. If you analyze the green flooding on the map, you can see that wage growth of 8.5% or more was present in most U.S. states. Likewise, even the states’ color-coded black shows wage inflation of 7% or more.
Thus, while the consensus assumes that the Fed will solve its inflation conundrum with a ~3.5% U.S. federal funds rate (FFR), the data suggests otherwise. With consumers’ purchasing power near, at, or exceeding the inflation rate, they still have plenty of money to spend. As a result, the FFR needs to go higher than the consensus thinks.
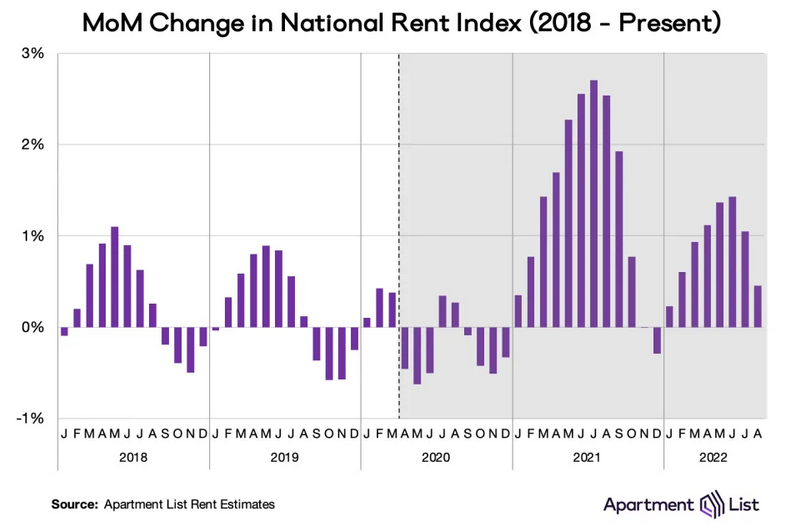
Also noteworthy, Apartment List released its National Rent Report on Aug. 31. Moreover, while rent growth has slowed in line with seasonality trends, prices are still rising month-over-month (MoM). An excerpt read:
“This year rents have risen slightly faster than they did before the pandemic, but significantly slower than they did in 2021 when rent inflation was at its peak. So far in 2022 rents are up 7.2 percent, compared to 14.8 percent at this point in 2021. Year-over-year growth has slowed to 10 percent, down from a pearl of nearly 18 percent at the beginning of the year (…).”
“Rents increased in 79 of the nation’s 100 largest cities in August. But in 68 of those 79 cities, rent growth was slower this month than last month.”
Please see below:
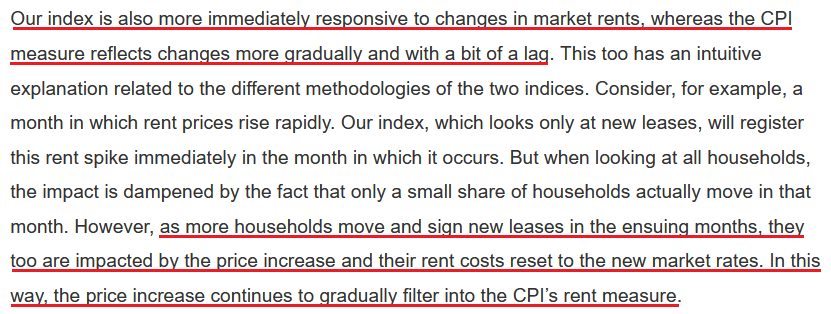
However, please note that the Shelter Consumer Price Index (CPI) includes new and renewed leases, while Apartment List’s data only includes new leases. To explain the significance, I wrote on Aug. 22:
As new leases become a greater percentage of the rent CPI, they will put upward pressure on the Shelter CPI and the headline CPI.
As evidence, Apartment List researchers explained the discrepancy. They wrote:
“New leases always see the most significant price increases (or declines) in any given market, whereas renewal leases tend to see more modest rent adjustments.”
“And more importantly, only a small fraction of households sign a new or renewal lease in any given month, while the large majority of households see no change in their housing costs. As a result, housing price changes will always appear more muted when considering all households rather than only those who signed new leases.”
Thus, while the consensus assumes that inflation will subside and the Fed can cut rates in 2023, the realities on the ground suggest otherwise.
 Source: Apartment List
Thus, with the Shelter CPI accounting for more than 30% of the headline CPI’s movement and the former lagging Apartment List’s data, prior months’ rent inflation should continue to filter into the Shelter CPI. Furthermore, with new leases still up 0.5% MoM, it contrasts the MoM declines that often materialize from August to December. As a result, the Fed is still miles away from its 2% inflation goal.
The Bottom Line
While the PMs enjoyed a daily reprieve on Sep. 2, the optimism should be short-lived. With September a notoriously bad month for risk assets and the fundamentals worsening by the day, more downside should confront gold, silver, mining stocks and the S&P 500 in the weeks ahead. Moreover, with the USD Index on the cusp of hitting 110 and the U.S. 10-Year real yield gunning for its 2022 high, the PMs' main fundamental adversaries are unlikely to let up during the Fed's inflation fight.
In conclusion, the PMs rallied on Sep. 2, as oversold conditions helped elicit a bounce. However, while their medium-term technical and fundamental outlooks are profoundly bearish, seasonality also signals more weakness ahead. As such, further declines should commence before long-term buying opportunities emerge.
Key Implication
All right, if gold is likely to decline, and stocks are likely to decline, then what is very likely to decline substantially?
Junior mining stocks.
Senior miners and silver too, but junior miners tend to magnify gold’s and stocks’ declines to the greatest extent.
But they just moved up on Friday!
Yes, they did. A rally (especially a daily one) doesn’t automatically change the outlook, though.
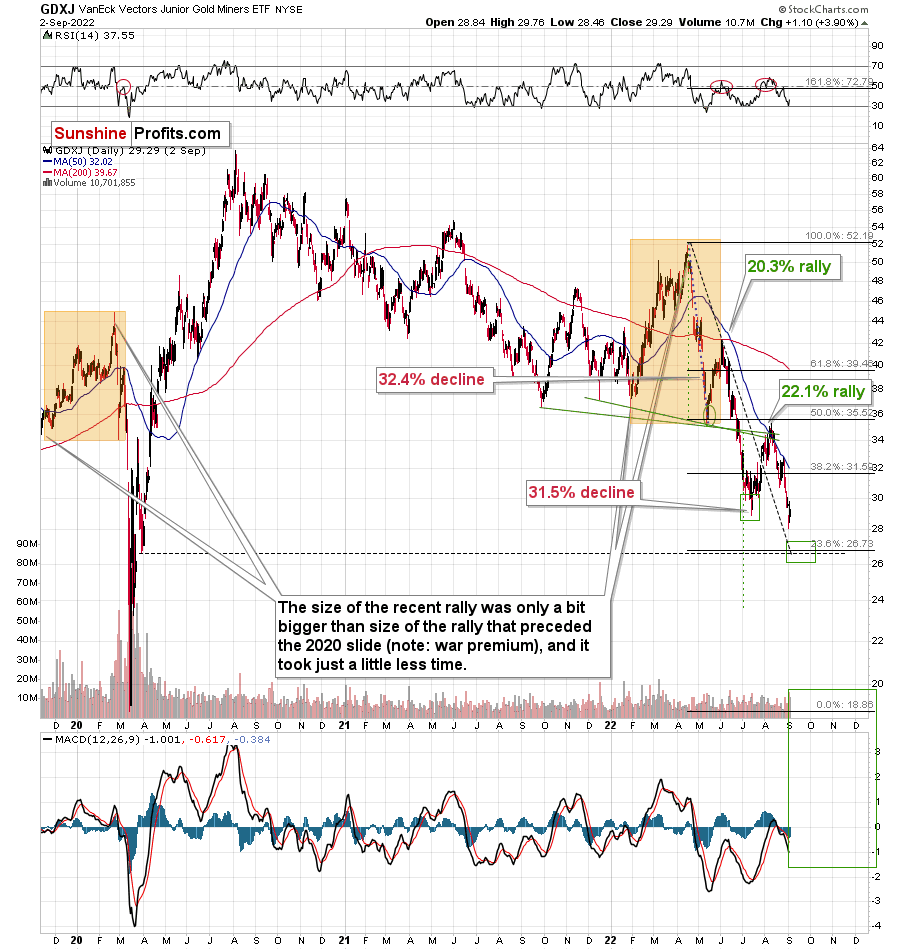
Let’s zoom in and see what else junior miners (GDXJ) did on Friday - and what they didn’t do.
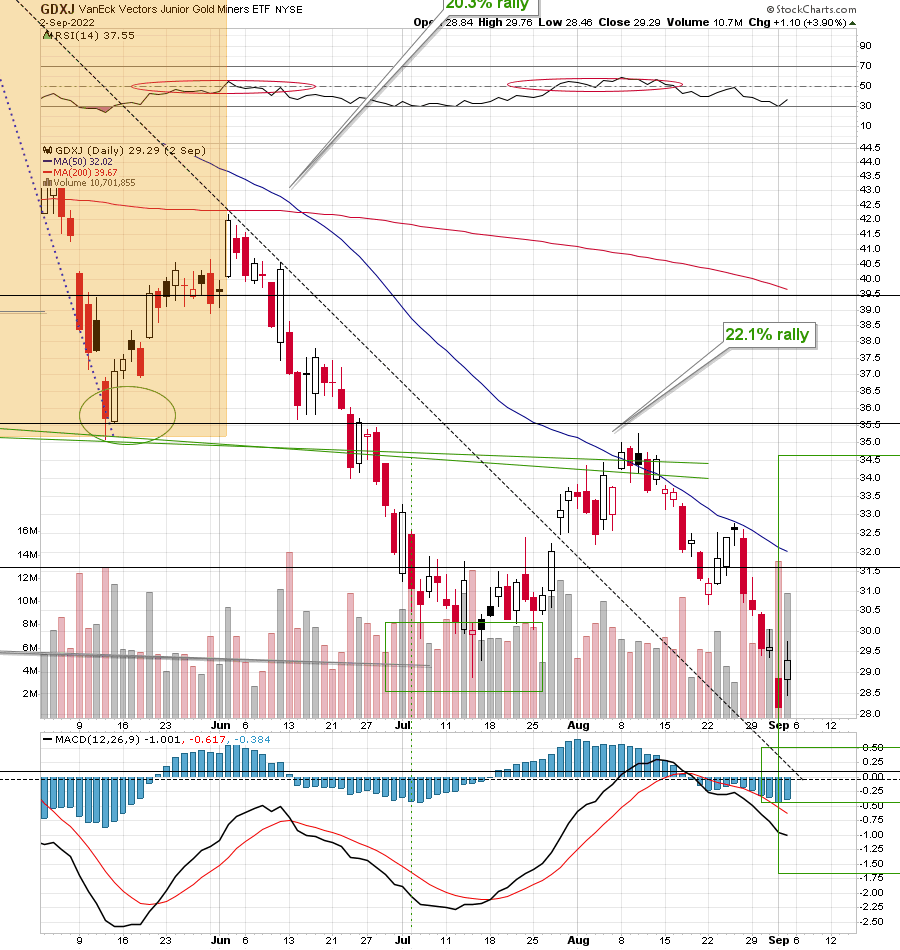
The GDXJ moved higher and briefly moved above the previous trading day’s closing price and its intraday low. Then, the GDXJ moved back down and closed below those levels.
The important extra detail here is that Thursday’s session started with a price gap. It’s important because prices tend to “want” to close the price gap before continuing with their current trend. “Closing the gap” means temporarily moving to the levels and actually trading where there was no trading before (thus, the gap). That’s exactly what we saw on Friday.
What we haven’t seen on Friday is an invalidation of the breakdown below the July lows in closing price terms. Consequently, the breakdown was not invalidated but verified.
This is not a bullish price action, but something bearish and quite normal. Consequently, the outlook remains bearish.
Overview of the Upcoming Part of the Decline
- It seems to me that the corrective upswing is over, and that the next big move lower is already underway. We might see one final small corrective upswing soon, though.
- If we see a situation where miners slide in a meaningful and volatile way while silver doesn’t (it just declines moderately), I plan to – once again – switch from short positions in miners to short positions in silver. At this time, it’s too early to say at what price levels this could take place and if we get this kind of opportunity at all – perhaps with gold prices close to $1,600.
- I plan to exit all remaining short positions once gold shows substantial strength relative to the USD Index while the latter is still rallying. This may be the case with gold prices close to $1,400. I expect silver to fall the hardest in the final part of the move. This moment (when gold performs very strongly against the rallying USD and miners are strong relative to gold after its substantial decline) is likely to be the best entry point for long-term investments, in my view. This can also happen with gold close to $1,400, but at the moment it’s too early to say with certainty.
- The above is based on the information available today, and it might change in the following days/weeks.
You will find my general overview of the outlook for gold on the chart below:
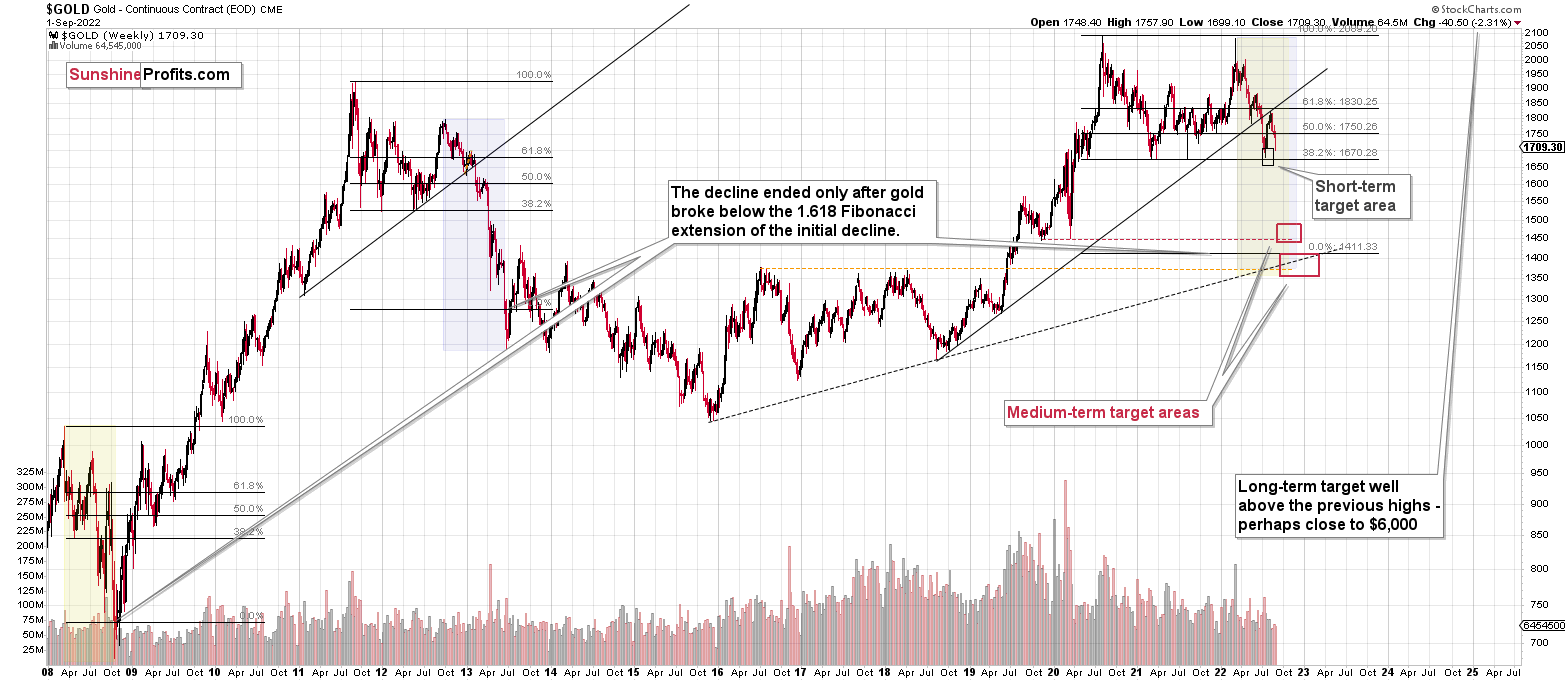
Please note that the above timing details are relatively broad and “for general overview only” – so that you know more or less what I think and how volatile I think the moves are likely to be – on an approximate basis. These time targets are not binding nor clear enough for me to think that they should be used for purchasing options, warrants, or similar instruments.
Letters to the Editor
Q: Fundamental question: what's your opinion on the central bank’s digital currency starting next year? How will these impact countries' current currency and, ultimately, the impact on gold and silver? My take on digital money is that it will cause a larger demand for gold and silver. Your thoughts?
A: This could indeed be the case, but it’s too early to tell. It seems likely, though, and it would fit the long-term bull market in the precious metals sector. I wouldn’t say that it’s necessarily going to happen next year. The gov’t cryptos could be launched in the following years, not in 2023. Either way, it’s not a factor that is likely to prevent precious metals’ and mining stocks’ declines in the coming weeks or months.
Q: This ETF seems broken or someone is controlling it.
For example, as I said the other day, it didn't go down when gold went down, but it sure goes up when gold goes up. That seems like a fraud within the ETF.
I may or may not continue with the trade if it appears the ETF is being manipulated.
But maybe I should have sold my positions yesterday, because, as I think I mentioned the other day, they always rally the markets before a holiday.
Let's see if the markets open BIG RED on Tuesday.
A: I guess you meant the GDXJ by “this ETF”. If so, then please keep in mind that it’s not a proxy for gold. It’s a proxy for junior gold mining stocks. There are other ETFs that are proxies for gold, for example GLD, UGL, DGL, and many others, but GDXJ is based on junior miners – it doesn’t hold gold directly.
Consequently, it’s not a “fraud” that the ETF doesn’t do what it was not designed to do – it’s not tracking gold by design, not by an error.
Yes, junior miners tend to move in tune with senior miners, which in turn tend to move in tune with gold. However, there’s a huge difference between “they should be in perfect alignment on each and every day” and “they go together most of the time, but not necessarily so on each and every day”.
In fact, one of the reasons why I’m using the GDXJ is that I think that junior miners have more to fall than gold. If they were tracking gold in a perfect manner, this extra downside potential would be absent. Please note that if GDXJ tracked gold more closely, it would still be well above its July lows, not below them, and the profits on the current short position wouldn’t have been as big as they are right now.
Of course, it’s your money, and you can choose to use any instrument for any trade that you want. I’m simply describing what I personally think (just my opinion) is justified from the risk to reward point of view – where I see the greatest potential.
Also, in my opinion, if the markets don’t decline today but instead move slightly higher, it most likely won’t change anything with regard to the extremely bearish outlook for the following weeks.
Q: Thank you for the excellent analysis of the miners/metals market.
I understand that rising interest rates will push metal prices lower over the next few months, but my question is about Europe. Fundamentally, with Europe's dependence on Russian natural gas and costs that are multiples of last year's prices, then Europe should be in a severe crisis. How does this affect the US and metals when our overseas trading partners could be in a deep recession? Your thoughts, please.
A: Well, Europe’s being in a serious crisis indicates that the ECB is unlikely to raise interest rates, and even if it does, then it’s not likely to raise them by a lot, or to keep raising them for a long time. This means that the EUR/USD is likely to decline further, and the USD Index is likely to continue to rally.
And a rising USD Index is bearish for the prices of precious metals, at least in the short and medium term.
At some point, I expect gold to stop reacting to the USD’s gains and even rally despite that. This will be one of the signs pointing to the end of the current decline.
Summary
Summing up, it seems that the powerful medium-term downtrend in the precious metals sector is already underway. Still, I wouldn’t rule out a situation in which we get another, final, small corrective upswing in the near future. Based on how gold, silver, and mining stocks decline in the near future (including today), I might send out an intraday Alert with details regarding the current trading positions’ adjustment. If GDXJ gets below $27 today, I might (or not) even switch into a small, long position for a few days.
You have been profiting from how this situation develops practically throughout the entire year, and the above indicates (I’m not making any guarantees, of course) that the biggest gains are likely just ahead.
After the final sell-off (that takes gold to about $1,350-$1,500), I expect the precious metals to rally significantly. The final part of the decline might take as little as 1-5 weeks, so it's important to stay alert to any changes.
As always, we'll keep you – our subscribers – informed.
To summarize:
Trading capital (supplementary part of the portfolio; our opinion): Full speculative short positions (300% of the full position) in junior mining stocks are justified from the risk to reward point of view with the following binding exit profit-take price levels:
Mining stocks (price levels for the GDXJ ETF): binding profit-take exit price: $20.32; stop-loss: none (the volatility is too big to justify a stop-loss order in case of this particular trade)
Alternatively, if one seeks leverage, we’re providing the binding profit-take levels for the JDST (2x leveraged). The binding profit-take level for the JDST: $29.87; stop-loss for the JDST: none (the volatility is too big to justify a SL order in case of this particular trade).
For-your-information targets (our opinion; we continue to think that mining stocks are the preferred way of taking advantage of the upcoming price move, but if for whatever reason one wants / has to use silver or gold for this trade, we are providing the details anyway.):
Silver futures downside profit-take exit price: $12.32
SLV profit-take exit price: $11.32
ZSL profit-take exit price: $79.87
Gold futures downside profit-take exit price: $1,504
HGD.TO – alternative (Canadian) 2x inverse leveraged gold stocks ETF – the upside profit-take exit price: $19.87
HZD.TO – alternative (Canadian) 2x inverse leveraged silver ETF – the upside profit-take exit price: $49.87
Long-term capital (core part of the portfolio; our opinion): No positions (in other words: cash)
Insurance capital (core part of the portfolio; our opinion): Full position
Whether you’ve already subscribed or not, we encourage you to find out how to make the most of our alerts and read our replies to the most common alert-and-gold-trading-related-questions.
Please note that we describe the situation for the day that the alert is posted in the trading section. In other words, if we are writing about a speculative position, it means that it is up-to-date on the day it was posted. We are also featuring the initial target prices to decide whether keeping a position on a given day is in tune with your approach (some moves are too small for medium-term traders, and some might appear too big for day-traders).
Additionally, you might want to read why our stop-loss orders are usually relatively far from the current price.
Please note that a full position doesn't mean using all of the capital for a given trade. You will find details on our thoughts on gold portfolio structuring in the Key Insights section on our website.
As a reminder - "initial target price" means exactly that - an "initial" one. It's not a price level at which we suggest closing positions. If this becomes the case (as it did in the previous trade), we will refer to these levels as levels of exit orders (exactly as we've done previously). Stop-loss levels, however, are naturally not "initial", but something that, in our opinion, might be entered as an order.
Since it is impossible to synchronize target prices and stop-loss levels for all the ETFs and ETNs with the main markets that we provide these levels for (gold, silver and mining stocks - the GDX ETF), the stop-loss levels and target prices for other ETNs and ETF (among other: UGL, GLL, AGQ, ZSL, NUGT, DUST, JNUG, JDST) are provided as supplementary, and not as "final". This means that if a stop-loss or a target level is reached for any of the "additional instruments" (GLL for instance), but not for the "main instrument" (gold in this case), we will view positions in both gold and GLL as still open and the stop-loss for GLL would have to be moved lower. On the other hand, if gold moves to a stop-loss level but GLL doesn't, then we will view both positions (in gold and GLL) as closed. In other words, since it's not possible to be 100% certain that each related instrument moves to a given level when the underlying instrument does, we can't provide levels that would be binding. The levels that we do provide are our best estimate of the levels that will correspond to the levels in the underlying assets, but it will be the underlying assets that one will need to focus on regarding the signs pointing to closing a given position or keeping it open. We might adjust the levels in the "additional instruments" without adjusting the levels in the "main instruments", which will simply mean that we have improved our estimation of these levels, not that we changed our outlook on the markets. We are already working on a tool that would update these levels daily for the most popular ETFs, ETNs and individual mining stocks.
Our preferred ways to invest in and to trade gold along with the reasoning can be found in the how to buy gold section. Furthermore, our preferred ETFs and ETNs can be found in our Gold & Silver ETF Ranking.
As a reminder, Gold & Silver Trading Alerts are posted before or on each trading day (we usually post them before the opening bell, but we don't promise doing that each day). If there's anything urgent, we will send you an additional small alert before posting the main one.
Thank you.
Przemyslaw Radomski, CFA
Founder, Editor-in-chief

