

Briefly: in our opinion, full (300% of the regular position size) speculative short positions in junior mining stocks are justified from the risk/reward point of view at the moment of publishing this Alert.
PLEASE NOTE:
Dear Subscribers,
As the Author will be traveling this week, upcoming Gold & Silver Trading Alerts will not include regular technical analysis. Instead, they will focus on the fundamental aspects. The next regular technical analysis will be published on Monday, August 29. PR will inform you about significant changes (which are unlikely).
Stay tuned!
It was a sea of red across the financial markets on Aug. 19, as gold declined by 0.47%, silver by 2.03%, the GDX ETF by 2.17% and the GDXJ ETF by 3.06%. Moreover, the S&P 500 sank by 1.29% and the NASDAQ Composite by 2.01%. In contrast, the USD Index rallied by 0.64% and U.S. Treasury yields also rose sharply. As a result, the price action continues to unfold as expected (profits on our short position have just increased once again), and the trends should continue in the weeks ahead.
Stocks in the Spotlight
While last week proved that gold, silver, and mining stocks don't need the S&P 500's help to move lower, a sharp drawdown of the latter could intensify the drawdowns of the former. Thus, with bonds and commodities suffering recently, the S&P 500 should be next in line.
To explain, dovish comments by Fed Chairman Jerome Powell on Jul. 27 helped loosen financial conditions and uplift risk assets. In the process, the USD Index, real yields, and high yield credit spreads all retreated. However, with the damage reversing in recent days, financial conditions have re-tightened, and the developments spell trouble for the S&P 500.
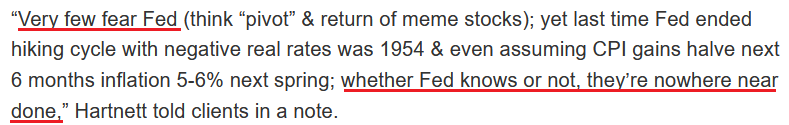
To that point, Michael Hartnett, Chief Market Strategist at Bank of America, told clients on Aug. 19 that we're in the midst of a "cyclical bear" market, and the "ultimate lows" are on the horizon. He wrote:
“[With] inflation on course to be 5%-6% next spring, quantitative tightening is likely to be stepped up significantly in coming months, which would be negative for credit spreads & equity multiples.”
Furthermore, with the crowd confusing Fed officials' poor communication skills for a dovish pivot, Hartnett shares our view that investors are ignoring the Fed at their own peril.
Please see below:
 Source: Investing.com
For context, I warned about this phenomenon on May 20. With investors following the post-GFC script, they’re more worried about missing a dovish pivot than suffering the consequences of ignoring fundamental reality. However, with their misguided faith in the central bank likely to be their undoing, market participants’ belief that the Fed can control the economic cycle should result in plenty of pain over the medium term. I wrote:
While some claim that sentiment is extremely bearish on Wall Street, the reality is that no one fears the Fed (…).
With the consensus still fighting the hawkish realities that I warned about since 2021, the VIX is behaving as you might expect. I mean, why panic when the Fed is all bark and no bite? Therefore, everyone can relax because the Fed will turn dovish, inflation will rage, and in some alternative reality, this outcome is bullish for risk assets.
However, I’ve warned on numerous occasions that a dovish pivot would have dire long-term consequences for the U.S. economy. As such, Fed officials (should) know this, and a small short-term recession is much more attractive than a long-term hyperinflationary collapse. Yet, investors still assume that the latter option is more likely because the Fed can’t withstand falling stock prices.
However, with recency bias clouding investors’ judgment, they don’t realize that 1970s/1980s-like inflation is a completely different animal.
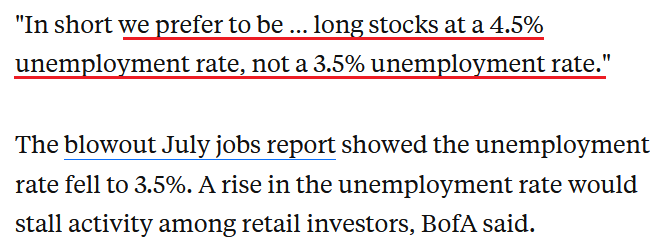
Furthermore, Hartnett noted the importance of the U.S. unemployment rate. Remember, bear markets don’t end with the U.S. unemployment rate at a ~50-year low; they begin with the metric at a ~50-year low. Thus, Hartnett realizes that the bottom in stocks likely awaits us.
Please see below:
 Source: Markets Insider
For context, I explained the relationship on Aug. 17. I wrote:
The U.S. unemployment rate hit a new 2022 low of 3.5% in July. However, the metric always bottoms before a recession.
Please see below:
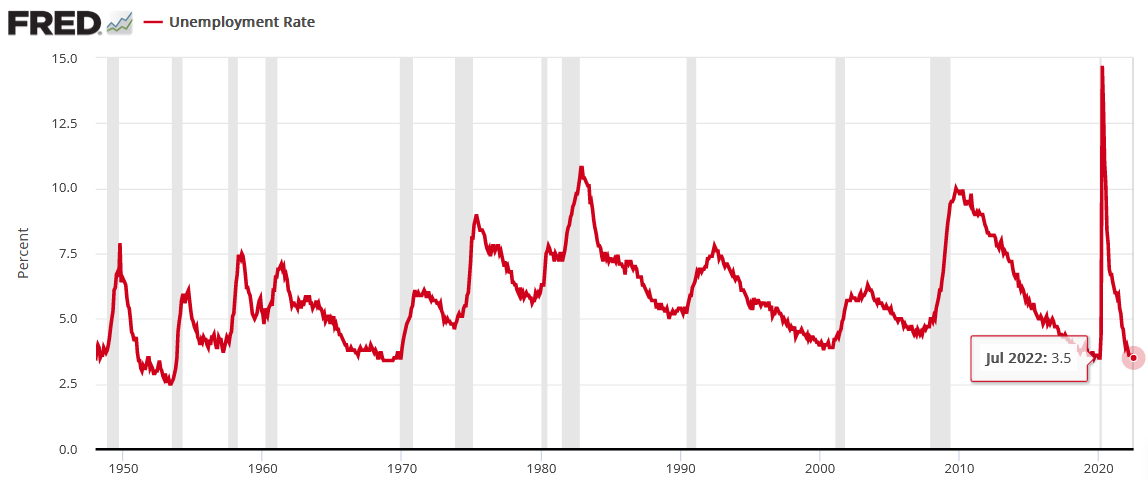
To explain, notice how the U.S. unemployment rate always troughs and then steadily rises before a recession hits? Thus, with the metric heading south in July, the bearish turn still awaits us (…).
All 11 instances of abnormally low U.S. unemployment rates since 1950 were bearish, not bullish. Furthermore, six readings occurred before/alongside profound S&P 500 bear markets, while five readings resulted in the S&P 500 giving back all of its prior gains. As a result, even if the latter occurs, the S&P 500 ended June at ~3.785, which implies more than 12% downside from the Aug. 16 close if the optimistic scenario unfolds.
However, with asset prices still in bubble territory and unanchored inflation forcing the Fed to tighten monetary policy at a torrent pace (rate hikes + QT), a soft landing is highly unlikely. Moreover, with the 1970s and 1980s highlighting the destruction that unfolds when inflation reaches unanchored levels, the bulls have a laundry list of excuses that only hold if ‘this time is different.’
Thus, while investors still have complete faith in the Fed, fundamental realities should shake their confidence over the medium term. Moreover, with their current expectations in la-la land, a realization leaves plenty of room for re-ratings of the PMs and the S&P 500.
Please see below:
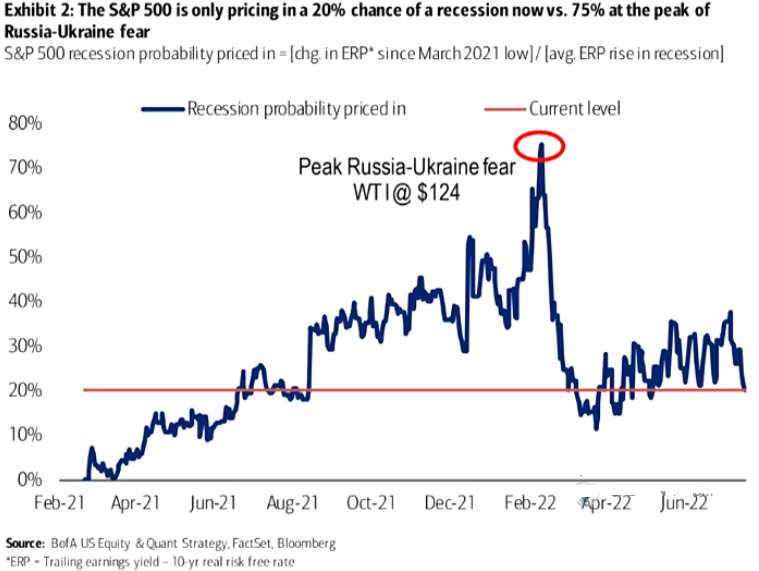
To explain, the blue line above tracks the recession odds priced into the S&P 500. For context, Bank of America forecasts the metric by dividing the change in the equity risk premium (ERP) since March 2021 by the average change in the ERP during historical recessions. If you analyze the high in early 2022, peak fear had investors pricing in a 75% chance of recession. Yet now, the metric stands at 20%.
However, uninformed investors don't realize that the Fed hasn't curbed unanchored inflation without triggering a recession since 1954. Therefore, history implies that the recession odds are 100%. As such, with sentiment likely to shift when investors lose faith in the Fed, asset prices should suffer mightily as they re-price to reflect their fundamental values.
Continuing the theme, I've warned repeatedly that the Fed needs higher real interest rates to curb inflation. Moreover, Powell understands this, and he made the point for me during his June FOMC press conference.
Please see below:
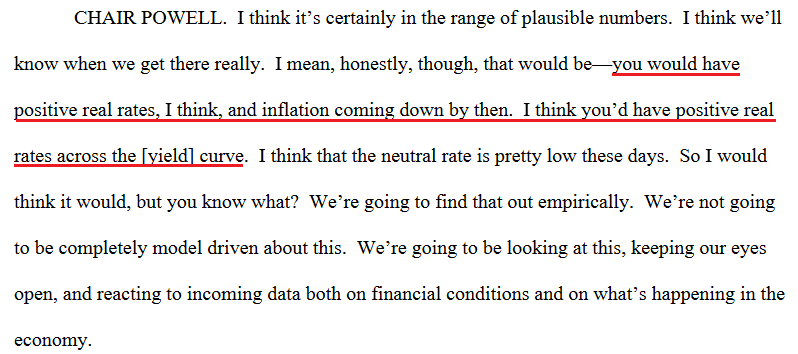 Source: U.S. Fed
Thus, with a higher U.S. 10-Year real yield extremely harmful to the PMs and the S&P 500’s fundamental values, further upside should weigh heavily on their medium-term prices.
Please see below:
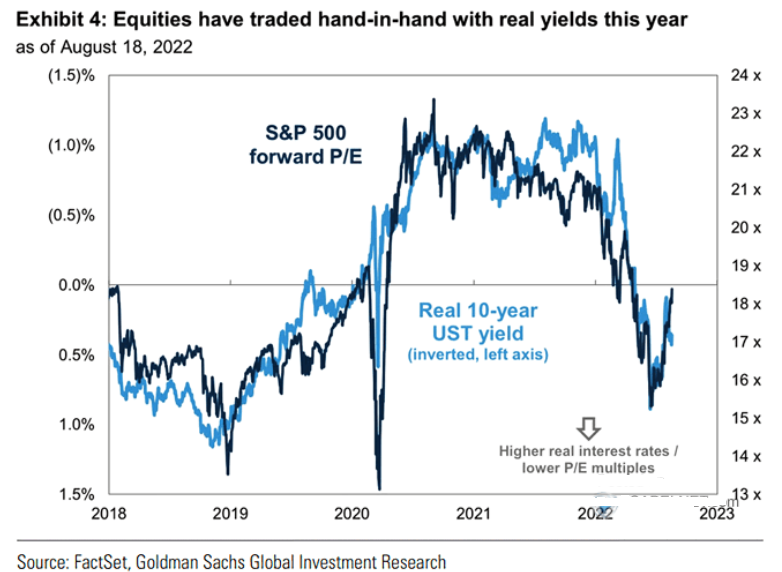
To explain, the dark blue line above tracks the S&P 500’s forward price-to-earnings (P/E) ratio, while the light blue line above tracks the inverted (down means up) U.S. 10-Year real yield. If you analyze the relationship, you can see that a higher U.S. 10-Year real yield compresses the S&P 500’s forward P/E.
Likewise, while it’s hard to see on the right side of the chart, the light blue line has moved lower once again as the U.S. 10-Year real yield recouped roughly 40% of its recent decline. In contrast, the S&P 500’s forward P/E has barely budged and is at 17.9x as of the Aug. 19 close. Therefore, a decline to the 17x implied by the U.S. 10-Year real yield would result in an immediate S&P 500 downside of 5%.
However, this would only erase the short-term imbalance. Please remember that the U.S. 10-Year real yield surpassed 1.1% in 2018, which is much higher than the current reading of 0.43%. Moreover, the U.S. had much lower inflation in 2018, so one could argue that the metric should exceed its 2018 highs given today’s fundamental environment.
Either way, a rally above 1% would put immense pressure on the S&P 500’s forward P/E. In addition, the projection only accounts for the ‘P’ (price) side of the equation. With the ‘E’ (earnings expectations) likely to decelerate sharply as the Fed hammers demand to cool inflation, the S&P 500’s forward P/E should have plenty of medium-term downside.
To that point, modern history reminds us that the S&P 500’s forward P/E falls well below 17.9x when recessions occur.
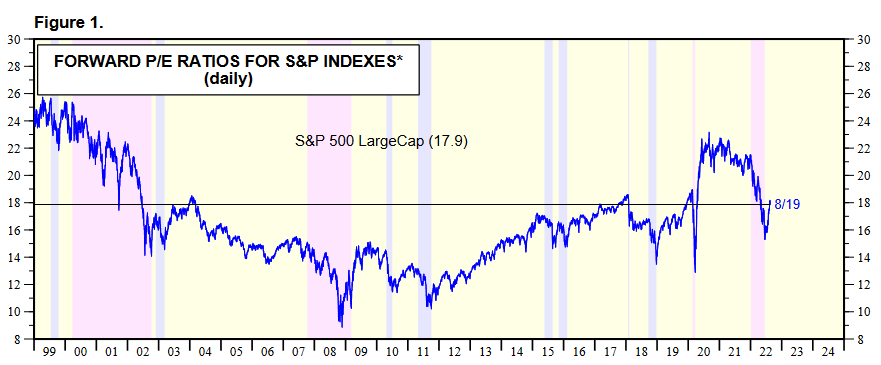 Source: Yardeni.com
Rents and the CPI
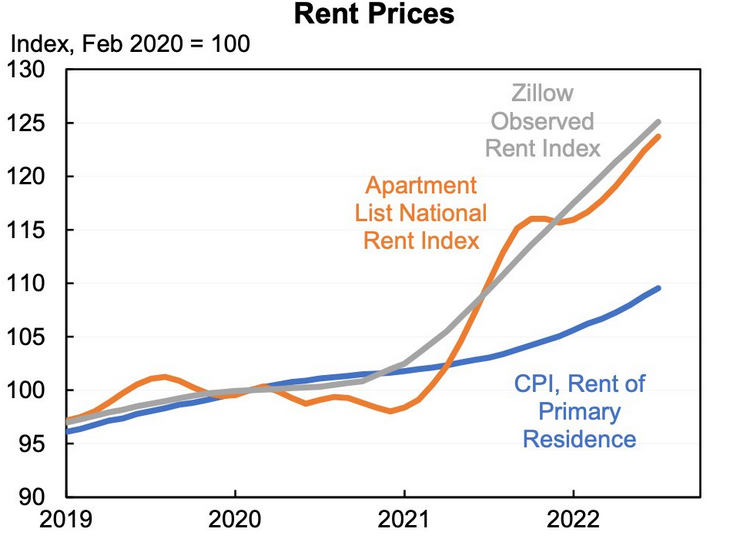
While I’ve been warning for months that higher rents would put upward pressure on the Consumer Price Index (CPI), the Shelter CPI hit a new 2022 high in July. Moreover, with the ascent likely in the early innings, a realization should make the Fed’s job increasingly difficult in the months ahead. For context, the Shelter CPI accounts for more than 30% of the headline CPI’s movement.
Please see below:
 Source: Jason Furman
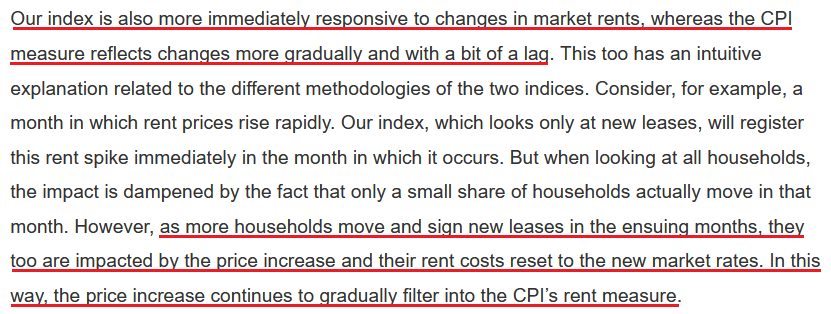
To explain, the gray and orange lines above track the index values of Zillow and Apartment List’s rental indices, while the blue line above tracks the rent component of the CPI. As you can see, the latter has materially underperformed the former.
However, please remember that the CPI component tracks the average of all rental prices, which includes new and renewed leases. In contrast, Zillow and Apartment List’s data only tracks new leases, where prices are rising much faster. Therefore, as new leases become a greater percentage of the rent CPI, they will put upward pressure on the Shelter CPI and the headline CPI.
As evidence, Apartment List researchers explained the discrepancy. They wrote:
“Our repeat-rent index tracks the change in rent prices for new leases, while the CPI measures the price change in market rents for all housing units. New leases always see the most significant price increases (or declines) in any given market, whereas renewal leases tend to see more modest rent adjustments.”
“And more importantly, only a small fraction of households sign a new or renewal lease in any given month, while the large majority of households see no change in their housing costs. As a result, housing price changes will always appear more muted when considering all households rather than only those who signed new leases.”
Thus, while the consensus assumes that inflation will subside and the Fed can cut rates in 2023, the realities on the ground suggest otherwise.
 Source: Apartment List
The Bottom Line
While gold, silver and mining stocks have materially underperformed the S&P 500 recently, they are still far from reflecting their fundamental values. Moreover, with the Fed still behind the inflation curve and quantitative tightening (QT) set to double to $95 billion per month next week, several assets should suffer sharp re-ratings as reality sets in over the medium term. As a result, the PMs' fundamental outlooks remain profoundly bearish for the next weeks or months. Consequently, it’s likely (no guarantees, of course) that the profits on our short position will increase much further in the not-too-distant future.
In conclusion, the PMs declined on Aug. 19, as the S&P 500 suffered a mild sell-off. Moreover, with real yields rising and the USD Index gunning for its 2022 highs, the S&P 500's bear market is likely far from over.
Overview of the Upcoming Part of the Decline
- It seems to me that the corrective upswing is either over or about to be over, and that the next big move lower is about to start.
- If we see a situation where miners slide in a meaningful and volatile way while silver doesn’t (it just declines moderately), I plan to – once again – switch from short positions in miners to short positions in silver. At this time, it’s too early to say at what price levels this could take place and if we get this kind of opportunity at all – perhaps with gold prices close to $1,600.
- I plan to exit all remaining short positions once gold shows substantial strength relative to the USD Index while the latter is still rallying. This may be the case with gold prices close to $1,400. I expect silver to fall the hardest in the final part of the move. This moment (when gold performs very strongly against the rallying USD and miners are strong relative to gold after its substantial decline) is likely to be the best entry point for long-term investments, in my view. This can also happen with gold close to $1,400, but at the moment it’s too early to say with certainty.
- The above is based on the information available today, and it might change in the following days/weeks.
You will find my general overview of the outlook for gold on the chart below:
Please note that the above timing details are relatively broad and “for general overview only” – so that you know more or less what I think and how volatile I think the moves are likely to be – on an approximate basis. These time targets are not binding nor clear enough for me to think that they should be used for purchasing options, warrants, or similar instruments.
Summary
Summing up, it seems that the corrective upswing is over (or close to being over), which means that the powerful medium-term downtrend can now resume.
Two weeks ago, we closed yet another profitable trade in a row. This year’s profits are already enormous, but it seems likely to me that they will grow even more in the following weeks and months. In particular, I expect the profits on the current short positions to be really profound.
After the final sell-off (that takes gold to about $1,350-$1,500), I expect the precious metals to rally significantly. The final part of the decline might take as little as 1-5 weeks, so it's important to stay alert to any changes.
As always, we'll keep you – our subscribers – informed.
To summarize:
Trading capital (supplementary part of the portfolio; our opinion): Full speculative short positions (300% of the full position) in junior mining stocks are justified from the risk to reward point of view with the following binding exit profit-take price levels:
Mining stocks (price levels for the GDXJ ETF): binding profit-take exit price: $20.32; stop-loss: none (the volatility is too big to justify a stop-loss order in case of this particular trade)
Alternatively, if one seeks leverage, we’re providing the binding profit-take levels for the JDST (2x leveraged). The binding profit-take level for the JDST: $29.87; stop-loss for the JDST: none (the volatility is too big to justify a SL order in case of this particular trade).
For-your-information targets (our opinion; we continue to think that mining stocks are the preferred way of taking advantage of the upcoming price move, but if for whatever reason one wants / has to use silver or gold for this trade, we are providing the details anyway.):
Silver futures downside profit-take exit price: $12.32
SLV profit-take exit price: $11.32
ZSL profit-take exit price: $79.87
Gold futures downside profit-take exit price: $1,504
HGD.TO – alternative (Canadian) 2x inverse leveraged gold stocks ETF – the upside profit-take exit price: $19.87
HZD.TO – alternative (Canadian) 2x inverse leveraged silver ETF – the upside profit-take exit price: $49.87
Long-term capital (core part of the portfolio; our opinion): No positions (in other words: cash)
Insurance capital (core part of the portfolio; our opinion): Full position
Whether you’ve already subscribed or not, we encourage you to find out how to make the most of our alerts and read our replies to the most common alert-and-gold-trading-related-questions.
Please note that we describe the situation for the day that the alert is posted in the trading section. In other words, if we are writing about a speculative position, it means that it is up-to-date on the day it was posted. We are also featuring the initial target prices to decide whether keeping a position on a given day is in tune with your approach (some moves are too small for medium-term traders, and some might appear too big for day-traders).
Additionally, you might want to read why our stop-loss orders are usually relatively far from the current price.
Please note that a full position doesn't mean using all of the capital for a given trade. You will find details on our thoughts on gold portfolio structuring in the Key Insights section on our website.
As a reminder - "initial target price" means exactly that - an "initial" one. It's not a price level at which we suggest closing positions. If this becomes the case (as it did in the previous trade), we will refer to these levels as levels of exit orders (exactly as we've done previously). Stop-loss levels, however, are naturally not "initial", but something that, in our opinion, might be entered as an order.
Since it is impossible to synchronize target prices and stop-loss levels for all the ETFs and ETNs with the main markets that we provide these levels for (gold, silver and mining stocks - the GDX ETF), the stop-loss levels and target prices for other ETNs and ETF (among other: UGL, GLL, AGQ, ZSL, NUGT, DUST, JNUG, JDST) are provided as supplementary, and not as "final". This means that if a stop-loss or a target level is reached for any of the "additional instruments" (GLL for instance), but not for the "main instrument" (gold in this case), we will view positions in both gold and GLL as still open and the stop-loss for GLL would have to be moved lower. On the other hand, if gold moves to a stop-loss level but GLL doesn't, then we will view both positions (in gold and GLL) as closed. In other words, since it's not possible to be 100% certain that each related instrument moves to a given level when the underlying instrument does, we can't provide levels that would be binding. The levels that we do provide are our best estimate of the levels that will correspond to the levels in the underlying assets, but it will be the underlying assets that one will need to focus on regarding the signs pointing to closing a given position or keeping it open. We might adjust the levels in the "additional instruments" without adjusting the levels in the "main instruments", which will simply mean that we have improved our estimation of these levels, not that we changed our outlook on the markets. We are already working on a tool that would update these levels daily for the most popular ETFs, ETNs and individual mining stocks.
Our preferred ways to invest in and to trade gold along with the reasoning can be found in the how to buy gold section. Furthermore, our preferred ETFs and ETNs can be found in our Gold & Silver ETF Ranking.
As a reminder, Gold & Silver Trading Alerts are posted before or on each trading day (we usually post them before the opening bell, but we don't promise doing that each day). If there's anything urgent, we will send you an additional small alert before posting the main one.
Thank you.
Przemyslaw Radomski, CFA
Founder, Editor-in-chief

