

Briefly: in our opinion, full (300% of the regular position size) speculative short positions in junior mining stocks are justified from the risk/reward point of view at the moment of publishing this Alert.
Introduction
The S&P 500 was in rally mode on Oct. 25, as the index jumped by 1.63%; and joining the festivities, gold increased by 0.24%, silver by 0.83%, the GDX ETF by 2.01% and the GDXJ ETF by 2.12%.
In contrast, the USD Index declined by 0.96% and the U.S. 10-Year real yield dropped by seven basis points. However, while the price action created the perfect environment for the PMs, their rallies were relatively uninspiring. Furthermore, with the optimism unlikely to last, a reversal of fortunes should be on the horizon.
Can’t Squeeze Forever
With the S&P 500 continuing to squeeze higher on Oct. 25, gold, silver and mining stocks participated in the risk rally. However, I noted on Oct. 19 that while the S&P 500 confronted a bullish tactical setup, its fundamental outlook remained profoundly bearish. I wrote:
Positioning, sentiment and seasonality support a higher S&P 500, while the medium-term technicals and fundamentals are profoundly bearish. Thus, we consider any strength a bear market rally and expect the index to hit lower lows in the months ahead. However, since asset prices don't move in a straight line, the setup is tactically bullish.
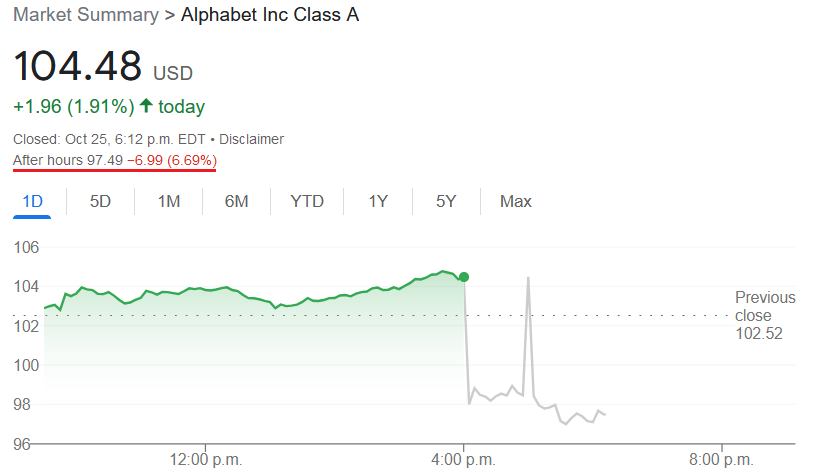
So while the S&P 500 has rallied sharply in recent days, the short-covering optimism ran into resistance after hours on Oct. 25. For example, Alphabet (Google) released its third-quarter earnings after the bell; and with the online advertising giant missing analysts’ estimates on both the top and bottom lines, the fundamental realities of unanchored inflation and higher interest rates re-emerged.
Please see below:
 Source: Google
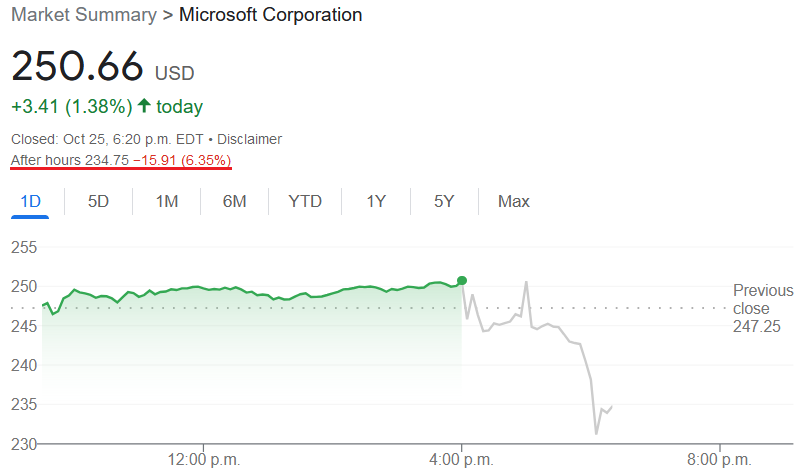
Likewise, Microsoft also reported after the bell on Oct. 25; and while the company surpassed analysts’ quarterly estimates, frail cloud performance and weak guidance helped batter the stock after hours.
Please see below:
 Source: Google
Thus, with two of the four largest companies in the S&P 500 suffering, the squeeze may have already run its course. Moreover, while positioning is still heavily short, the index offered tactical value near 3,600, not 3,850.
In addition, with the bearish medium-term fundamentals rearing their ugly head, and the Fed poised to raise interest rates by 75 basis points next week, stocks offer a poor risk-reward proposition when the U.S. federal funds rate (FFR) should hit 4%.
Also, the PMs confront the same problem when risk-free assets offer a 4% return. As such, the Fed’s inflation fight should continue to drive money out of risk assets and into cash, and the prospect is highly bearish for the PMs.
No Pivot
After investors confused a potential slowdown in rate hikes for a dovish pivot, it’s hard to count how many times they attempted to create their own reality in 2022. However, while each iteration of optimism led to short-term rallies, they were followed by new lows for the S&P 500 and the PMs.
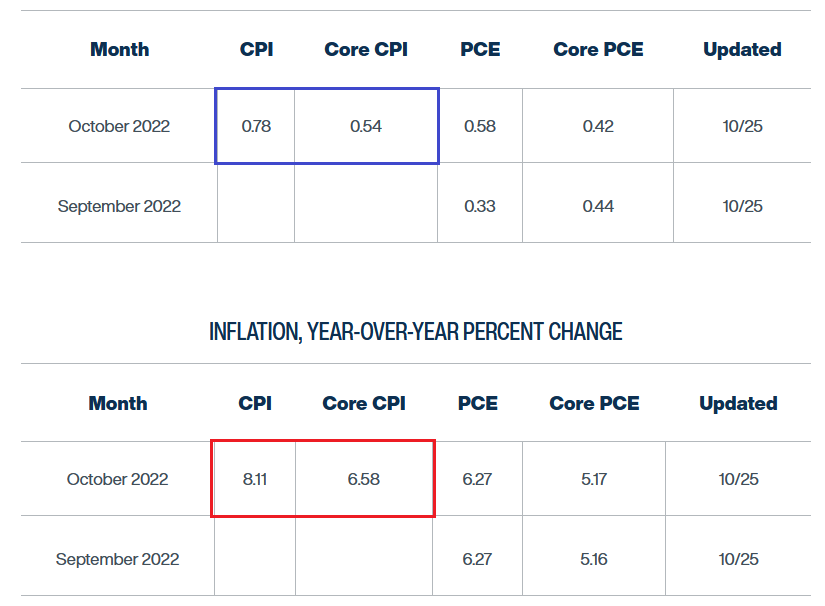
Therefore, with inflation still problematic, the Fed has yet to realize enough progress to support asset prices. For example, the Cleveland Fed updated its inflation Nowcast on Oct. 25; and with the headline and core Consumer Price Indexes (CPI) expected to increase by 8.11% and 6.58% (the red box) year-over-year (YoY) in October, we’re a long way from 2%.
Please see below:
 Source: Cleveland Fed
Furthermore, if you analyze the blue box at the top, you can see that the headline and core CPIs are projected to increase by 0.78% and 0.54% month-over-month (MoM); and if we annualize these MoM estimates, they work out to 9.77% and 6.68%, respectively. As a result, the YoY and MoM projections are far from pivot levels and highlight the stubbornness of inflation.
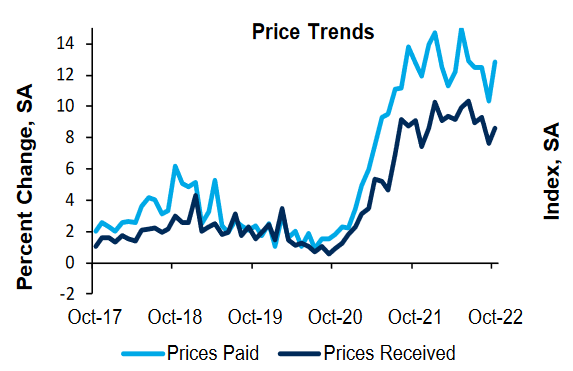
As further evidence, the Richmond Fed released its Fifth District Survey of Manufacturing Activity on Oct. 25. The headline index declined from 0 in September to -10 in October, as “two of its three component indexes deteriorated notably.”
However, while new orders and shipments suffered mightily, the report revealed that “the employment index remained unchanged at 0 in October, as hiring challenges persisted.” Thus, labor market conditions did not weaken, which is bullish for the FFR.
More importantly, the report added:
“The average growth rate of prices paid and prices received both increased again in October, after moderating in September. Expectations for both over the next 12 months also increased slightly from September.”
So while the crowd hopes that inflation will magically disappear, the reality is much different.
Please see below:
 Source: Richmond Fed
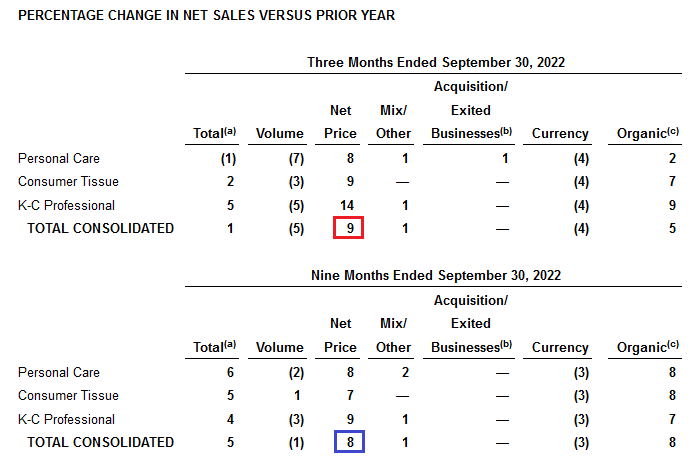
In addition, Kimberly-Clark – an American personal care company with a more than $40 billion market cap – released its third-quarter earnings on Oct. 25. CEO Mike Hsu said during the Q3 earnings call:
“We're up or even in about half of our categories, a little bit more than that in personal care; and we were very fast on pricing. We've been very decisive on pricing all year.”
CFO Nelson Urdaneta added:
“As we look into Q4, our outlook in which there is an implied step up like what we saw in Q3, the drivers behind it would be, first, is around pricing realization. As a reminder, we've implemented additional pricing actions in the third quarter, and those will be fully realized as we go into the fourth quarter. So we do expect in the fourth quarter another step-up in terms of price realization as we look at our overall outlook.”
As a result, inflation is not faltering, and a much higher level of demand destruction is needed to cool the pricing pressures.
Please see below:
 Source: Kimberly-Clark
To explain, Kimberly-Clark realized 9% YoY net pricing in Q3 (the red box). However, on a nine-month basis, the figure is 8% (the blue box). Therefore, the company has increased its prices faster in the last three months versus the six months prior, which highlights the difficulty of the Fed’s inflation fight.
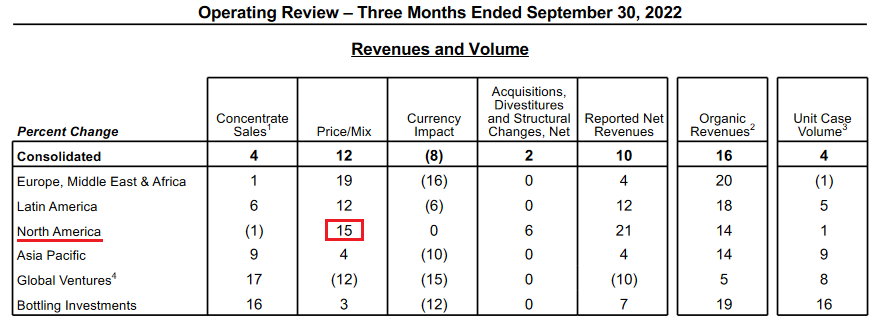
Finally, Coca-Cola – one of the largest beverage companies in the world – released its third-quarter earnings on Oct. 25. CFO John Murphy said during the Q3 earnings call:
“We are encouraged by the momentum in our top line and we leverage our capabilities to sustain top-line growth with the ongoing inflationary backdrop. As we look to our cost outlook, we expect global inflation to continue to impact our expenses across the board and commodities to remain volatile.”
CEO James Quincey added:
“It’s likely that next year price/mix will run ahead of volume in a similar way it has this year. I mean our long-term growth algorithm has assumed a relative balance between price and mix. Clearly, at the moment, we're in a period where there's more price/mix than there is volume, and that seems that seems likely to continue into next year.”
Please see below:
 Source: Coca-Cola
To explain, Coca-Cola increased its North American prices by up to 15% in Q3, which highlights the pricing power some companies have in the marketplace. More importantly, the results mirror Kimberly-Clark.
Please see below:
 Source: Coca-Cola
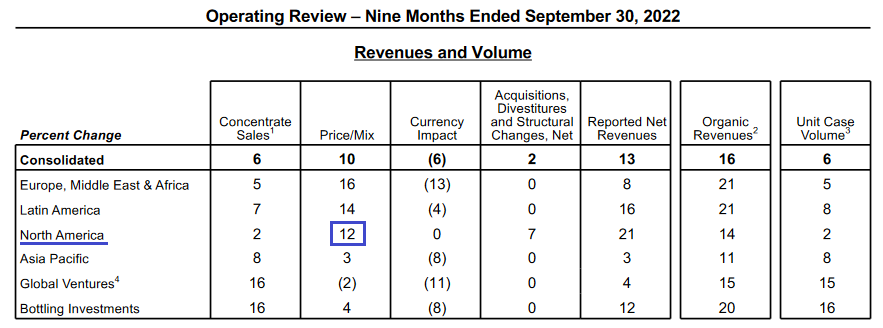
To explain, Coca-Cola realized a North American price/mix of 15% in Q3 and 12% over the last nine months. As a result, the company’s pricing actions have increased throughout 2022 rather than decelerating as the Fed had hoped. Therefore, while I’ve warned repeatedly that the Fed’s inflation fight will be one of attrition, the consensus still underestimates the challenges that lie ahead.
The Bottom Line
With Alphabet and Microsoft spoiling the party after hours on Oct. 25, the pair brought investors back to reality. Moreover, with the Fed still miles away from its 2% inflation goal, the FFR should continue its ascent until demand destruction materializes. As such, investors don’t realize that resilient consumer spending and corporate earnings (which most companies have delivered so far in Q3) will necessitate a higher FFR to curb inflation. Thus, the liquidity drain should remain in effect for the foreseeable future.
In conclusion, the PMs rallied on Oct. 25, as the S&P 500’s optimism was contagious. Furthermore, the declines in the USD Index and the U.S. 10-Year real yield were music to the bulls’ ears. However, with the fundamentals still profoundly bearish and Big Tech showing cracks in its foundation, this bear market rally should fail. So we expect gold, silver, mining stocks, and the S&P 500 to hit lower lows in the months ahead.
Overview of the Upcoming Part of the Decline
- It seems to me that the corrective upswing is over, and that the next big move lower is already underway.
- If we see a situation where miners slide in a meaningful and volatile way while silver doesn’t (it just declines moderately), I plan to – once again – switch from short positions in miners to short positions in silver. At this time, it’s too early to say at what price levels this could take place and if we get this kind of opportunity at all – perhaps with gold prices close to $1,500-$1,550.
- I plan to switch from the short positions in junior mining stocks or silver (whichever I’ll have at that moment) to long positions in junior mining stocks when gold / mining stocks move to their 2020 lows (approximately). While I’m probably not going to write about it at this stage yet, this is when some investors might consider getting back in with their long-term investing capital (or perhaps 1/3 or 1/2 thereof).
- I plan to return to short positions in junior mining stocks after a rebound – and the rebound could take gold from about $1,450 to about $1,550, and it could take the GDXJ from about $20 to about $24.
- I plan to exit all remaining short positions once gold shows substantial strength relative to the USD Index while the latter is still rallying. This may be the case with gold prices close to $1,400 and GDXJ close to $15 . This moment (when gold performs very strongly against the rallying USD and miners are strong relative to gold after its substantial decline) is likely to be the best entry point for long-term investments, in my view. This can also happen with gold close to $1,400, but at the moment it’s too early to say with certainty.
- The above is based on the information available today, and it might change in the following days/weeks.
You will find my general overview of the outlook for gold on the chart below:
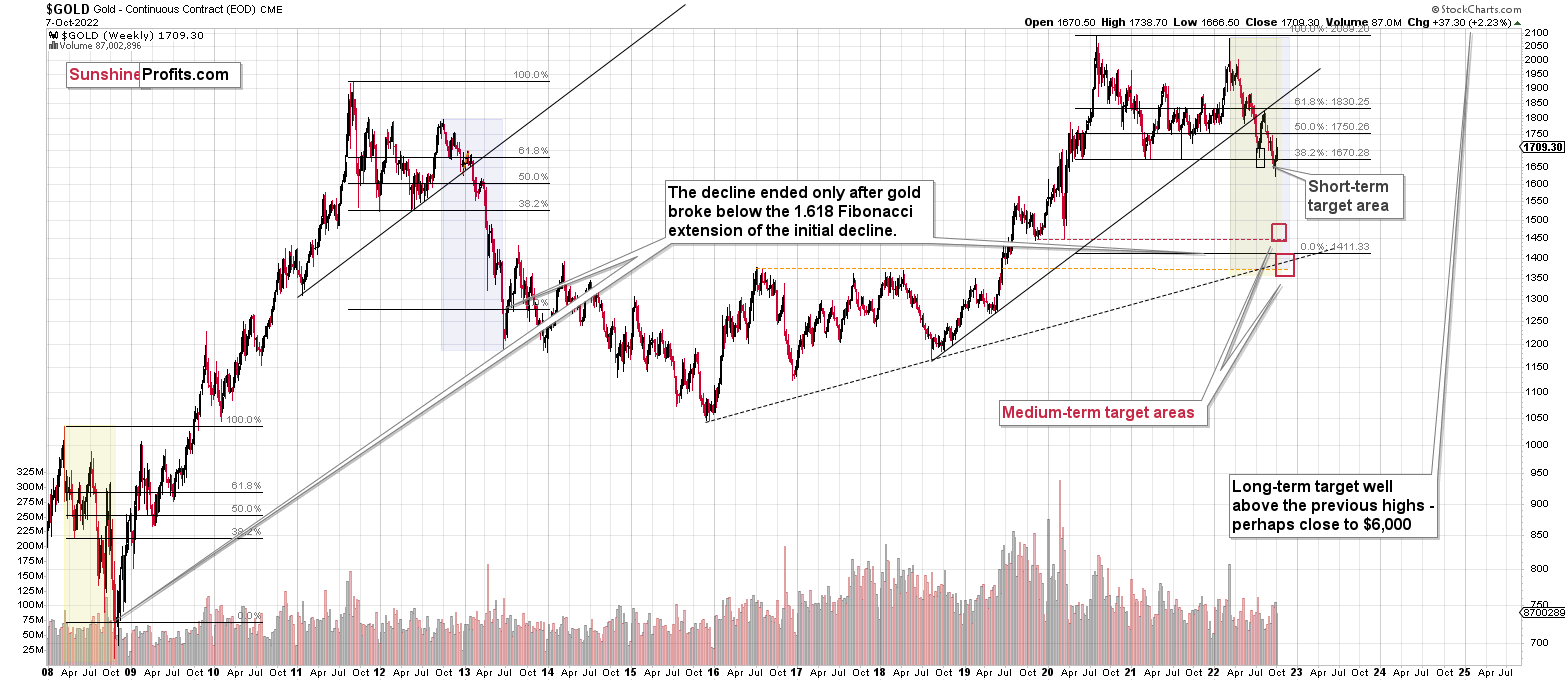
Please note that the above timing details are relatively broad and “for general overview only” – so that you know more or less what I think and how volatile I think the moves are likely to be – on an approximate basis. These time targets are not binding nor clear enough for me to think that they should be used for purchasing options, warrants, or similar instruments.
Summary
Summing up, it seems that the biggest part of the 2013-like decline is taking place right now, and – while I can’t make any promises regarding performance - it seems likely to me that our big profits are about to become huge, and then ridiculously big in the relatively near future.
As far as this quick corrective upswing is concerned, it seems that it might already be over.
The current quick upswing most likely doesn’t change anything. Fundamentals and technicals continue to point to lower precious metals values in the coming weeks / months. The current geopolitical news-based rally is likely to serve as nothing more than just a verification of the breakdown below the previous lows in gold.
Things might happen very fast in the coming days, and if I plan to make any adjustments, I’ll keep you informed. Still, if the targets that I’m mentioning in the “Trading” part of the summary are reached, I think that profits should be taken off the table without an additional confirmation from me. I will probably get on the long side of the market at that time, but I’ll send a confirmation if I decide to do so.
After the final sell-off (that takes gold to about $1,350-$1,500), I expect the precious metals to rally significantly. The final part of the decline might take as little as 1-5 weeks, so it's important to stay alert to any changes.
As always, we'll keep you – our subscribers – informed.
To summarize:
Trading capital (supplementary part of the portfolio; our opinion): Full speculative short positions (300% of the full position) in junior mining stocks are justified from the risk to reward point of view with the following binding exit profit-take price levels:
Mining stocks (price levels for the GDXJ ETF): binding profit-take exit price: $20.32; stop-loss: none (the volatility is too big to justify a stop-loss order in case of this particular trade)
Alternatively, if one seeks leverage, we’re providing the binding profit-take levels for the JDST (2x leveraged). The binding profit-take level for the JDST: $27.87; stop-loss for the JDST: none (the volatility is too big to justify a SL order in case of this particular trade).
For-your-information targets (our opinion; we continue to think that mining stocks are the preferred way of taking advantage of the upcoming price move, but if for whatever reason one wants / has to use silver or gold for this trade, we are providing the details anyway.):
Silver futures downside profit-take exit price: $12.32
SLV profit-take exit price: $11.32
ZSL profit-take exit price: $74.87
Gold futures downside profit-take exit price: $1,504
HGD.TO – alternative (Canadian) 2x inverse leveraged gold stocks ETF – the upside profit-take exit price: $18.47
HZD.TO – alternative (Canadian) 2x inverse leveraged silver ETF – the upside profit-take exit price: $46.87
Long-term capital (core part of the portfolio; our opinion): No positions (in other words: cash)
Insurance capital (core part of the portfolio; our opinion): Full position
Whether you’ve already subscribed or not, we encourage you to find out how to make the most of our alerts and read our replies to the most common alert-and-gold-trading-related-questions.
Please note that we describe the situation for the day that the alert is posted in the trading section. In other words, if we are writing about a speculative position, it means that it is up-to-date on the day it was posted. We are also featuring the initial target prices to decide whether keeping a position on a given day is in tune with your approach (some moves are too small for medium-term traders, and some might appear too big for day-traders).
Additionally, you might want to read why our stop-loss orders are usually relatively far from the current price.
Please note that a full position doesn't mean using all of the capital for a given trade. You will find details on our thoughts on gold portfolio structuring in the Key Insights section on our website.
As a reminder - "initial target price" means exactly that - an "initial" one. It's not a price level at which we suggest closing positions. If this becomes the case (as it did in the previous trade), we will refer to these levels as levels of exit orders (exactly as we've done previously). Stop-loss levels, however, are naturally not "initial", but something that, in our opinion, might be entered as an order.
Since it is impossible to synchronize target prices and stop-loss levels for all the ETFs and ETNs with the main markets that we provide these levels for (gold, silver and mining stocks - the GDX ETF), the stop-loss levels and target prices for other ETNs and ETF (among other: UGL, GLL, AGQ, ZSL, NUGT, DUST, JNUG, JDST) are provided as supplementary, and not as "final". This means that if a stop-loss or a target level is reached for any of the "additional instruments" (GLL for instance), but not for the "main instrument" (gold in this case), we will view positions in both gold and GLL as still open and the stop-loss for GLL would have to be moved lower. On the other hand, if gold moves to a stop-loss level but GLL doesn't, then we will view both positions (in gold and GLL) as closed. In other words, since it's not possible to be 100% certain that each related instrument moves to a given level when the underlying instrument does, we can't provide levels that would be binding. The levels that we do provide are our best estimate of the levels that will correspond to the levels in the underlying assets, but it will be the underlying assets that one will need to focus on regarding the signs pointing to closing a given position or keeping it open. We might adjust the levels in the "additional instruments" without adjusting the levels in the "main instruments", which will simply mean that we have improved our estimation of these levels, not that we changed our outlook on the markets. We are already working on a tool that would update these levels daily for the most popular ETFs, ETNs and individual mining stocks.
Our preferred ways to invest in and to trade gold along with the reasoning can be found in the how to buy gold section. Furthermore, our preferred ETFs and ETNs can be found in our Gold & Silver ETF Ranking.
As a reminder, Gold & Silver Trading Alerts are posted before or on each trading day (we usually post them before the opening bell, but we don't promise doing that each day). If there's anything urgent, we will send you an additional small alert before posting the main one.
Thank you.
Przemyslaw K. Radomski, CFA
Founder, Editor-in-chief

