

Briefly: in our opinion, full (300% of the regular position size) speculative short positions in junior mining stocks are justified from the risk/reward point of view at the moment of publishing this Alert.
PLEASE NOTE:
Dear Subscribers,
Due to the Author's absence, todayw's analysis will only consist of the fundamental part. The next full article will be back on Monday (Sep. 26). If something important happens in the market during the day, PR will inform you about it in a separate message.
Stay tuned!
Introduction
The PMs were divided on Sep. 22, as gold and silver rallied by 0.32% and 0.70%, respectively, while the GDX and GDXJ ETFs declined by 0.38% and 1.20%. Moreover, with the S&P 500’s 0.84% decline supporting the latter’s movements, mining stocks fell alongside the U.S. equity benchmark.
Conversely, the USD Index and the U.S. 10-Year real yield hit new 2022 highs, which are ominous developments for the PMs. As such, the price action across asset classes largely unfolded as expected.
Yields Unhinged
With the S&P 500 and the GDXJ ETF suffering in unison on Sep. 22, hawkish realities continue to upend risk assets. Moreover, while gold and silver were relative outperformers, the implications of higher nominal and real interest rates should prove problematic in the months ahead.
Please see below:
 Source: Investing.com
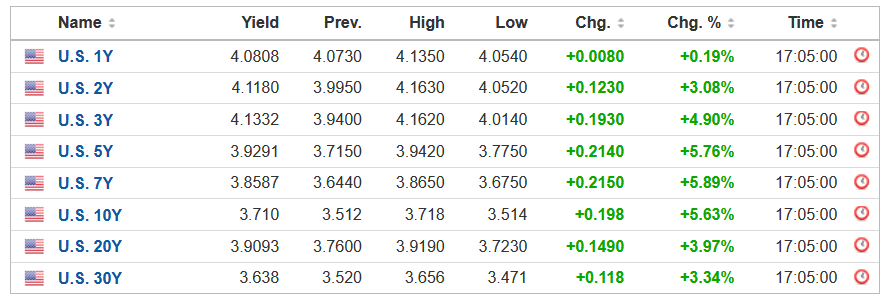
To explain, the U.S. yield curve remains on fire, as Treasury yields rose sharply on Sep. 22. Furthermore, with the U.S. 10-Year Treasury yield ending the session at 3.70% (StockCharts' data), the benchmark has rallied by more than 100 basis points from its August low.
More importantly, with the U.S. 10-Year breakeven inflation rate ending the Sep. 22 session at 2.41%, the U.S. 10-Year real yield soared to 1.29%, its highest level since 2011. As a result, financial conditions continue to tighten, and the ramifications are profoundly bearish for gold, silver and mining stocks.
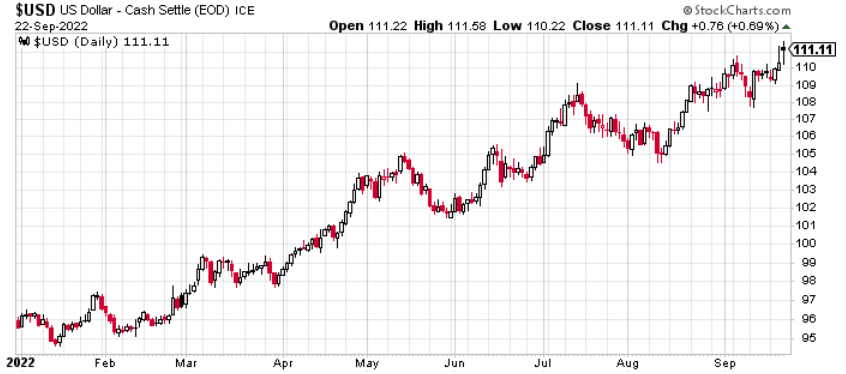
In addition, the USD Index hit new 2022 intraday and closing highs on Sep. 22, and the dollar basket remains poised for further gains. Therefore, the PMs' main fundamental adversaries continue to perform as expected, and their medium-term outlooks are bright as inflation keeps the Fed's foot on the hawkish accelerator.
Please see below:
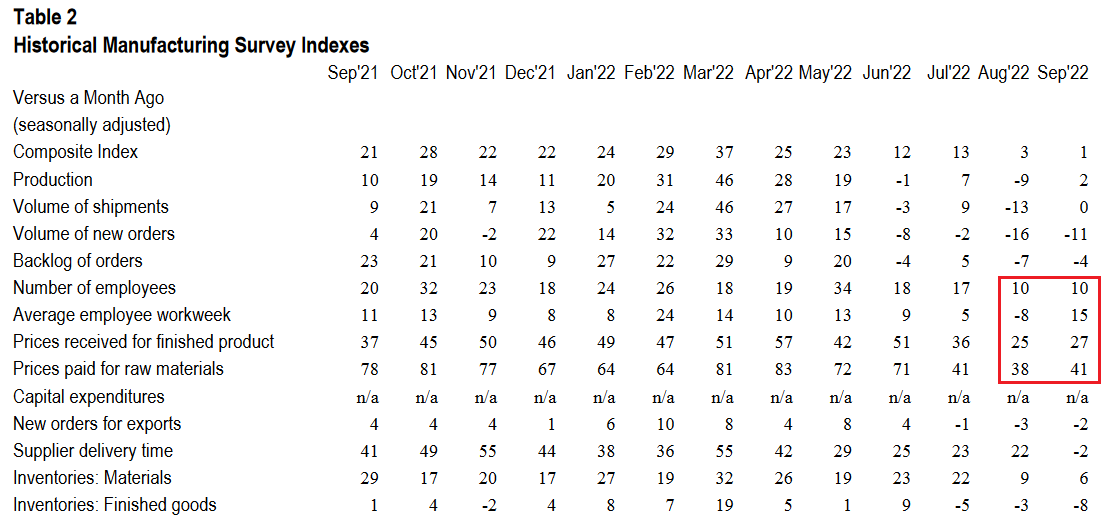
To that point, the Kansas City Fed released its Tenth District Manufacturing Activity Survey on Sep. 22. The headline index decreased from 3 in August to 1 in September. However, the report revealed that “most month-over-month (MoM) indexes increased in September, except for supplier delivery time, materials inventories, and finished goods inventories.”
Also, the data showed that inflation and employment remained resilient, which is profoundly bullish for future Fed policy.
Please see below:
 Source: KC Fed
To explain, the table above tracks the monthly readings for all of the KC Fed's manufacturing indexes. If you analyze the red box on the right side, you can see that prices paid, prices received and the average employee workweek all increased MoM.
Thus, KC manufacturing firms experienced higher inflation and increased their operating hours in September versus August. Similarly, the number of employees index remained constant at 10, which signals that KC firms are not laying off their workers as the U.S. labor market remains tight.
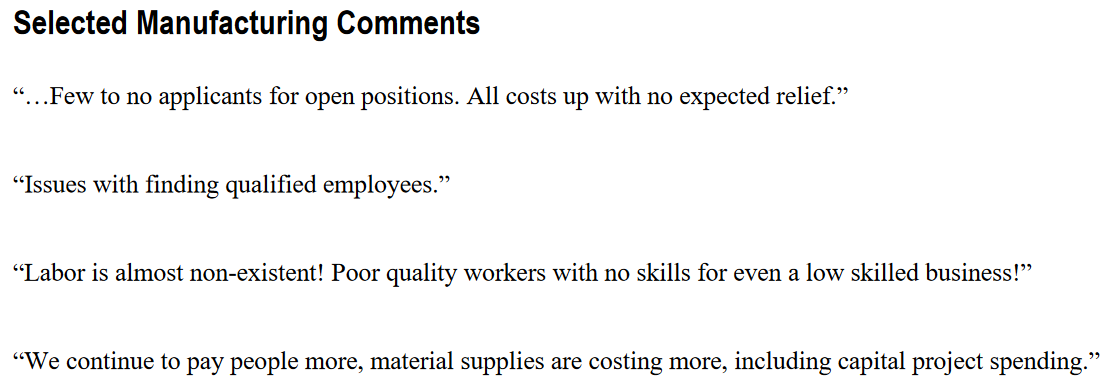
As evidence, KC firms' anecdotal comments highlight why wage inflation is unlikely to abate anytime soon.
Please see below:
 Source: KC Fed
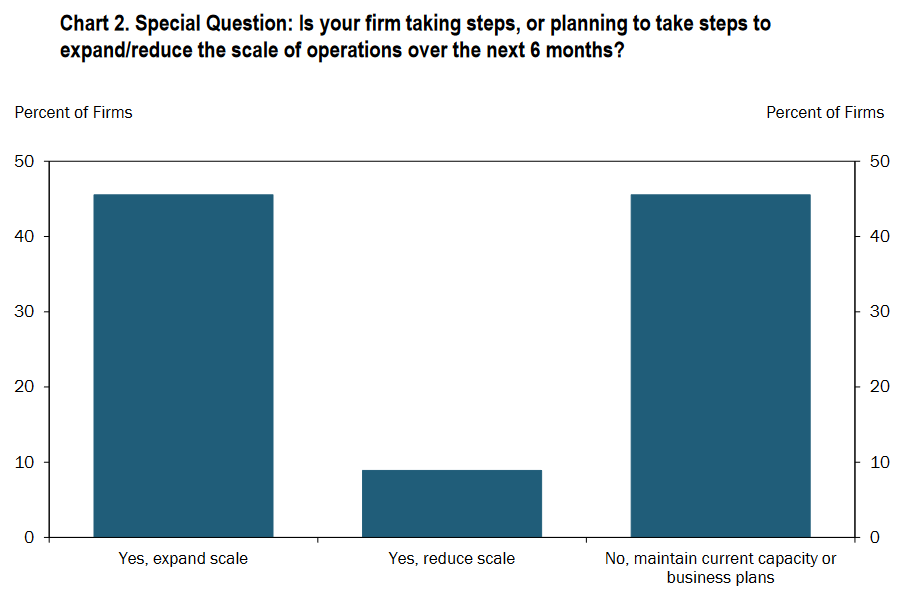
On top of that, the overwhelming majority of KC firms plan to increase or maintain their current capacity over the next six months. As such, the demand destruction needed to alleviate inflation still awaits us. The report stated:
“In September, nearly half of firms reported they were taking steps, or planning to take steps, to expand the scale of operations over the next six months, while only a handful expected to decrease capacity. The steps firms reported to expand scale included adding to workforce size, capital expansion, and expanding into new or existing markets.”
Please see below:
 Source: KC Fed
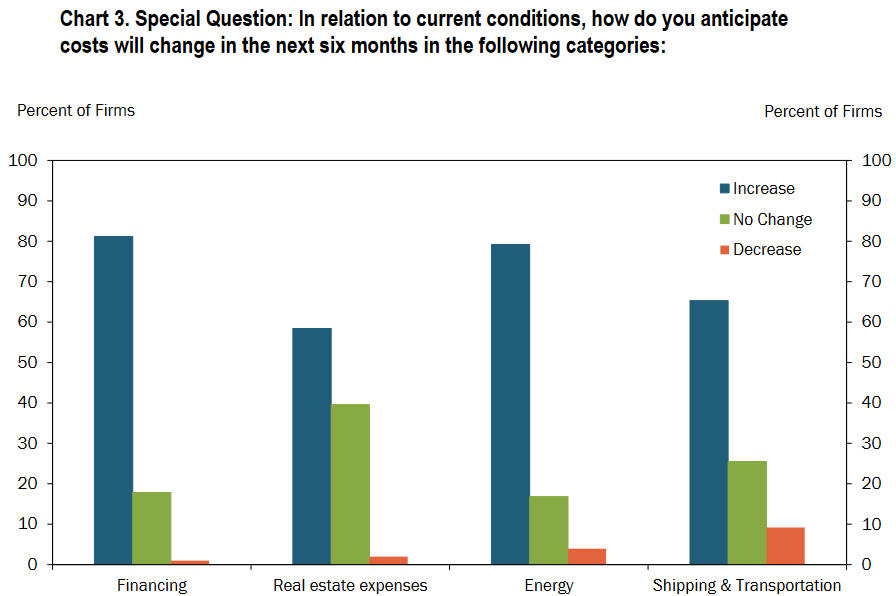
In addition:
“In relation to current conditions, a majority of firms anticipated costs will increase in the next six months across all categories, especially for financing and energy related costs.”
Please see below:
 Source: KC Fed
Thus, with most KC firms struggling to find qualified workers and also expecting other input costs to increase over the next six months, the inflationary findings are bullish for future rate hikes. Likewise, with more than 90% of KC firms either expanding or maintaining their operations over the next six months, we’re far from the demand destruction that would allow the Fed to pivot.
As such, more rate hikes should commence in the coming months, and the liquidity drain is profoundly bearish for gold, silver, and mining stocks.
More Hawkish Data
While the consensus continuously cites supply-chain disruptions, I’ve warned on numerous occasions that demand is much stronger than the crowd realizes. Therefore, resilient consumer spending keeps inflation uplifted and requires a higher U.S. federal funds rate (FFR) to normalize the pricing pressures.
To that point, while the fall season has arrived and pent-up demand should be in the rearview, Americans remain eager to spend their money.
Please see below:
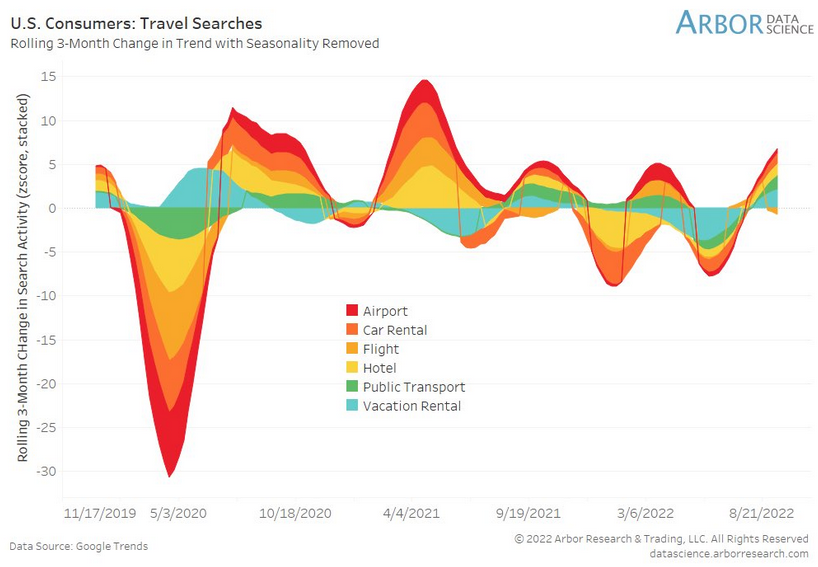
To explain, the shaded areas above track the z-score of the three-month rolling change in Americans’ Google Search activity for travel-related items. For context, these include flights, hotels, car rentals, etc.
If you analyze the right side of the chart, you can see that overall search activity remains decidedly elevated. Thus, despite higher inflation, Americans are still planning vacations, and material wage growth affords them this ability. Moreover, with households’ checkable deposits hitting a record high in Q2, Americans’ ability and willingness to spend makes the Fed’s inflation fight extremely difficult.
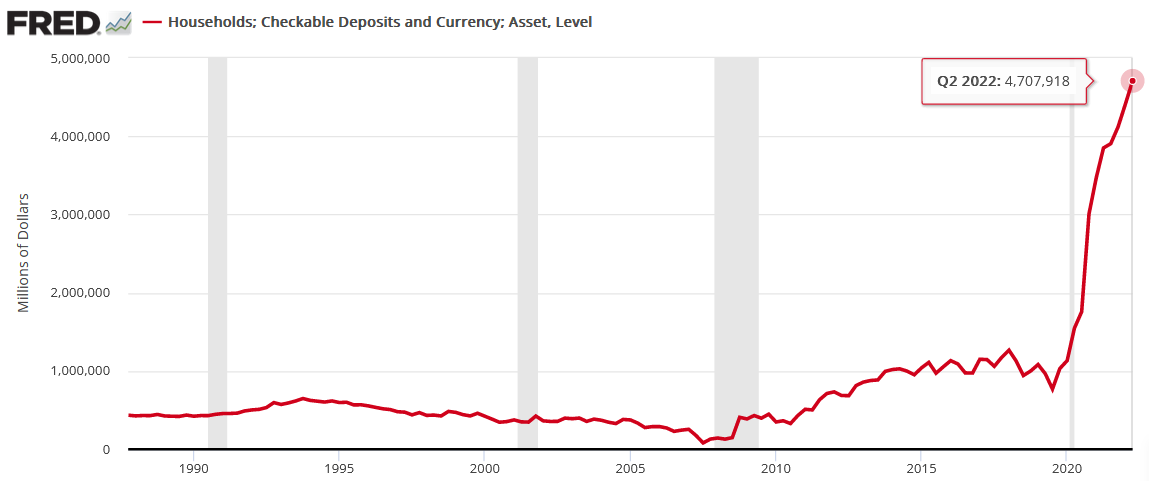
To explain, I wrote on Sep. 19:
The Fed updated the data on Sep. 9; and with the metric hitting another all-time high, American households have nearly $4.708 trillion in their checking accounts (as of Q2), a 357% increase from Q4 2019. Furthermore, the Q2 figure is 6.7% higher than Q1.
Please see below:
Also noteworthy, General Mills released its first-quarter earnings on Sep. 21. For context, it has a nearly $50 billion market cap and is one of the largest food & beverage companies in the U.S. CFO Kofi Bruce said during the Q1 earnings call:
“We are modestly higher on inflation in the front half and modestly is probably appropriate. But I think on balance, it is still a relatively balanced year in terms of our inflation call between 14% and 15%.”
Moreover, CEO Jeff Harmening added that price increases are the necessary cure:
“We will start to roll over more meaningful pricing in the back half of this year; and obviously, we saw a strong price/mix come through in Q1 that's likely similar in Q2 and then it decelerates as we start comparing more meaningful step-ups last year.”
Please see below:
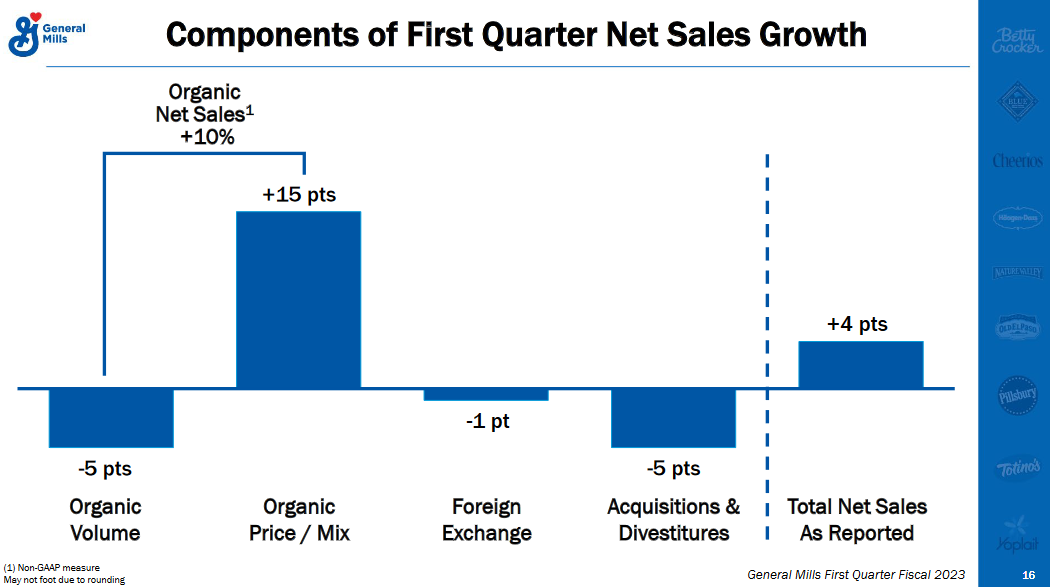
To explain, General Mills broke down its organic net sales, which excludes the impact of acquisitions, divestitures and FX. If you analyze the left side of the chart, you can see that organic volume declined by 5% in Q1. However, organic net sales were up by 10% on the back of a 15% increase in price/mix. As a result, the company increased its prices by up to 15% in Q1.
But if we ignore General Mills’ international segment and focus on North America, the organic price increases were higher than the 15% consolidated figure.
Please see below:
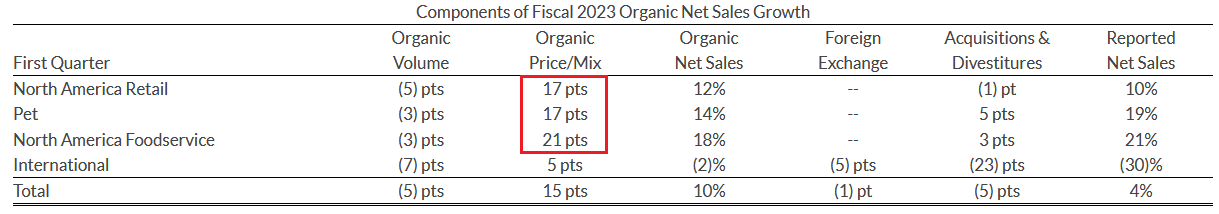 Source: General Mills
To explain, the red box above shows how General Mills' North American retail, foodservice, and pet segments enjoyed organic price/mix increases of 17%, 21%, and 17%, respectively.
Moreover, with volume down across all segments, the data highlights how price increases were the primary driver of General Mills' top-line organic growth. Therefore, the Fed is still miles away from solving its inflation conundrum.
Finally, Bloomberg revealed on Sep. 22 that its American Diner Index increased by 13% year-over-year (YoY). For context, the index "includes ingredients for the tooth-picked club sandwich, as well as the accompanying potato chips, ice cream, and soda." In addition, its purpose is to gauge "how much more expensive it's become to assemble a basic meal." Thus, the food inflation story stretches far beyond General Mills.
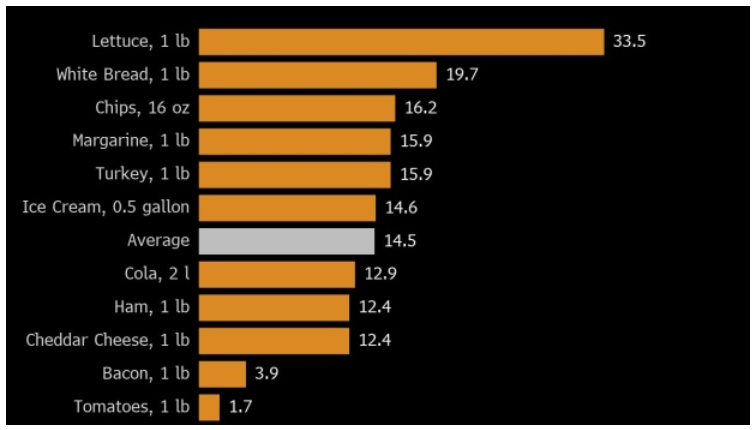 Source: Bloomberg
The Bottom Line
With the bond market sell-off intensifying on Sep. 22, the S&P 500 continues to suffer. However, while the PMs have been relative outperformers recently, the impact of higher real yields and a stronger USD Index should weigh heavily on their performance over the medium term. Furthermore, while the general stock market’s decline has been rather orderly, a true bout of panic could intensify the pace of the PMs’ likely drawdowns – especially silver and mining stocks.
In conclusion, the PMs were mixed on Sep. 22, as mining stocks followed the S&P 500 lower. Likewise, with the fundamental pain poised to persist, the implications of rapidly rising interest rates are far from priced in. As a result, gold, silver, and mining stocks’ medium-term outlooks remain profoundly bearish.
Overview of the Upcoming Part of the Decline
- It seems to me that the corrective upswing is over, and that the next big move lower is already underway.
- If we see a situation where miners slide in a meaningful and volatile way while silver doesn’t (it just declines moderately), I plan to – once again – switch from short positions in miners to short positions in silver. At this time, it’s too early to say at what price levels this could take place and if we get this kind of opportunity at all – perhaps with gold prices close to $1,600.
- I plan to switch from the short positions in junior mining stocks or silver (whichever I’ll have at that moment) to long positions in junior mining stocks when gold / mining stocks move to their 2020 lows (approximately). While I’m probably not going to write about it at this stage yet, this is when some investors might consider getting back in with their long-term investing capital (or perhaps 1/3 or 1/2 thereof).
- I plan to return to short positions in junior mining stocks after a rebound – and the rebound could take gold from about $1,450 to about $1,550, and it could take the GDXJ from about $20 to about $24.
- I plan to exit all remaining short positions once gold shows substantial strength relative to the USD Index while the latter is still rallying. This may be the case with gold prices close to $1,400 and GDXJ close to $15 . This moment (when gold performs very strongly against the rallying USD and miners are strong relative to gold after its substantial decline) is likely to be the best entry point for long-term investments, in my view. This can also happen with gold close to $1,400, but at the moment it’s too early to say with certainty.
- The above is based on the information available today, and it might change in the following days/weeks.
You will find my general overview of the outlook for gold on the chart below:
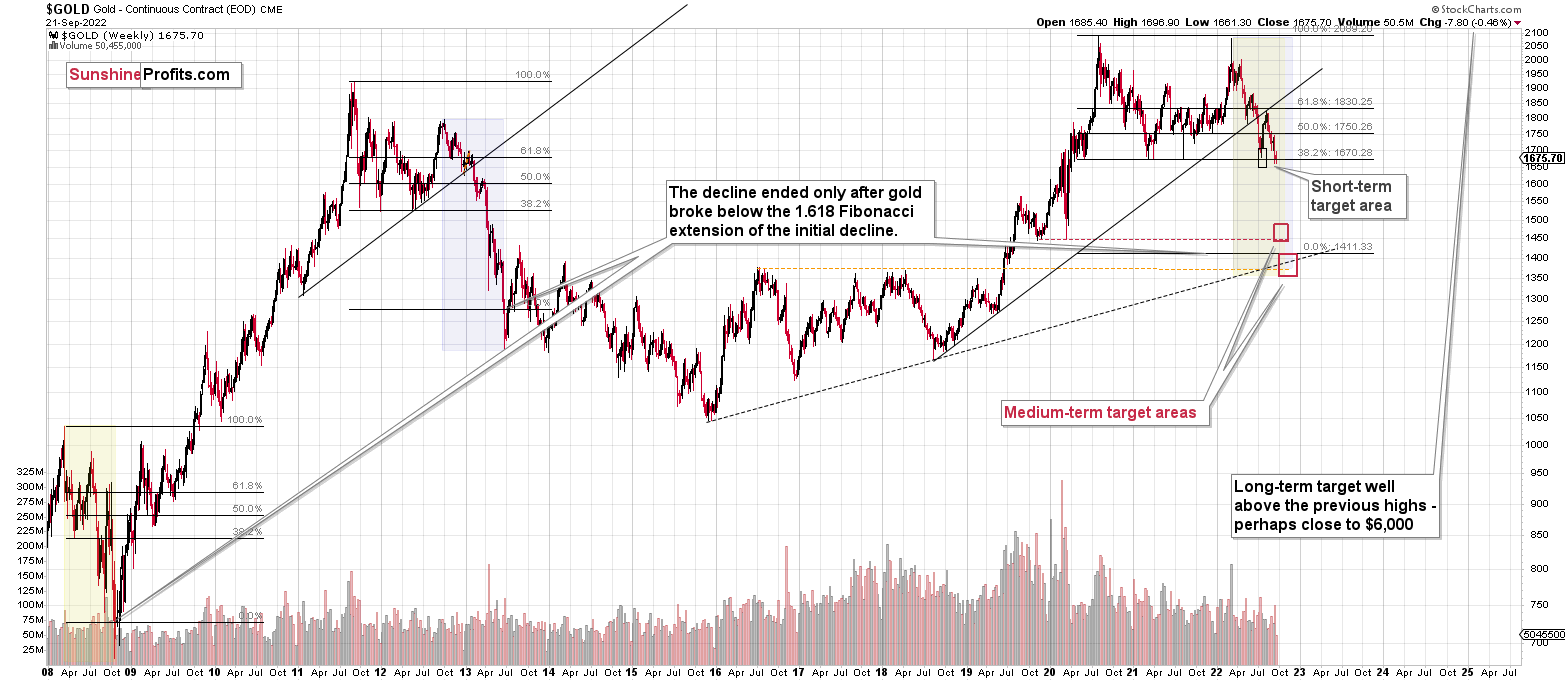
Please note that the above timing details are relatively broad and “for general overview only” – so that you know more or less what I think and how volatile I think the moves are likely to be – on an approximate basis. These time targets are not binding nor clear enough for me to think that they should be used for purchasing options, warrants, or similar instruments.
Summary
Summing up, it seems that the biggest part of the 2013-like decline is taking place right now, and – while I can’t make any promises regarding performance - it seems likely to me that our big profits are about to become huge, and then ridiculously big in the relatively near future.
Things might happen very fast in the coming days, and if I plan to make any adjustments, I’ll keep you informed. Still, if the targets that I’m mentioning in the “Trading” part of the summary are reached, I think that profits should be taken off the table without an additional confirmation from me. I will probably get on the long side of the market at that time, but I’ll send a confirmation if I decide to do so.
After the final sell-off (that takes gold to about $1,350-$1,500), I expect the precious metals to rally significantly. The final part of the decline might take as little as 1-5 weeks, so it's important to stay alert to any changes.
As always, we'll keep you – our subscribers – informed.
To summarize:
Trading capital (supplementary part of the portfolio; our opinion): Full speculative short positions (300% of the full position) in junior mining stocks are justified from the risk to reward point of view with the following binding exit profit-take price levels:
Mining stocks (price levels for the GDXJ ETF): binding profit-take exit price: $20.32; stop-loss: none (the volatility is too big to justify a stop-loss order in case of this particular trade)
Alternatively, if one seeks leverage, we’re providing the binding profit-take levels for the JDST (2x leveraged). The binding profit-take level for the JDST: $29.87; stop-loss for the JDST: none (the volatility is too big to justify a SL order in case of this particular trade).
For-your-information targets (our opinion; we continue to think that mining stocks are the preferred way of taking advantage of the upcoming price move, but if for whatever reason one wants / has to use silver or gold for this trade, we are providing the details anyway.):
Silver futures downside profit-take exit price: $12.32
SLV profit-take exit price: $11.32
ZSL profit-take exit price: $79.87
Gold futures downside profit-take exit price: $1,504
HGD.TO – alternative (Canadian) 2x inverse leveraged gold stocks ETF – the upside profit-take exit price: $19.87
HZD.TO – alternative (Canadian) 2x inverse leveraged silver ETF – the upside profit-take exit price: $49.87
Long-term capital (core part of the portfolio; our opinion): No positions (in other words: cash)
Insurance capital (core part of the portfolio; our opinion): Full position
Whether you’ve already subscribed or not, we encourage you to find out how to make the most of our alerts and read our replies to the most common alert-and-gold-trading-related-questions.
Please note that we describe the situation for the day that the alert is posted in the trading section. In other words, if we are writing about a speculative position, it means that it is up-to-date on the day it was posted. We are also featuring the initial target prices to decide whether keeping a position on a given day is in tune with your approach (some moves are too small for medium-term traders, and some might appear too big for day-traders).
Additionally, you might want to read why our stop-loss orders are usually relatively far from the current price.
Please note that a full position doesn't mean using all of the capital for a given trade. You will find details on our thoughts on gold portfolio structuring in the Key Insights section on our website.
As a reminder - "initial target price" means exactly that - an "initial" one. It's not a price level at which we suggest closing positions. If this becomes the case (as it did in the previous trade), we will refer to these levels as levels of exit orders (exactly as we've done previously). Stop-loss levels, however, are naturally not "initial", but something that, in our opinion, might be entered as an order.
Since it is impossible to synchronize target prices and stop-loss levels for all the ETFs and ETNs with the main markets that we provide these levels for (gold, silver and mining stocks - the GDX ETF), the stop-loss levels and target prices for other ETNs and ETF (among other: UGL, GLL, AGQ, ZSL, NUGT, DUST, JNUG, JDST) are provided as supplementary, and not as "final". This means that if a stop-loss or a target level is reached for any of the "additional instruments" (GLL for instance), but not for the "main instrument" (gold in this case), we will view positions in both gold and GLL as still open and the stop-loss for GLL would have to be moved lower. On the other hand, if gold moves to a stop-loss level but GLL doesn't, then we will view both positions (in gold and GLL) as closed. In other words, since it's not possible to be 100% certain that each related instrument moves to a given level when the underlying instrument does, we can't provide levels that would be binding. The levels that we do provide are our best estimate of the levels that will correspond to the levels in the underlying assets, but it will be the underlying assets that one will need to focus on regarding the signs pointing to closing a given position or keeping it open. We might adjust the levels in the "additional instruments" without adjusting the levels in the "main instruments", which will simply mean that we have improved our estimation of these levels, not that we changed our outlook on the markets. We are already working on a tool that would update these levels daily for the most popular ETFs, ETNs and individual mining stocks.
Our preferred ways to invest in and to trade gold along with the reasoning can be found in the how to buy gold section. Furthermore, our preferred ETFs and ETNs can be found in our Gold & Silver ETF Ranking.
As a reminder, Gold & Silver Trading Alerts are posted before or on each trading day (we usually post them before the opening bell, but we don't promise doing that each day). If there's anything urgent, we will send you an additional small alert before posting the main one.
Thank you.
Przemyslaw Radomski, CFA
Founder, Editor-in-chief

