

Briefly: in our opinion, full (300% of the regular position size) speculative short positions in junior mining stocks are justified from the risk/reward point of view at the moment of publishing this Alert.
Introduction
The S&P 500 continued its ascent on Oct. 24, as the index rallied by 1.19%; and while silver followed suit and jumped by 0.65%, gold declined by 0.13%, the GDX ETF by 1.68% and the GDXJ ETF by 1.98%.
In addition, the relative weakness was pronounced since the USD Index was roughly flat and the U.S. 10-Year real yield declined. As a result, with gold and mining stocks unable to gain any momentum when their adversaries struggled, their performances should worsen if (when) the USD Index and the U.S. 10-Year real yield resume their uptrends.
The PMs’ Plight
While the S&P 500 exuded optimism on Oct. 24, gold, silver and mining stocks were relative laggards. Moreover, with the GDXJ ETF declining by nearly 2%, I noted on Oct. 19 that the PMs can fall when the general stock market rises. I wrote:
While the S&P 500 confronts a bullish tactical setup, the PMs’ don’t need to follow in the index’s footsteps (…).
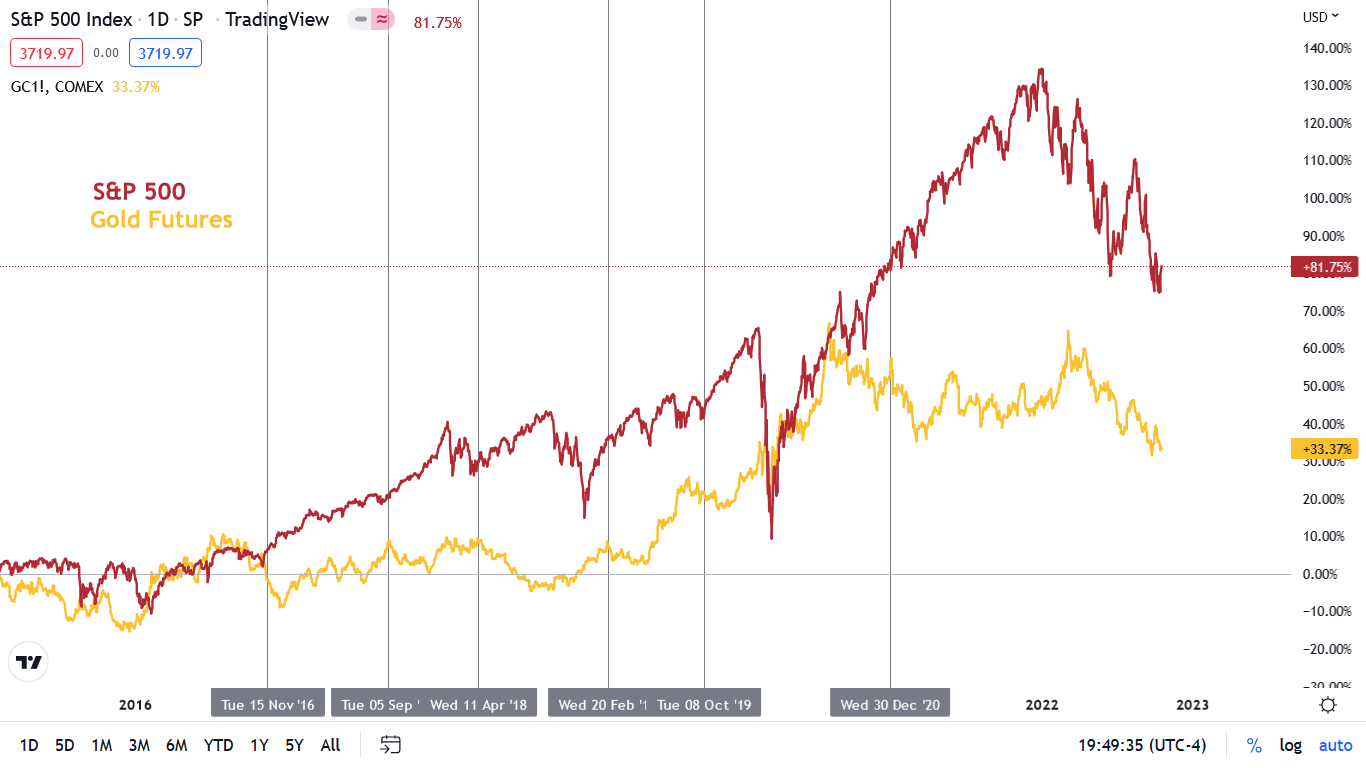
To explain, the vertical gray lines above depict periods where the S&P 500 rallied and the gold futures price declined. Therefore, while it would be helpful for the S&P 500 to fall, the index's plight is not necessary for the PMs to endure weakness.
All in all, positioning, sentiment and seasonality support a higher S&P 500, while the medium-term technicals and fundamentals are profoundly bearish. Thus, we consider any strength a bear market rally and expect the index to hit lower lows in the months ahead. However, since asset prices don't move in a straight line, the setup is tactically bullish.
So while the index rallied by more than 1% on Oct. 24, the positioning and sentiment extremes that fueled the S&P 500 are not present for gold.
For example, non-commercial (speculative) futures traders are significantly net short the S&P 500. Likewise, after they increased their net short exposure from ~164,000 contacts to ~223,000 contracts last week, their behavior encourages an S&P 500 short squeeze. As such, a small amount of optimism can push the index higher.
Please see below:
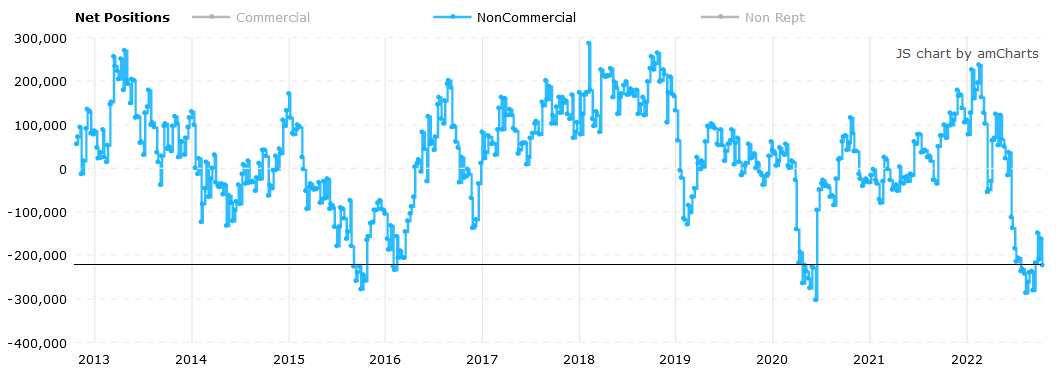 Source: Commitments of Traders (COT) report
To that point, I noted on Oct. 19 how investors attempt to front-run catalysts before they emerge. I wrote:
Corporations remain the largest buyers of U.S. equities, and with the buyback blackout period ending next week, it could provide further support for stocks. Furthermore, when you add large short bets by hedge funds and retail traders purchasing put options like there is no tomorrow, the positioning imbalance is relatively bullish for the S&P 500.
Moreover, with the bears becoming the consensus, expecting a lower S&P 500 in the short term is a crowded trade.
Please see below:
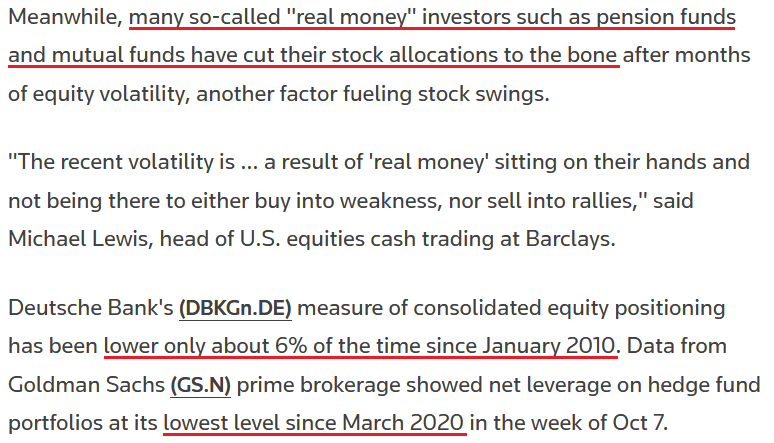 Source: Reuters
In stark contrast, speculators are net long gold; and while non-commercial futures traders reduced their net long exposure from ~94,000 contracts to ~77,000 contracts last week, the crowd is still bullish on the yellow metal. So the positioning ramifications are much different, and gold can’t rely on a short squeeze to propel it higher.
Please see below:
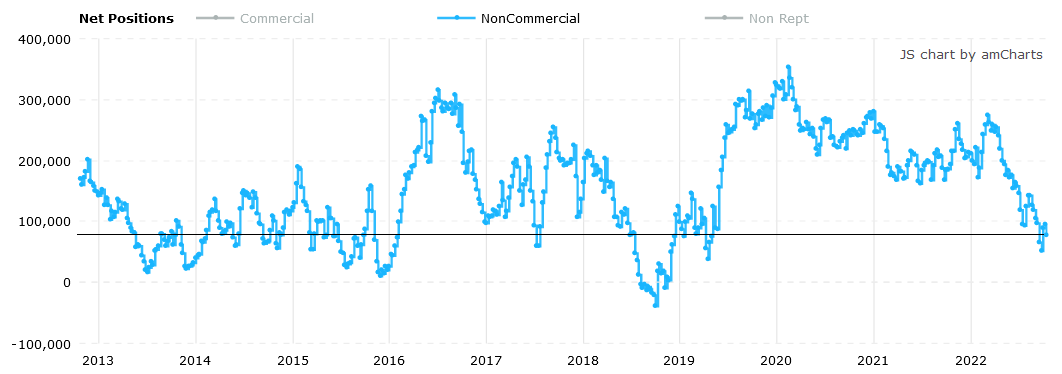 Source: COT report
Thus, while the S&P 500 could rise over the next few weeks, please remember that bear market rallies are a dime a dozen, and while the S&P 500 lost more than 50% of its value during the 2008 crisis, there were plenty of countertrend moves along the way.
Therefore, while the S&P 500’s short-term outlook is relatively bullish (though, it was more bullish at ~3,600), its medium-term outlook is profoundly bearish. As a result, it’s important to ignore the short-term sentiment and focus on the technical and fundamental developments that should occur in the months ahead.
In addition, the PMs underperformed the S&P 500 on Oct. 24, and their short-term outlooks are bearish for many reasons. As such, we still believe that shorting the GDXJ ETF offers an attractive risk-reward proposition.
Interest Rate Uncertainty
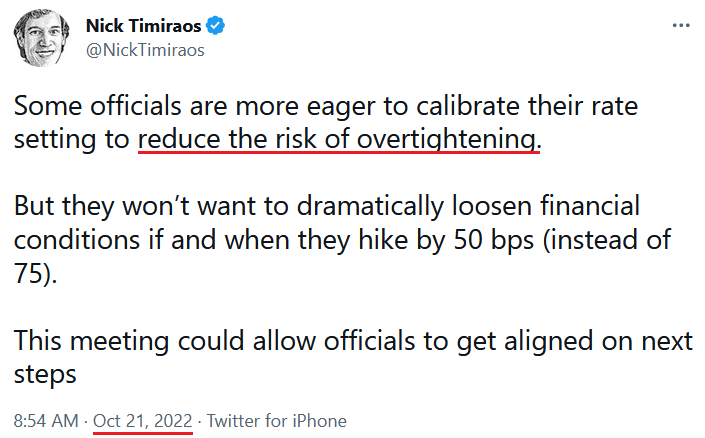
With the Wall Street Journal's (WSJ) Nick Timiraos noting on Oct. 21 that Fed officials are more open to smaller rate hikes during the fall and winter months, his not-so-subtle hint helped fuel the recent risk rally.
Please see below:
Moreover, while the S&P 500’s price action makes it seem like the revelation is something to celebrate, the reality is that the implications are profoundly hawkish. To explain, I wrote on Oct. 24:
The FFR is already at 3.25%, and a 75 basis point rate hike is likely a done deal on Nov. 3; and if the Fed hikes rates by 50 basis points in December, the FFR will end 2022 at 4.5%....
Thus, while our 4.5% FFR projection was in the major minority in August, it’s now the consensus; and with our upper estimate of 5.5% in 2023 still plausible, the pace of the Fed’s FFR increases implies nothing about its peak.
Furthermore, while investors hope that the worst is in the rearview, history shows that every inflation fight since 1954 has ended with a recession, and a higher FFR is only one part of a two-part story.
So while the medium-term implications are highly ominous, there are concerns that the short-term outlook has shifted. For example, a subscriber asked if the Fed doesn’t raise interest rates in December, is it bullish for the PMs?
Well, that outcome is bullish, and the PMs would likely rally. However, even Timiraos admitted the conversation is about “if and when they hike by 50 bps (instead of 75).” Therefore, the Fed wants to slow the pace of its rate hikes (which was always expected), not stop them altogether (no pivot).
Second, positioning is a critical component. I noted above that speculators are net long gold and net short the S&P 500; and S&P 500 shorts are encouraged to cover their positions on good news, which helps drive the index higher. Also, the positioning extremes encourage medium-term bears to flip short-term bullish.
Please see below:
 Source: Investing.com
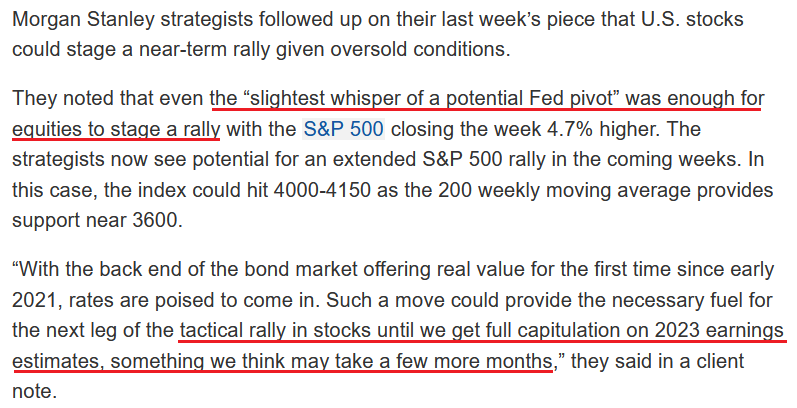
To explain, Morgan Stanley’s Chief U.S. Equity Strategist Mike Wilson has been a vocal bear in 2022. However, with a deceleration in bad news usually the catalyst to unwind crowded bets, short covering has a material impact on asset prices.
Yet, I noted above that speculators are net long gold, so the short-term calculus is much different. Conversely, if speculators were overwhelmingly net short gold like the S&P 500, the potential for a short squeeze would be concerning. However, that is not the case right now.
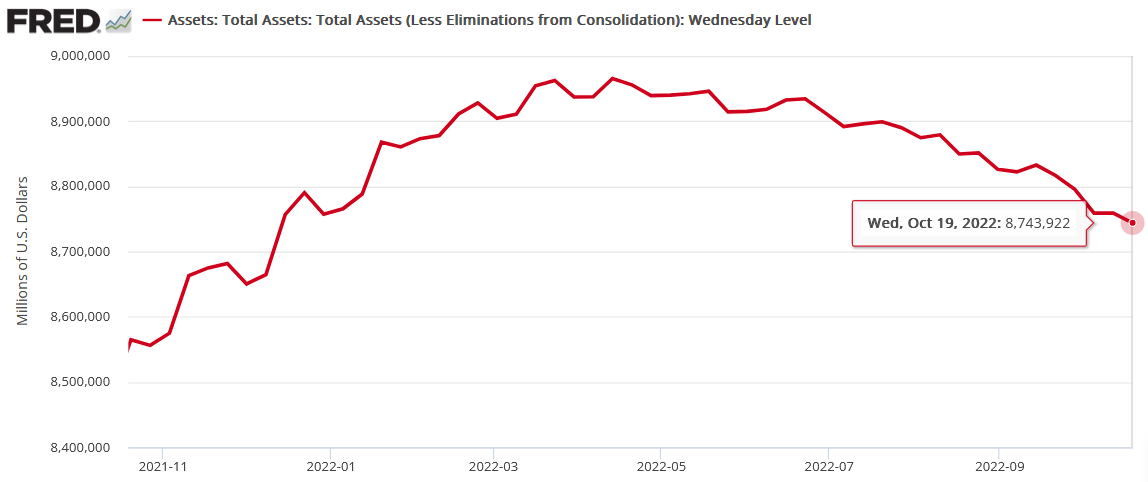
Third, while investors may cheer a 50 basis point rate hike in December, they’re forgetting about the impact of quantitative tightening (QT). With the Fed’s balance sheet hitting another 2022 low last week, the liquidity drain continues to intensify.
Moreover, with the Fed increasing Treasury bond supply, the behavior puts upward pressure on interest rates. As a result, while Wilson has been expecting lower interest rates for some time, bond buyers are few and far between when the Fed is no longer supporting the market.
Please see below:
As further evidence, the iShares 20+ Year Treasury Bond (TLT) ETF highlights the dynamic. With long-term bonds still reeling, fixed income investors are nowhere near as enthusiastic as the stock market bulls.
Please see below:
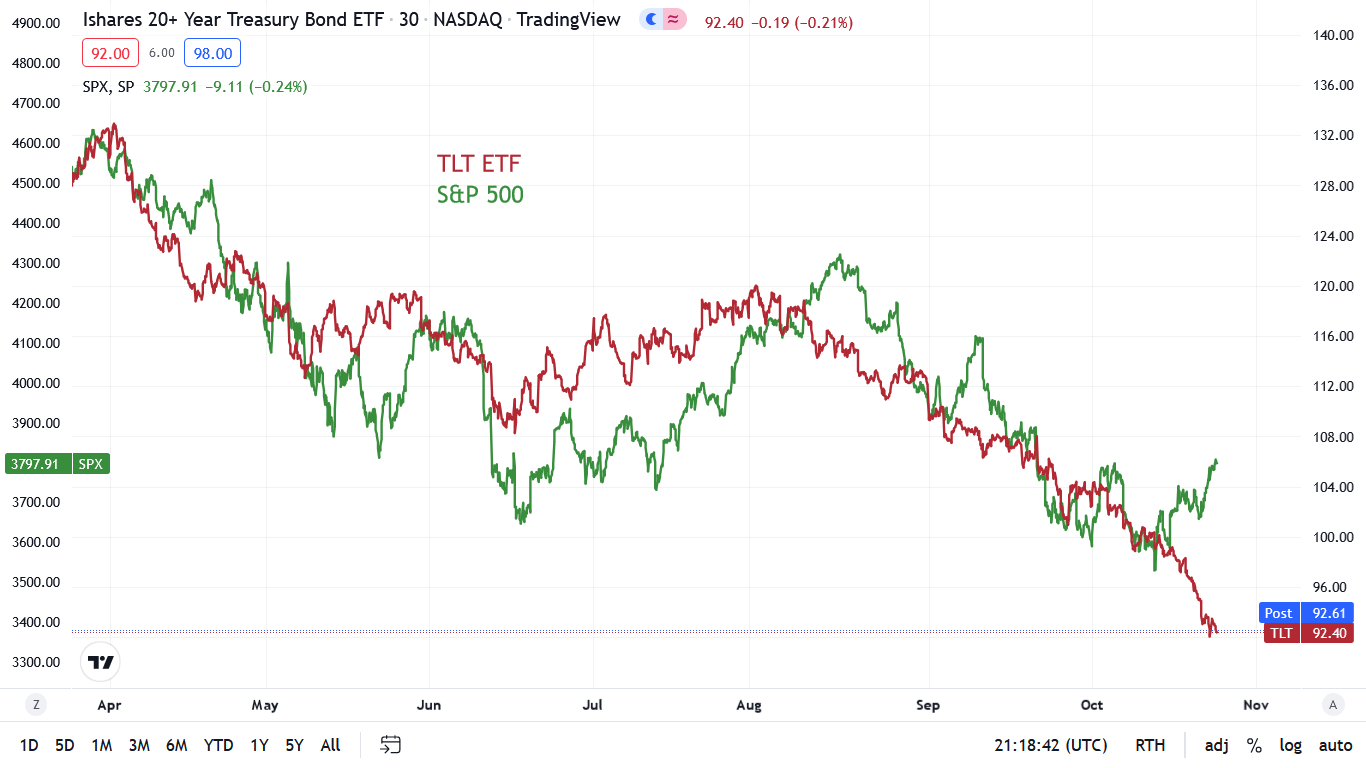
To explain, the red line above tracks the 30-minute movement of the TLT ETF, while the green line above tracks the 30-minute movement of the S&P 500. If you analyze the right side of the chart, you can see that a material divergence is present. Thus, as the TLT ETF falls (rates rise), the S&P 500 should also move lower. However, when S&P 500 sentiment and positioning are this bearish, a short-term decoupling can occur.
Conversely, with positioning a non-factor, gold's short-term outlook is much less optimistic.
Please see below:
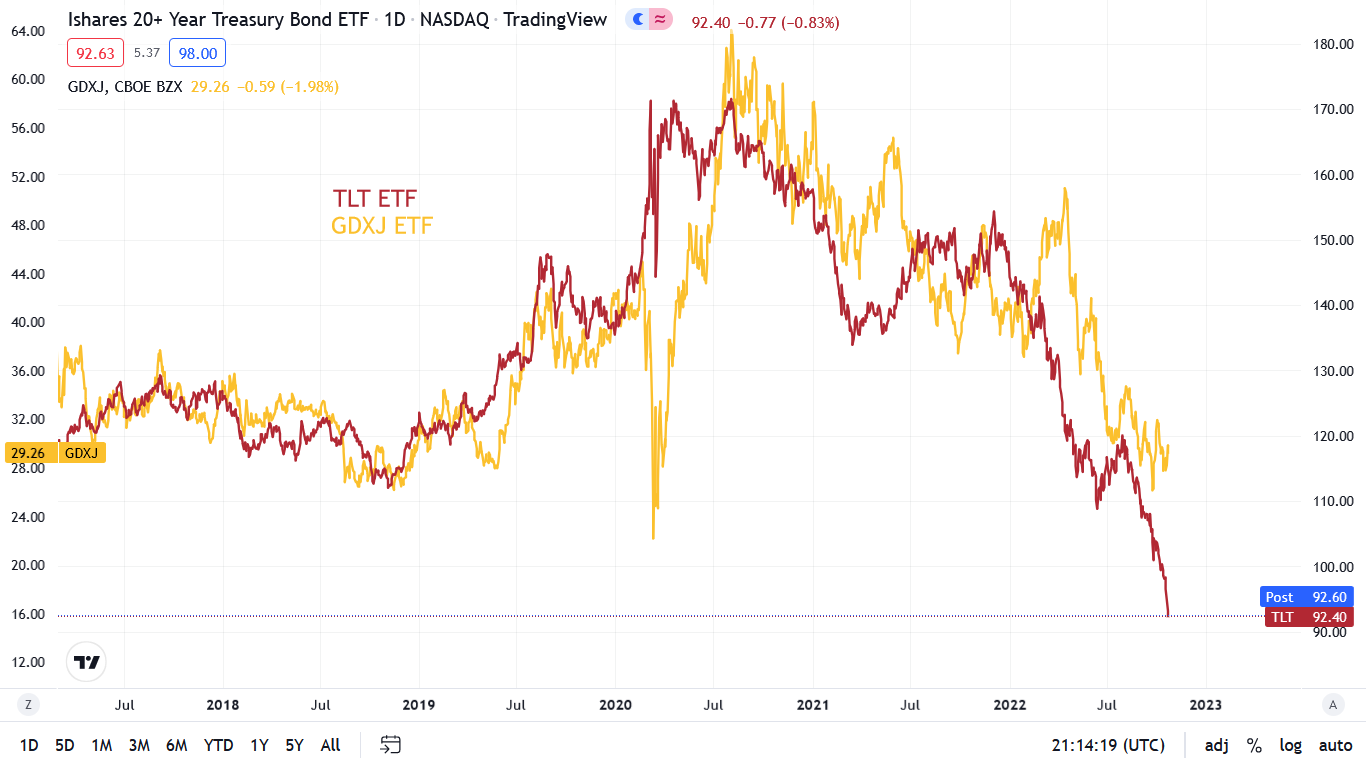
To explain, the red line above tracks the daily movement of the TLT ETF, while the gold line above tracks the daily movement of the GDXJ ETF. As you can see, the junior miners are not fans of higher long-term interest rates; and with the Fed’s QT program designed to increase long-term yields to combat inflation, the PMs’ short-term outlooks remain bearish.
The Bottom Line
While large intraday swings have become the norm, the S&P 500 is supported by a positioning imbalance that is not present with gold. So while the former may rally until investors become more neutral, the yellow metal doesn’t require the same kind of recalibration. As a result, the PMs have the potential to decline in both the short and medium term.
In conclusion, the PMs were mixed on Oct. 24, as silver ended the day in the green. However, gold and mining stocks struggled even as the S&P 500 rallied, the USD Index was roughly flat and the U.S. 10-Year real yield declined. Therefore, we believe the PMs confront more downside than upside risk in the weeks and months ahead.
Overview of the Upcoming Part of the Decline
- It seems to me that the corrective upswing is over, and that the next big move lower is already underway.
- If we see a situation where miners slide in a meaningful and volatile way while silver doesn’t (it just declines moderately), I plan to – once again – switch from short positions in miners to short positions in silver. At this time, it’s too early to say at what price levels this could take place and if we get this kind of opportunity at all – perhaps with gold prices close to $1,500-$1,550.
- I plan to switch from the short positions in junior mining stocks or silver (whichever I’ll have at that moment) to long positions in junior mining stocks when gold / mining stocks move to their 2020 lows (approximately). While I’m probably not going to write about it at this stage yet, this is when some investors might consider getting back in with their long-term investing capital (or perhaps 1/3 or 1/2 thereof).
- I plan to return to short positions in junior mining stocks after a rebound – and the rebound could take gold from about $1,450 to about $1,550, and it could take the GDXJ from about $20 to about $24.
- I plan to exit all remaining short positions once gold shows substantial strength relative to the USD Index while the latter is still rallying. This may be the case with gold prices close to $1,400 and GDXJ close to $15 . This moment (when gold performs very strongly against the rallying USD and miners are strong relative to gold after its substantial decline) is likely to be the best entry point for long-term investments, in my view. This can also happen with gold close to $1,400, but at the moment it’s too early to say with certainty.
- The above is based on the information available today, and it might change in the following days/weeks.
You will find my general overview of the outlook for gold on the chart below:
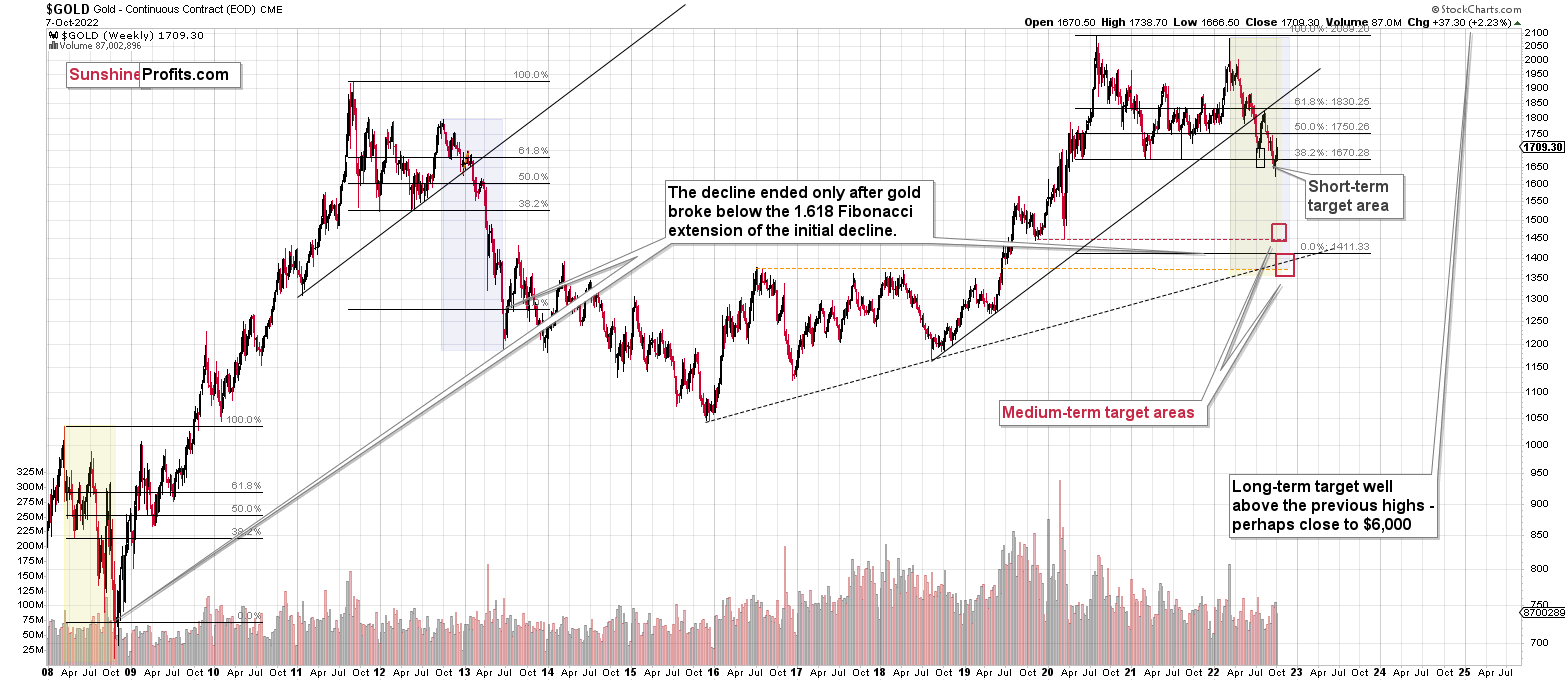
Please note that the above timing details are relatively broad and “for general overview only” – so that you know more or less what I think and how volatile I think the moves are likely to be – on an approximate basis. These time targets are not binding nor clear enough for me to think that they should be used for purchasing options, warrants, or similar instruments.
Summary
Summing up, it seems that the biggest part of the 2013-like decline is taking place right now, and – while I can’t make any promises regarding performance - it seems likely to me that our big profits are about to become huge, and then ridiculously big in the relatively near future.
As far as this quick corrective upswing is concerned, it seems that it might already be over.
The current quick upswing most likely doesn’t change anything. Fundamentals and technicals continue to point to lower precious metals values in the coming weeks / months. The current geopolitical news-based rally is likely to serve as nothing more than just a verification of the breakdown below the previous lows in gold.
Things might happen very fast in the coming days, and if I plan to make any adjustments, I’ll keep you informed. Still, if the targets that I’m mentioning in the “Trading” part of the summary are reached, I think that profits should be taken off the table without an additional confirmation from me. I will probably get on the long side of the market at that time, but I’ll send a confirmation if I decide to do so.
After the final sell-off (that takes gold to about $1,350-$1,500), I expect the precious metals to rally significantly. The final part of the decline might take as little as 1-5 weeks, so it's important to stay alert to any changes.
As always, we'll keep you – our subscribers – informed.
To summarize:
Trading capital (supplementary part of the portfolio; our opinion): Full speculative short positions (300% of the full position) in junior mining stocks are justified from the risk to reward point of view with the following binding exit profit-take price levels:
Mining stocks (price levels for the GDXJ ETF): binding profit-take exit price: $20.32; stop-loss: none (the volatility is too big to justify a stop-loss order in case of this particular trade)
Alternatively, if one seeks leverage, we’re providing the binding profit-take levels for the JDST (2x leveraged). The binding profit-take level for the JDST: $27.87; stop-loss for the JDST: none (the volatility is too big to justify a SL order in case of this particular trade).
For-your-information targets (our opinion; we continue to think that mining stocks are the preferred way of taking advantage of the upcoming price move, but if for whatever reason one wants / has to use silver or gold for this trade, we are providing the details anyway.):
Silver futures downside profit-take exit price: $12.32
SLV profit-take exit price: $11.32
ZSL profit-take exit price: $74.87
Gold futures downside profit-take exit price: $1,504
HGD.TO – alternative (Canadian) 2x inverse leveraged gold stocks ETF – the upside profit-take exit price: $18.47
HZD.TO – alternative (Canadian) 2x inverse leveraged silver ETF – the upside profit-take exit price: $46.87
Long-term capital (core part of the portfolio; our opinion): No positions (in other words: cash)
Insurance capital (core part of the portfolio; our opinion): Full position
Whether you’ve already subscribed or not, we encourage you to find out how to make the most of our alerts and read our replies to the most common alert-and-gold-trading-related-questions.
Please note that we describe the situation for the day that the alert is posted in the trading section. In other words, if we are writing about a speculative position, it means that it is up-to-date on the day it was posted. We are also featuring the initial target prices to decide whether keeping a position on a given day is in tune with your approach (some moves are too small for medium-term traders, and some might appear too big for day-traders).
Additionally, you might want to read why our stop-loss orders are usually relatively far from the current price.
Please note that a full position doesn't mean using all of the capital for a given trade. You will find details on our thoughts on gold portfolio structuring in the Key Insights section on our website.
As a reminder - "initial target price" means exactly that - an "initial" one. It's not a price level at which we suggest closing positions. If this becomes the case (as it did in the previous trade), we will refer to these levels as levels of exit orders (exactly as we've done previously). Stop-loss levels, however, are naturally not "initial", but something that, in our opinion, might be entered as an order.
Since it is impossible to synchronize target prices and stop-loss levels for all the ETFs and ETNs with the main markets that we provide these levels for (gold, silver and mining stocks - the GDX ETF), the stop-loss levels and target prices for other ETNs and ETF (among other: UGL, GLL, AGQ, ZSL, NUGT, DUST, JNUG, JDST) are provided as supplementary, and not as "final". This means that if a stop-loss or a target level is reached for any of the "additional instruments" (GLL for instance), but not for the "main instrument" (gold in this case), we will view positions in both gold and GLL as still open and the stop-loss for GLL would have to be moved lower. On the other hand, if gold moves to a stop-loss level but GLL doesn't, then we will view both positions (in gold and GLL) as closed. In other words, since it's not possible to be 100% certain that each related instrument moves to a given level when the underlying instrument does, we can't provide levels that would be binding. The levels that we do provide are our best estimate of the levels that will correspond to the levels in the underlying assets, but it will be the underlying assets that one will need to focus on regarding the signs pointing to closing a given position or keeping it open. We might adjust the levels in the "additional instruments" without adjusting the levels in the "main instruments", which will simply mean that we have improved our estimation of these levels, not that we changed our outlook on the markets. We are already working on a tool that would update these levels daily for the most popular ETFs, ETNs and individual mining stocks.
Our preferred ways to invest in and to trade gold along with the reasoning can be found in the how to buy gold section. Furthermore, our preferred ETFs and ETNs can be found in our Gold & Silver ETF Ranking.
As a reminder, Gold & Silver Trading Alerts are posted before or on each trading day (we usually post them before the opening bell, but we don't promise doing that each day). If there's anything urgent, we will send you an additional small alert before posting the main one.
Thank you.
Przemyslaw K. Radomski, CFA
Founder, Editor-in-chief

