

Briefly: in our opinion, full (300% of the regular position size) speculative short positions in junior mining stocks are justified from the risk/reward point of view at the moment of publishing this Alert.
Gold, silver, and miners all declined heavily on Friday, and the medium-term decline appears to be back.
This means that practically everything that I wrote previously has either already become a reality or remains up-to-date as a forecast. Consequently, the technical part of today’s analysis will be rather brief – I have very little new to add to Friday’s big analysis.
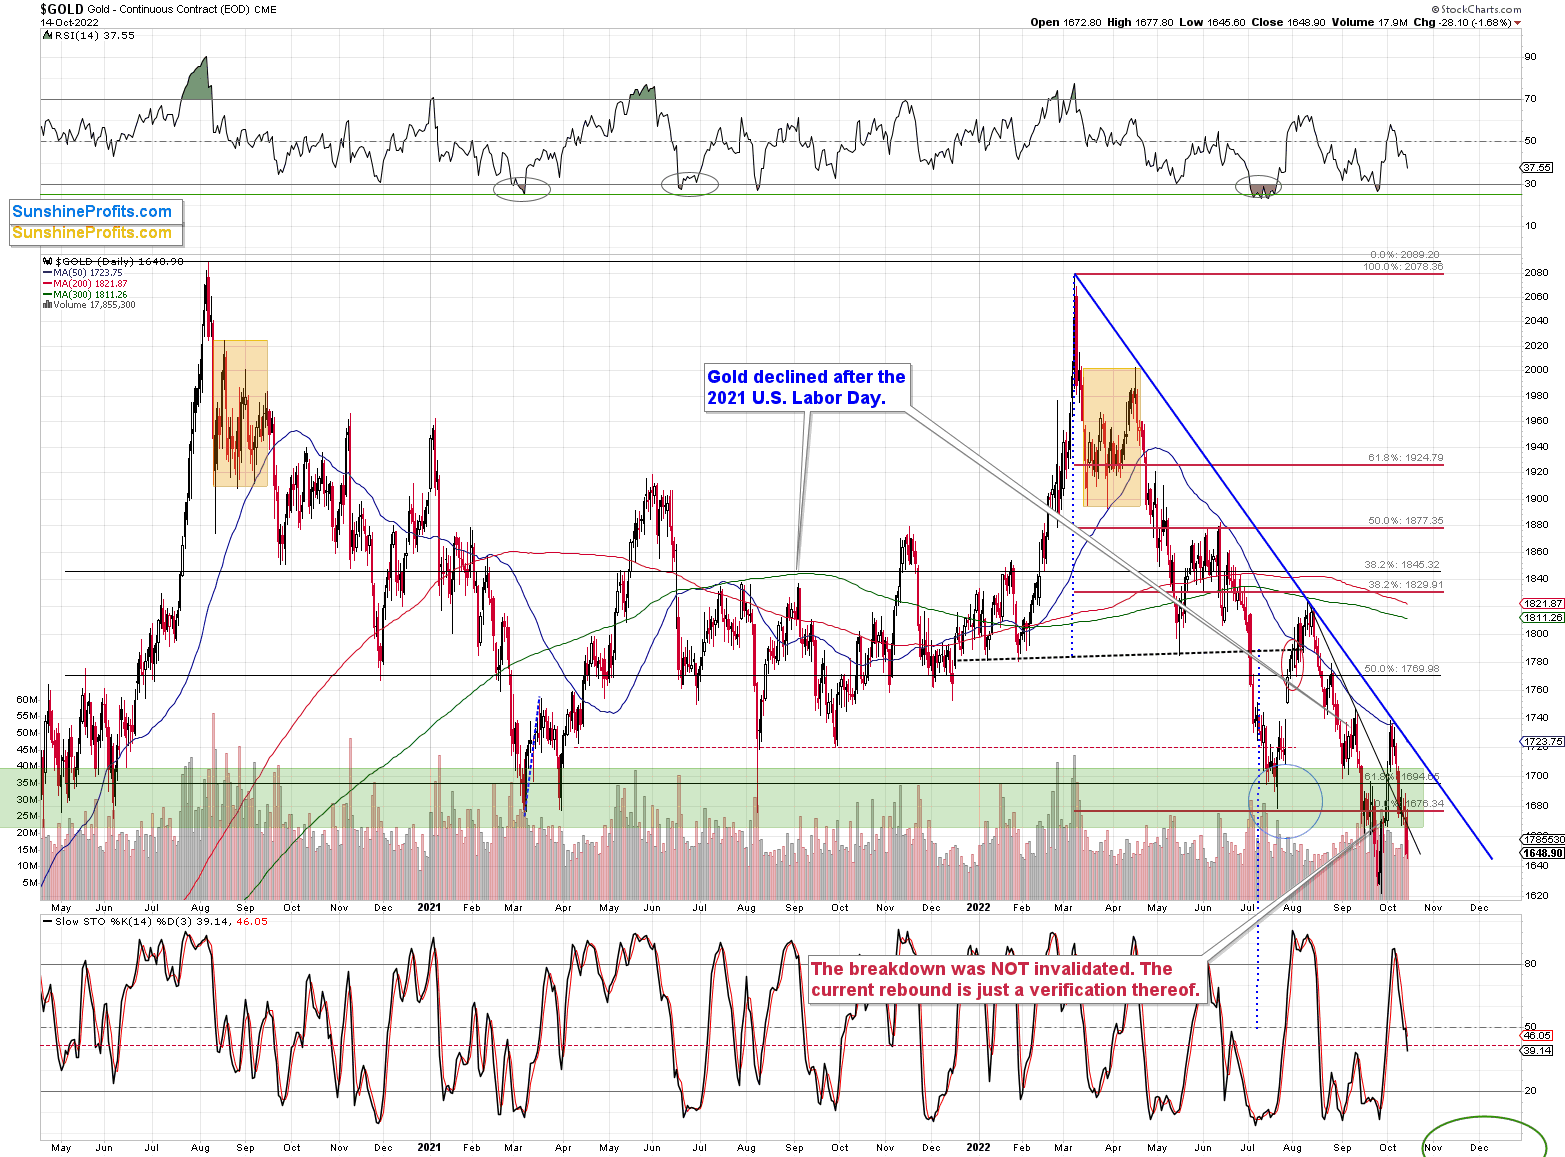
Gold is down, and it’s once again visibly below the green support area. Even though gold moved very briefly above it, one can say that overall, this area worked as resistance.
This means that gold can, and is now likely to fall further.
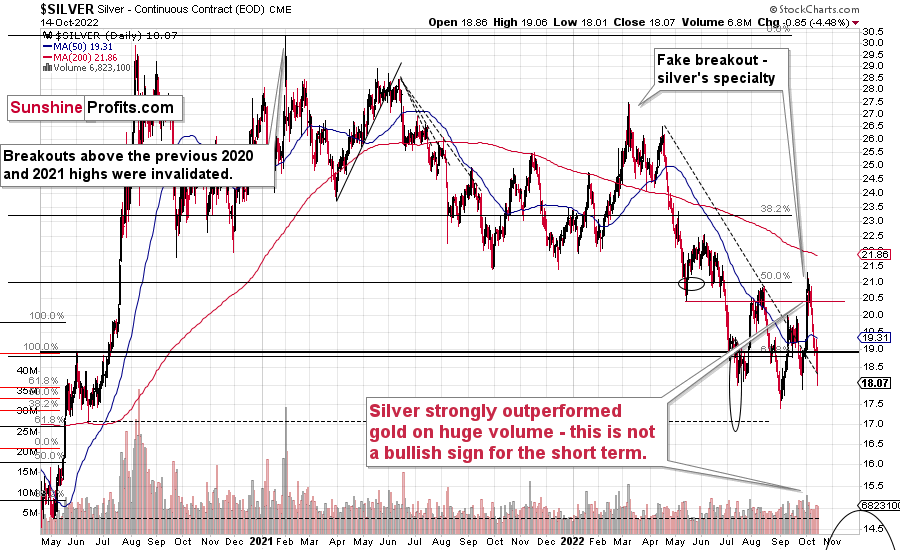
Just like gold, silver declined strongly, and permabulls’ dream of silver’s immediate comeback appears to have been crushed. Last week’s close was the second lowest weekly close that we have seen this year.
The back-and-forth trading pattern that started in July could be viewed as a flag pattern, and the moves that follow flags (which is a continuation pattern on its own) tend to be similar to the moves that preceded them.
In this case, the move that preceded the pattern was a big ~$10 decline, so it seems that silver is about to slide profoundly. It might not be a $10 move lower in this case, as the moves could be similar in percentage terms but not in dollar terms. Still, silver is likely to fall significantly before it bottoms.
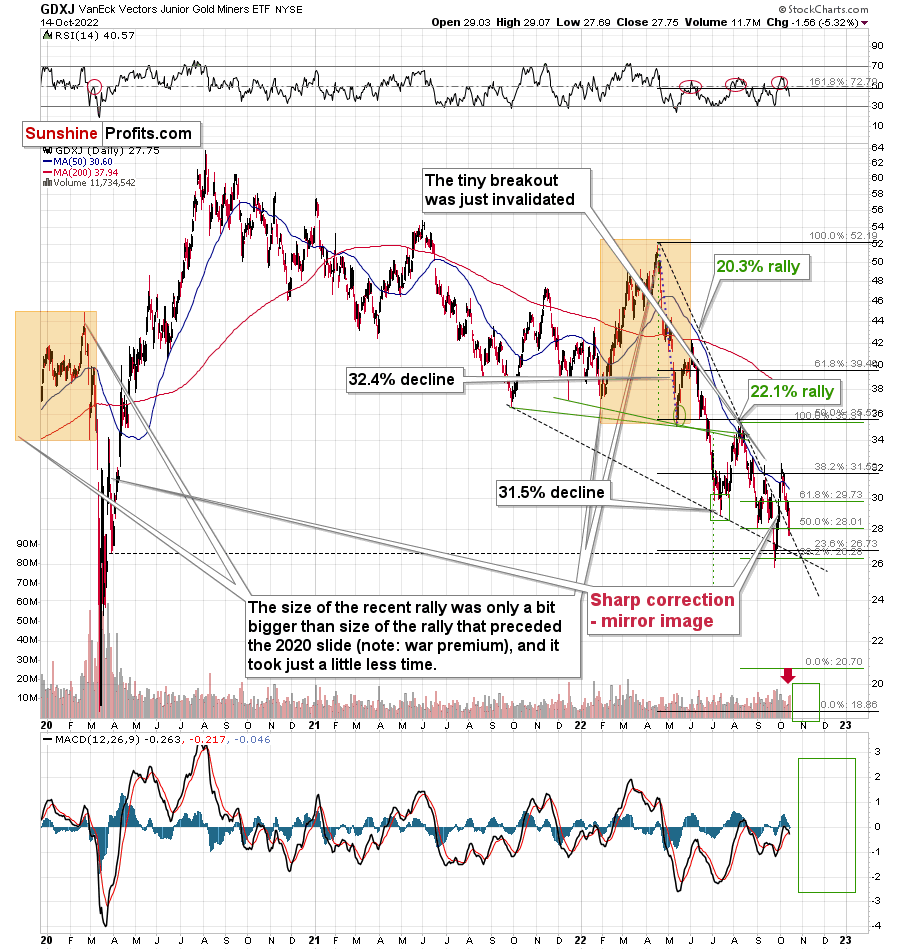
The decline in junior miners is clearly visible as well, and now there’s little doubt about the fake nature of the recent upswing.
The GDXJ ETF is not yet at new yearly lows, but it seems likely that when it moves to new lows (which means a breakdown below the support at about $26), it will decline very fast.
The reason is the lack of strong support between $26 and the 2020 low that’s just below $20.
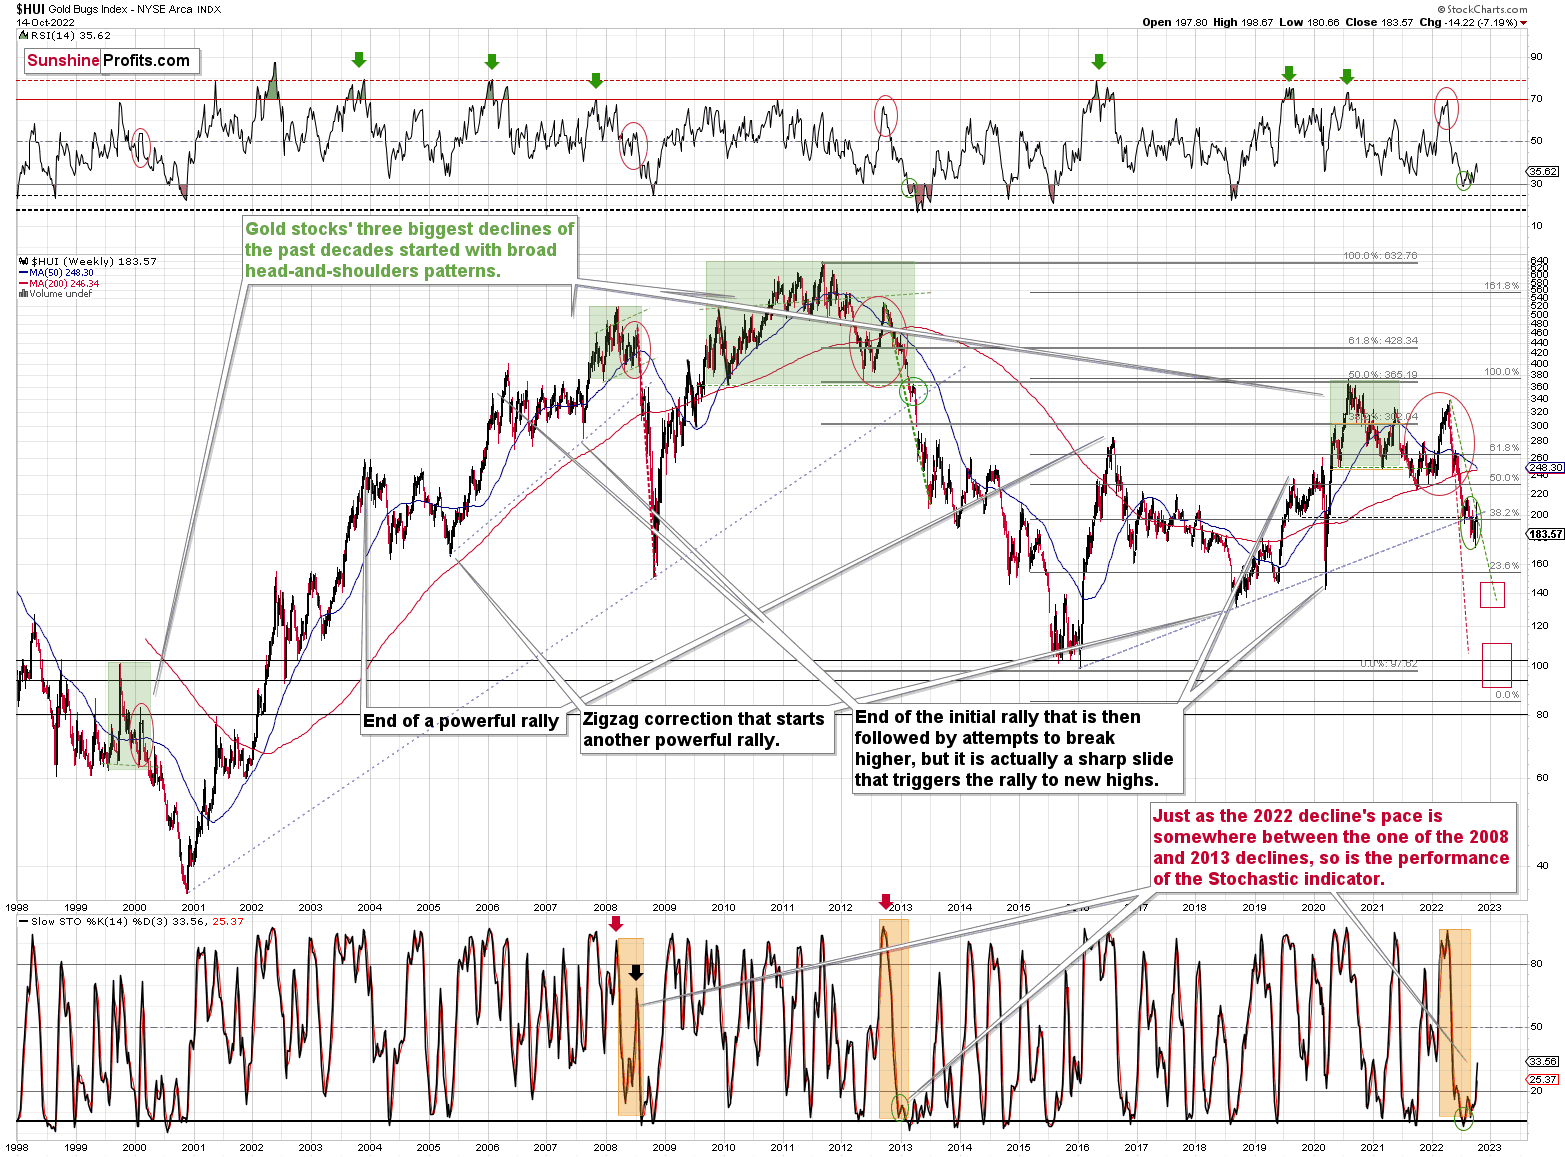
From the long-term point of view, it’s crystal-clear that gold stocks broke below the rising medium-term support line and they verified this breakdown.
After the same thing happened in 2008 and 2013, a huge decline followed.
The implications are extremely bearish, and while I can’t promise anything regarding performance, it seems that profits on our short position in junior miners will increase substantially.
Having said that, let’s take a look at the markets from a more fundamental point of view.
Higher Highs
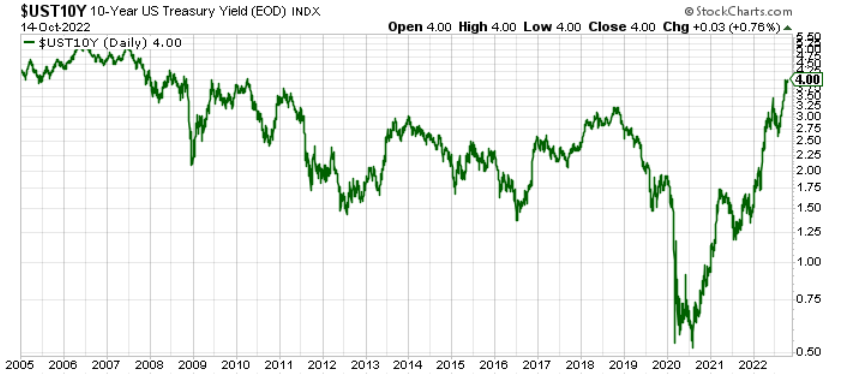
With gold, silver, mining stocks and the S&P 500 selling off on Oct. 14, hawkish realities continue to weigh on risk assets. Moreover, after the U.S. 10-Year Treasury yield closed at a decade-plus high of 4%, interest rates remain highly problematic.
Please see below:
Likewise, while investors assumed that unanchored inflation would abate with little effort, the fairytale has suffered a tragic ending. For example, the futures market is pricing in a peak U.S. federal funds rate (FFR) of ~4.97% in April/May 2023.
Please see below:
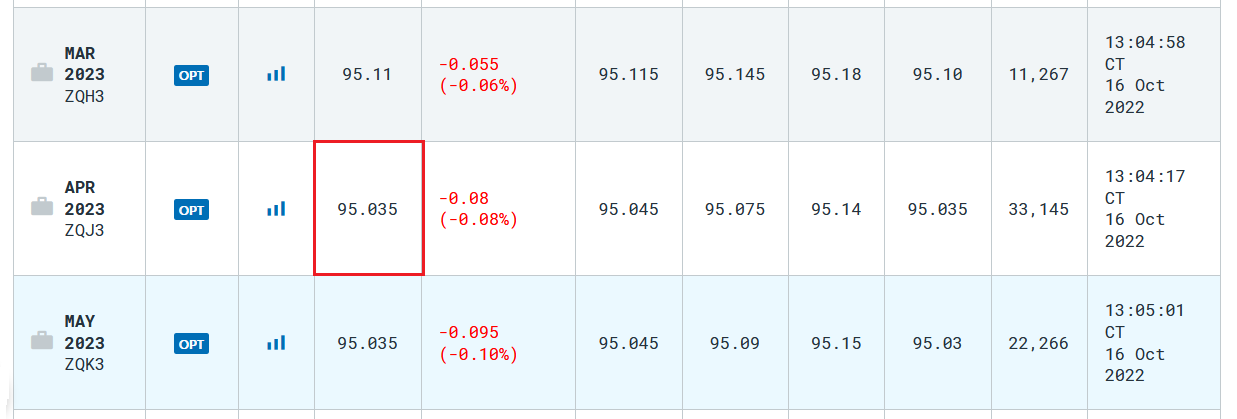 Source: CME Group
To explain, the implied FFR is calculated by subtracting the last price from 100, which equates to ~4.97% in 2023. Furthermore, expectations have risen by more than 65 basis points in one month. I wrote on Sep. 14:
With the consensus now pricing in a peak FFR of 4.31% by the end of April 2023, the metric is approaching the 4.5% to 5.5% range that we expect in 2023.
Please see below:
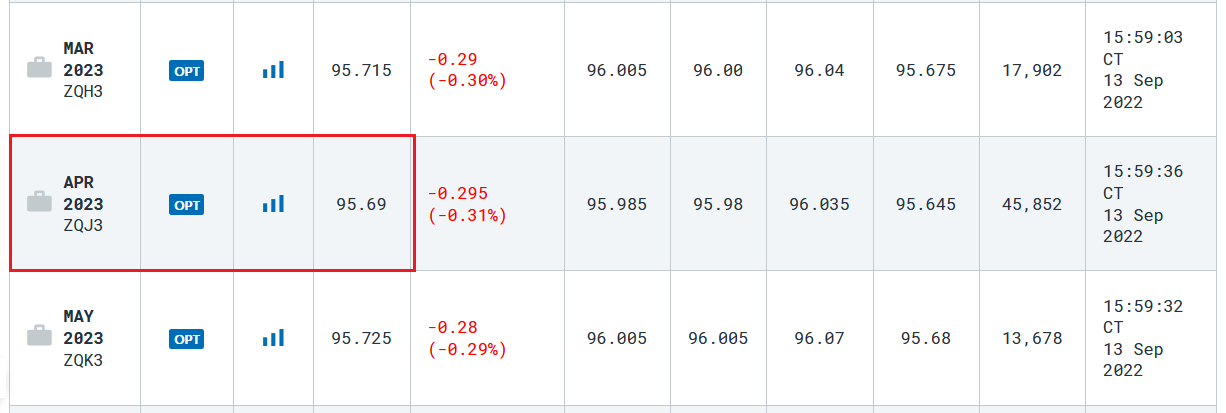 Source: CME Group
In addition, I warned on Aug. 1 that investors’ prior rate hike expectations were out of touch with reality. I wrote:
While the consensus assumes the Fed is near the end of its rate hike cycle, the Consumer Price Index (CPI) is on the fast track to 2% and a 3% FFR will be enough to capsize inflation, market participants are living in fantasy land.
For example, I’ve warned on numerous occasions that demand is much stronger than the consensus realizes. With Americans’ checking account balances at unprecedented all-time highs and the Atlanta Fed’s wage growth tracker hitting an all-time high in June, the FFR needs to go meaningfully above 3%. To explain, I wrote on Jul. 25:
With more earnings calls showcasing how the situation continues to worsen, market participants don’t realize that the U.S. federal funds rate needs to hit ~4.5% or more for the Fed to materially reduce inflation. For context, the consensus expects a figure in the 2.5% to 3.5% range.
Thus, with hawkish expectations ratcheting higher, the development is profoundly bearish for gold, silver, mining stocks and the S&P 500; and with central bankers upping the ante on Oct. 14, their outlooks remain ominous in the months ahead.
San Francisco Fed President Mary Daly said on Oct. 14:
The CPI release “was a very disappointing report, but I would offer it wasn't that surprising. We would hope that inflation would start to come down faster, but I was prepared for it to just be sluggish.”
She added:
“We are a data-dependent Fed, and if more is necessary, we'll take it. If less is necessary, we'll adjust. But we're not talking about, at this point... pausing or stopping, nor are we talking about changing our overall strategy, because the data are coming in about like we would expect.”
As a result, Daly reiterated her commitment to achieving our FFR target in 2023.
Please see below:
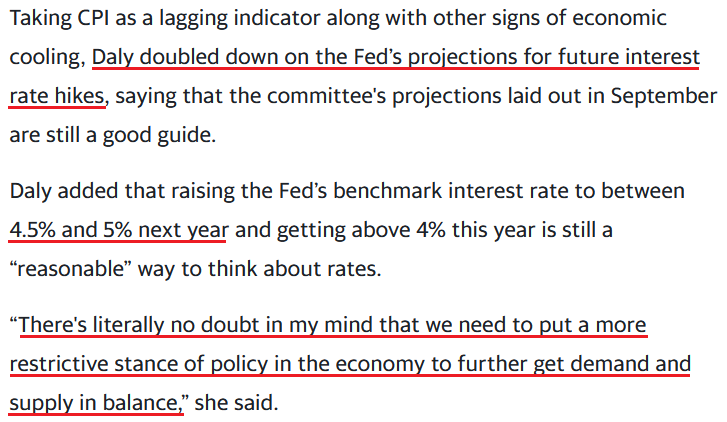 Source: Yahoo Finance
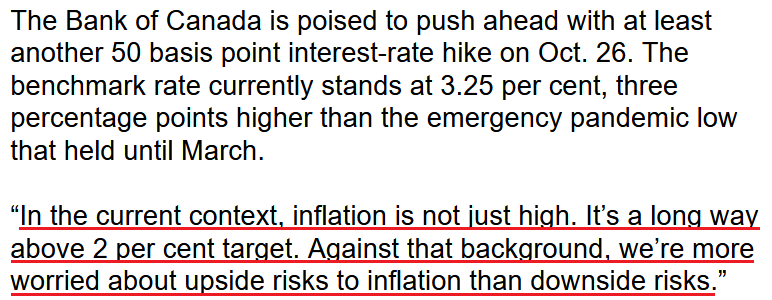
In addition, I've noted on numerous occasions how the Bank of Canada (BoC) and the Fed are often joined at the monetary hip; and with BoC Governor Tiff Macklem (Canada's Jerome Powell) warning of a higher overnight lending rate in the months ahead, risk assets should suffer as the liquidity drain unfolds. He said:
“We’ve seen the last couple of month’s total CPI inflation has come down about a percentage point. But measures of core inflation, measures of underlying inflation, are becoming increasingly relevant. We have yet to see a clear turning point in underlying inflation. Inflation continues to broaden across goods and services.”
He added:
“Growth needs to slow. We need growth below potential, below trend for a period so that supply can catch up and we can take the steam out of inflation. Saying growth needs to slow doesn’t imply that we need a big period of negative growth. We’ll certainly need considerably lower growth.”
As such, with North American central banks warning of higher interest rates and weaker economic activity, the PMs are unlikely to perform well amid restrictive monetary policy.
Please see below:
 Source: Bloomberg
Economic Data Remains Resilient
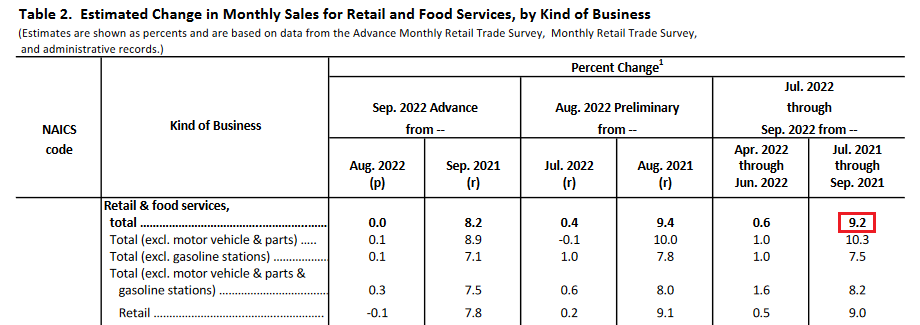
The U.S. Census Bureau released its monthly retail sales report on Oct. 14. An excerpt read:
“Advance estimates of U.S. retail and food services sales for September 2022, adjusted for seasonal variation and holiday and trading-day differences, but not for price changes, were $684.0 billion, virtually unchanged (±0.5 percent)* from the previous month, but 8.2 percent (±0.7 percent) above September 2021.”
“Total sales for the July 2022 through September 2022 period were up 9.2 percent (±0.5 percent) from the same period a year ago. The July 2022 to August 2022 percent change was revised from up 0.3% (±0.5 percent)* to up 0.4 percent (±0.2 percent).”
Thus, while retail sales were basically flat month-over-month (MoM) in September, they still rose by 8.2% year-over-year (YoY). In addition, August’s data was revised upward from 0.3% MoM to 0.4% MoM. Furthermore, with three-month retail and food services purchases up by 9.2% YoY, Americans are spending much more than they did in 2021.
Please see below:
 Source: U.S. Census Bureau
As further evidence, the data aligns with Mastercard’s SpendingPulse U.S. retail sales report released on Oct. 7:
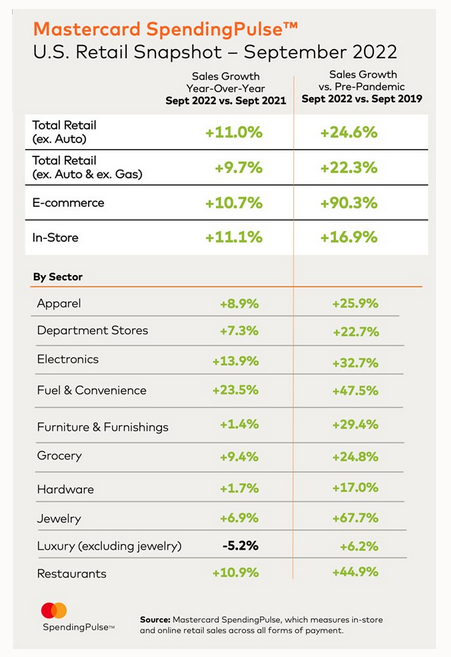
Therefore, while the crowd hopes that demand destruction will allow for a dovish pivot, the reality is that American consumers have the means to keep inflation uplifted. Moreover, with the U.S. labor market still on solid footing and wage inflation well above its pre-pandemic norm, the Fed’s 12 to 25 basis point rate hikes in 2022 have done little to curb demand (outside of the housing market). Thus, the supply-side enthusiasts are slowly realizing that demand is why inflation won’t subside.
Also noteworthy, the Atlanta Fed updated its third-quarter real GDP growth projection on Oct. 14. The report stated:
“The GDPNow model estimate for real GDP growth (seasonally adjusted annual rate) in the third quarter of 2022 is 2.8 percent on October 14, down from 2.9 percent on October 7. After recent releases from the US Bureau of Labor Statistics and the US Census Bureau, the nowcast of third-quarter real personal consumption expenditures growth decreased from 1.3 percent to 1.2 percent.”
So while the projection declined by an immaterial 0.1%, prospective economic growth remains resilient, and a realization is bullish for the FFR, real yields, and the USD Index.
Please see below:
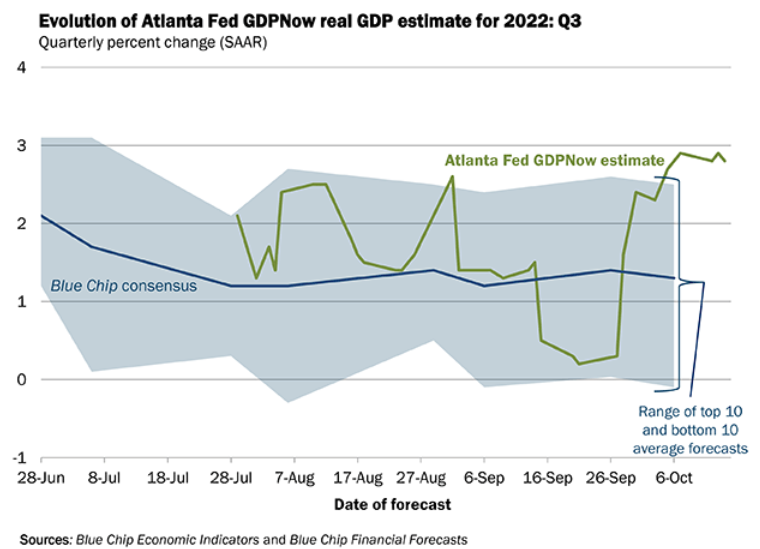
To explain, the blue line above tracks the Blue Chip consensus estimate (investment banks), while the green line above tracks the Atlanta Fed’s projection. If you analyze the right side of the chart, you can see that the green line is near its highs, and the forecast supports higher interest rates and should only embolden the Fed to continue its hawkish policy.
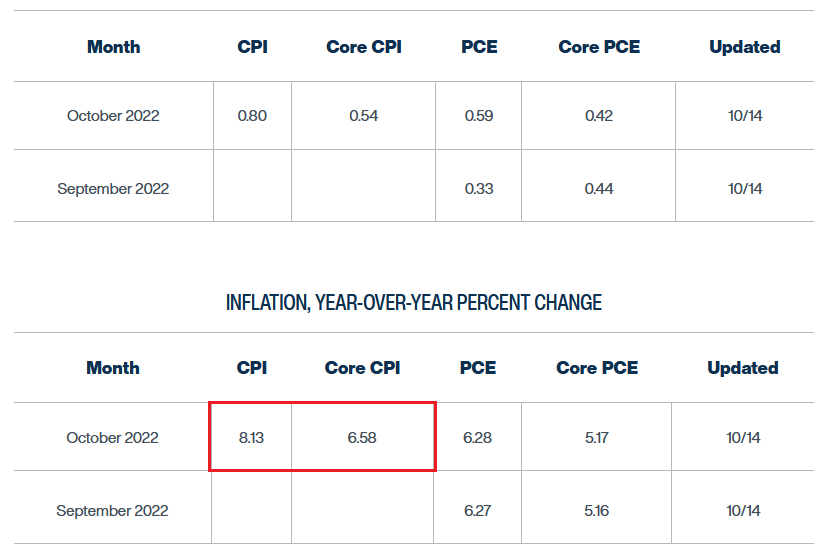
Finally, the Cleveland Fed updated its inflation nowcast projections on Oct. 14; and with the headline and core CPIs’ expected to hit 8.13% and 6.58% YoY in October, a realization would mark the eighth-straight month the former eclipsed 8% YoY. As a result, the data supports a much higher FFR and the PMs should suffer as the Fed’s inflation fight continues.
 Source: Cleveland Fed
The Bottom Line
With risk assets declining markedly on Oct. 14, reality returned to the financial markets. Moreover, with investors’ rate hike expectations increasing sharply and U.S. Treasury yields hitting new 2022 highs across the curve, the realities of unanchored inflation have come to bear. Thus, while oversold conditions and depressed sentiment can help induce a short-term reprieve, gold, silver, mining stocks and the S&P 500 should hit lower lows in the months ahead.
In conclusion, the PMs declined on Oct. 14, as many assets suffered profound drawdowns; and with the USD Index rallying sharply, the dollar basket should hit new highs over the medium term. Likewise, while the U.S. 10-Year real yield was roughly flat due to the rise in the U.S. 10-Year breakeven inflation rate, it should also seek higher ground during the fall and winter months. Therefore, the PMs’ medium-term outlooks remain highly bearish.
Overview of the Upcoming Part of the Decline
- It seems to me that the corrective upswing is over, and that the next big move lower is already underway.
- If we see a situation where miners slide in a meaningful and volatile way while silver doesn’t (it just declines moderately), I plan to – once again – switch from short positions in miners to short positions in silver. At this time, it’s too early to say at what price levels this could take place and if we get this kind of opportunity at all – perhaps with gold prices close to $1,600.
- I plan to switch from the short positions in junior mining stocks or silver (whichever I’ll have at that moment) to long positions in junior mining stocks when gold / mining stocks move to their 2020 lows (approximately). While I’m probably not going to write about it at this stage yet, this is when some investors might consider getting back in with their long-term investing capital (or perhaps 1/3 or 1/2 thereof).
- I plan to return to short positions in junior mining stocks after a rebound – and the rebound could take gold from about $1,450 to about $1,550, and it could take the GDXJ from about $20 to about $24.
- I plan to exit all remaining short positions once gold shows substantial strength relative to the USD Index while the latter is still rallying. This may be the case with gold prices close to $1,400 and GDXJ close to $15 . This moment (when gold performs very strongly against the rallying USD and miners are strong relative to gold after its substantial decline) is likely to be the best entry point for long-term investments, in my view. This can also happen with gold close to $1,400, but at the moment it’s too early to say with certainty.
- The above is based on the information available today, and it might change in the following days/weeks.
You will find my general overview of the outlook for gold on the chart below:
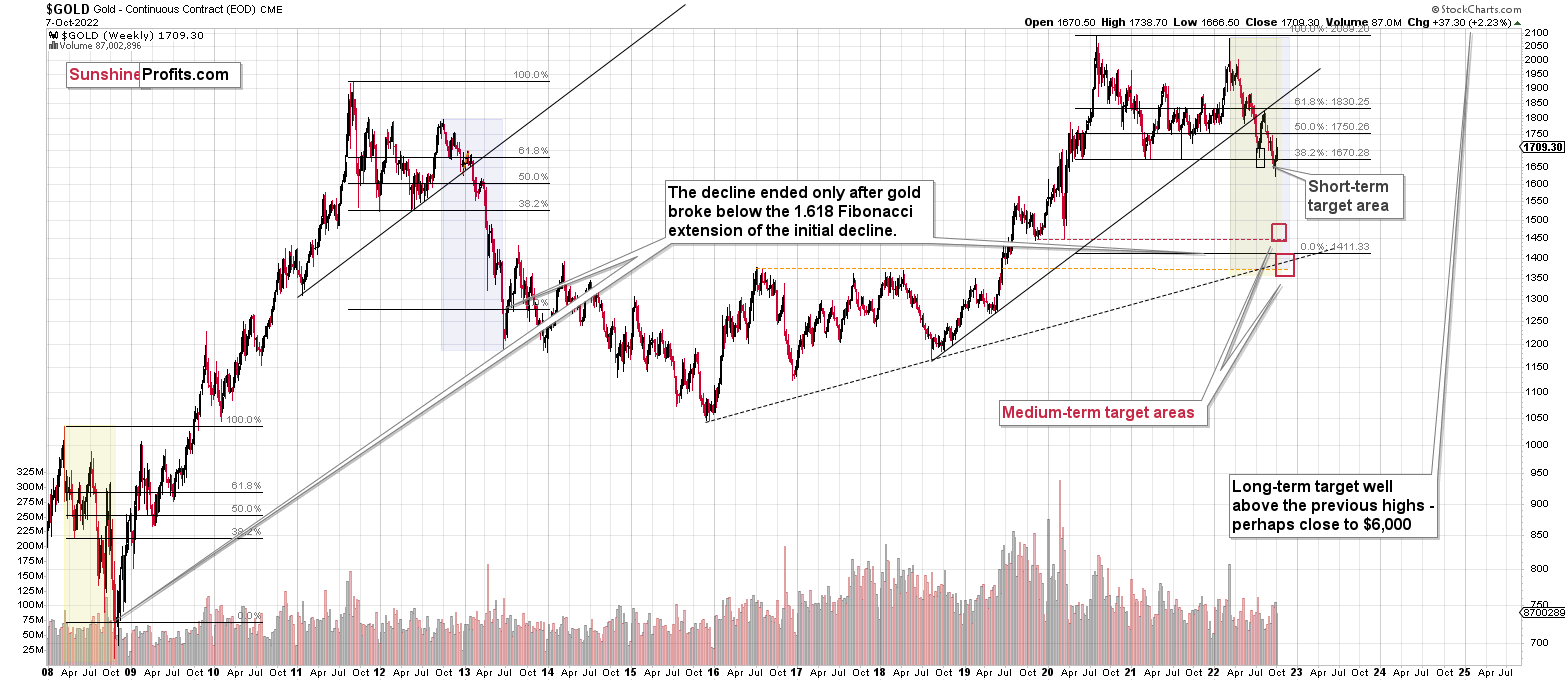
Please note that the above timing details are relatively broad and “for general overview only” – so that you know more or less what I think and how volatile I think the moves are likely to be – on an approximate basis. These time targets are not binding nor clear enough for me to think that they should be used for purchasing options, warrants, or similar instruments.
Summary
Summing up, it seems that the biggest part of the 2013-like decline is taking place right now, and – while I can’t make any promises regarding performance - it seems likely to me that our big profits are about to become huge, and then ridiculously big in the relatively near future.
As far as this quick corrective upswing is concerned, it seems that it might already be over.
The current quick upswing most likely doesn’t change anything. Fundamentals and technicals continue to point to lower precious metals values in the coming weeks / months. The current geopolitical news-based rally is likely to serve as nothing more than just a verification of the breakdown below the previous lows in gold.
Things might happen very fast in the coming days, and if I plan to make any adjustments, I’ll keep you informed. Still, if the targets that I’m mentioning in the “Trading” part of the summary are reached, I think that profits should be taken off the table without an additional confirmation from me. I will probably get on the long side of the market at that time, but I’ll send a confirmation if I decide to do so.
After the final sell-off (that takes gold to about $1,350-$1,500), I expect the precious metals to rally significantly. The final part of the decline might take as little as 1-5 weeks, so it's important to stay alert to any changes.
As always, we'll keep you – our subscribers – informed.
To summarize:
Trading capital (supplementary part of the portfolio; our opinion): Full speculative short positions (300% of the full position) in junior mining stocks are justified from the risk to reward point of view with the following binding exit profit-take price levels:
Mining stocks (price levels for the GDXJ ETF): binding profit-take exit price: $20.32; stop-loss: none (the volatility is too big to justify a stop-loss order in case of this particular trade)
Alternatively, if one seeks leverage, we’re providing the binding profit-take levels for the JDST (2x leveraged). The binding profit-take level for the JDST: $27.87; stop-loss for the JDST: none (the volatility is too big to justify a SL order in case of this particular trade).
For-your-information targets (our opinion; we continue to think that mining stocks are the preferred way of taking advantage of the upcoming price move, but if for whatever reason one wants / has to use silver or gold for this trade, we are providing the details anyway.):
Silver futures downside profit-take exit price: $12.32
SLV profit-take exit price: $11.32
ZSL profit-take exit price: $74.87
Gold futures downside profit-take exit price: $1,504
HGD.TO – alternative (Canadian) 2x inverse leveraged gold stocks ETF – the upside profit-take exit price: $18.47
HZD.TO – alternative (Canadian) 2x inverse leveraged silver ETF – the upside profit-take exit price: $46.87
Long-term capital (core part of the portfolio; our opinion): No positions (in other words: cash)
Insurance capital (core part of the portfolio; our opinion): Full position
Whether you’ve already subscribed or not, we encourage you to find out how to make the most of our alerts and read our replies to the most common alert-and-gold-trading-related-questions.
Please note that we describe the situation for the day that the alert is posted in the trading section. In other words, if we are writing about a speculative position, it means that it is up-to-date on the day it was posted. We are also featuring the initial target prices to decide whether keeping a position on a given day is in tune with your approach (some moves are too small for medium-term traders, and some might appear too big for day-traders).
Additionally, you might want to read why our stop-loss orders are usually relatively far from the current price.
Please note that a full position doesn't mean using all of the capital for a given trade. You will find details on our thoughts on gold portfolio structuring in the Key Insights section on our website.
As a reminder - "initial target price" means exactly that - an "initial" one. It's not a price level at which we suggest closing positions. If this becomes the case (as it did in the previous trade), we will refer to these levels as levels of exit orders (exactly as we've done previously). Stop-loss levels, however, are naturally not "initial", but something that, in our opinion, might be entered as an order.
Since it is impossible to synchronize target prices and stop-loss levels for all the ETFs and ETNs with the main markets that we provide these levels for (gold, silver and mining stocks - the GDX ETF), the stop-loss levels and target prices for other ETNs and ETF (among other: UGL, GLL, AGQ, ZSL, NUGT, DUST, JNUG, JDST) are provided as supplementary, and not as "final". This means that if a stop-loss or a target level is reached for any of the "additional instruments" (GLL for instance), but not for the "main instrument" (gold in this case), we will view positions in both gold and GLL as still open and the stop-loss for GLL would have to be moved lower. On the other hand, if gold moves to a stop-loss level but GLL doesn't, then we will view both positions (in gold and GLL) as closed. In other words, since it's not possible to be 100% certain that each related instrument moves to a given level when the underlying instrument does, we can't provide levels that would be binding. The levels that we do provide are our best estimate of the levels that will correspond to the levels in the underlying assets, but it will be the underlying assets that one will need to focus on regarding the signs pointing to closing a given position or keeping it open. We might adjust the levels in the "additional instruments" without adjusting the levels in the "main instruments", which will simply mean that we have improved our estimation of these levels, not that we changed our outlook on the markets. We are already working on a tool that would update these levels daily for the most popular ETFs, ETNs and individual mining stocks.
Our preferred ways to invest in and to trade gold along with the reasoning can be found in the how to buy gold section. Furthermore, our preferred ETFs and ETNs can be found in our Gold & Silver ETF Ranking.
As a reminder, Gold & Silver Trading Alerts are posted before or on each trading day (we usually post them before the opening bell, but we don't promise doing that each day). If there's anything urgent, we will send you an additional small alert before posting the main one.
Thank you.
Przemyslaw K. Radomski, CFA
Founder, Editor-in-chief

