

Briefly: in our opinion, full (300% of the regular position size) speculative short positions in junior mining stocks are justified from the risk/reward point of view at the moment of publishing this Alert.
The precious metals sector mostly moved lower yesterday, but junior miners ended the day slightly higher. What gives? Why haven’t they declined? What’s wrong?
Well, probably nothing’s wrong. The GDXJ had recently moved to new lows in terms of the daily closing prices, so the fact that it’s verifying the breakdown is a normal phenomenon – not something bullish.
Let’s take a closer look.
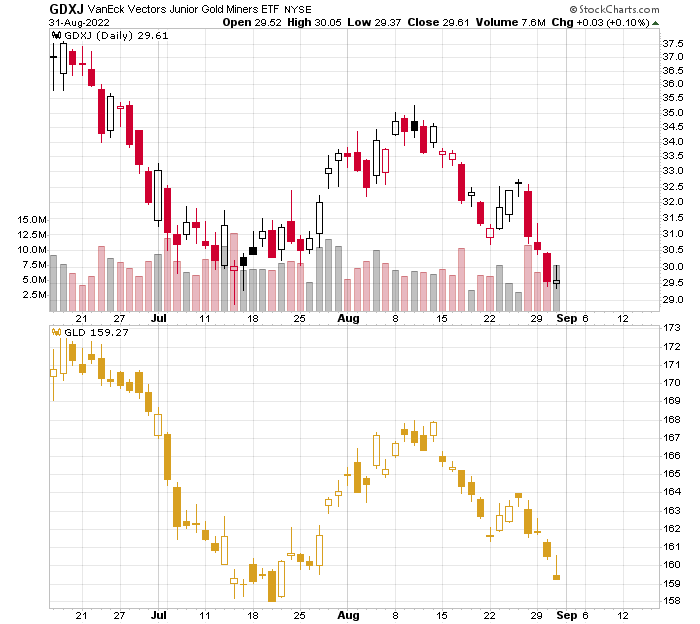
The GDXJ ended the day a mere $0.03 higher, and during the session it moved up and then back down.
In other words, it was simply a verification of the breakdown – and one that was successful – the breakdown was not invalidated.
Yes, junior miners showed relative strength compared to gold, silver, and senior miners, but they did so only for one day and only after declining more substantially beforehand. Consequently, it’s not that odd that we’re seeing a daily correction – also in terms of the relative performance.
Consequently, I don’t think there’s a reason to be concerned with the possible bullish implications at this point.
Having said that, let’s take a look at the markets from a more fundamental point of view.
The Mauling
While the GDXJ ETF closed near the flat line on Aug. 31, the S&P 500 suffered another daily sell-off and closed at the lows. Moreover, with the bulls celebrating a victory before the battle was even won, I warned on Aug. 12 that the bear market was far from over. I wrote:
With FOMO seeping into the mindsets of hedge funds and long-only managers, you better get on board before you “miss even more.”
Please see below:
 Source: Bloomberg
(…) While the consensus and the media want you to believe that the bear market is over, their lack of fundamental objectivity highlights why narratives are so destructive. Remember, if normalizing inflation and reducing its balance sheet were so easy, the Fed would have done it already.
Think about it: the Fed was so cautious about tapering its asset purchases that officials waited until inflation was so unanchored that it couldn’t be ignored. But now, the Fed will hike interest rates to 3.4%, sell $95 billion in bonds per month and increase the U.S. unemployment rate to 3.7% (the Fed’s 2022 SEP projections) while the S&P 500 hits new highs? All the while, reducing the YoY headline CPI to 2%, even though it’s never been done since 1954 without the FFR coming within ~50 basis points of the cycle peak. Good luck.
Thus, with reality reasserting itself and the financial markets now heeding Fed members' hawkish warnings, U.S. Treasury yields rose on Aug. 30 and have risen sharply in recent days.
Please see below:
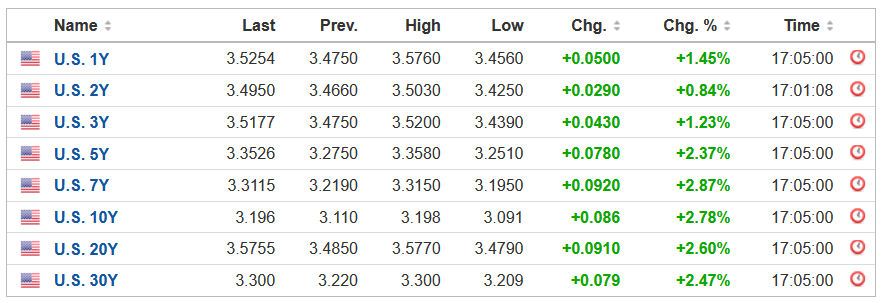 Source: Investing.com
To that point, the U.S. 5-Year Treasury yield hit its highest level since 2008, and its monthly rate of change (ROC) in August was the largest since 2009.
Please see below:
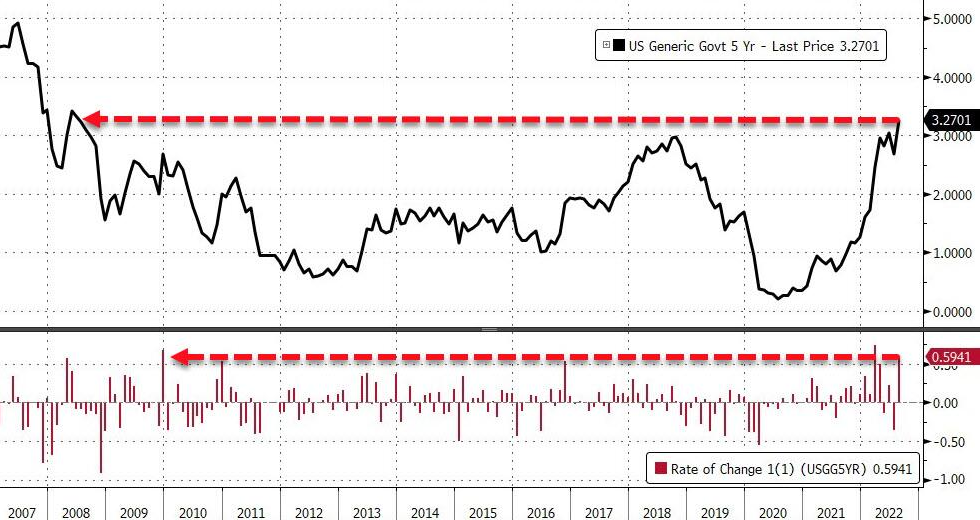 Source: Bloomberg/ZeroHedge
To explain, the black line at the top tracks the U.S. 5-Year Treasury yield, while the red line at the bottom tracks the monthly ROC. As you can see, both rallied materially in August, which was profoundly bearish for gold, silver, mining stocks, and the S&P 500.
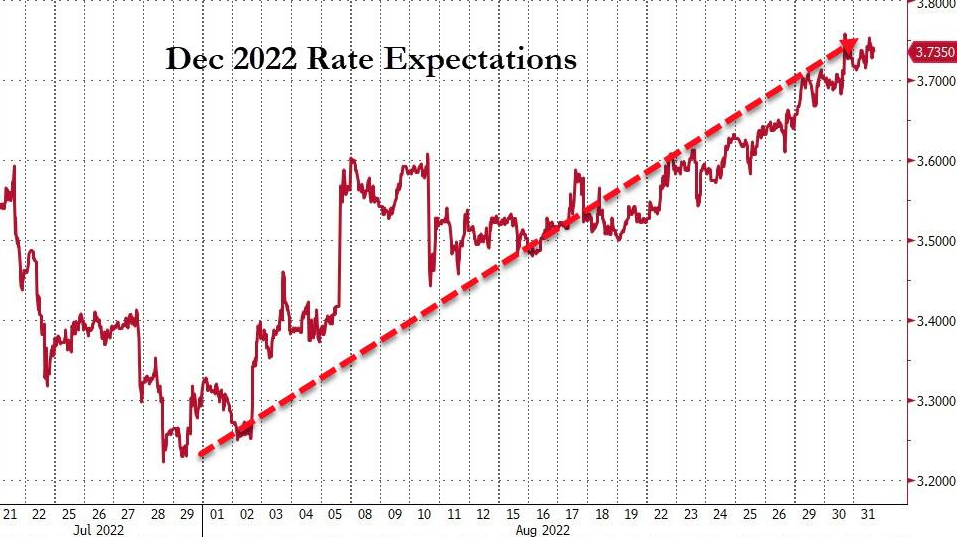
In addition, with rate hike expectations rising sharply as well, hawkish realities have rattled the bulls.
Please see below:
 Source: Bloomberg/ZeroHedge
To explain, the red line above tracks the number of rate hikes priced in for December 2022. If you analyze the clear uptrend, you can see that futures traders went from expecting a ~3.35% U.S. federal funds rate (FFR) to expecting a ~3.74% FFR by the end of the year. As such, the easing of financial conditions reversed in August, and the bulls are now on their back foot.
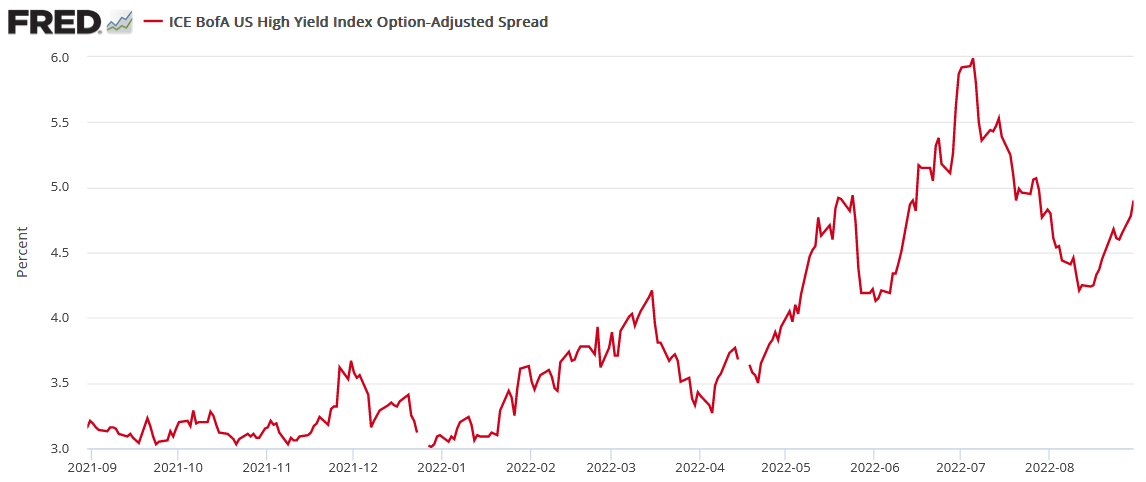
As further evidence, the ICE-Bank of America U.S. High Yield Option-Adjusted Spread (OAS) rose to 4.90% on Aug. 30 and has rallied nearly 70 basis points off the recent lows.
Please see below:
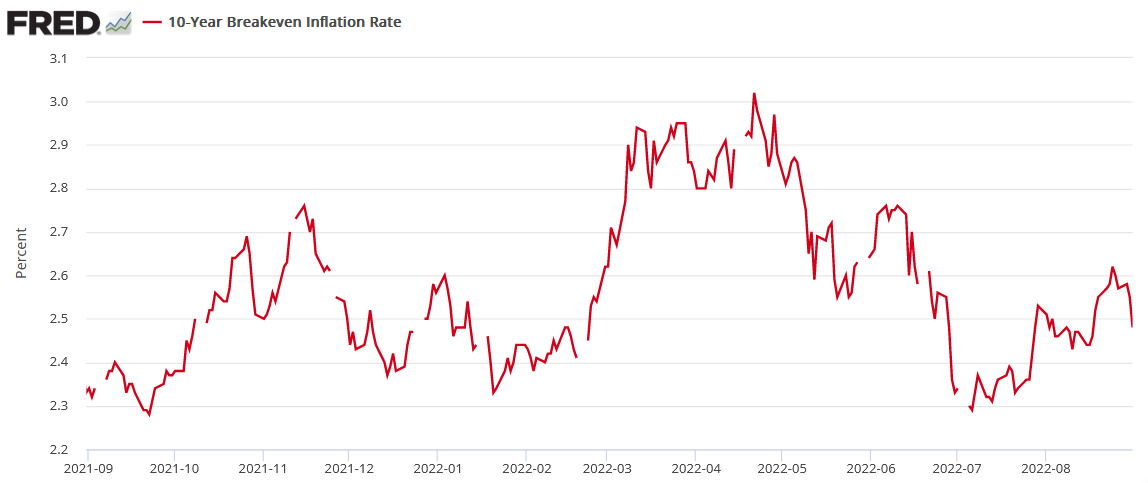
On top of that, the U.S. 10-Year breakeven inflation rate declined to 2.48% on Aug. 31; and with the U.S. 10-Year Treasury yield closing at 3.15%, a little math tells us the U.S. 10-Year real yield increased to 0.67%.
Please see below:
Moreover, I warned on Jan. 12 that higher real interest rates would upend the PMs. I wrote:
[Like] hyper-growth NASDAQ stocks and speculative assets like cryptocurrencies, PMs suffer from a similar fundamental affliction. For context, the PMs are less volatile than speculative assets. However, it's important to remember that gold, silver, and mining stocks peaked amid the liquidity-fueled surge in the summer of 2020. Likewise, their uprisings coincided with real interest rates that were at all-time lows at the time.
Conversely, with the Fed's liquidity drain already unfolding and real interest rates poised to rise in the coming months, the PMs should suffer from the likely re-pricings.
Thus, while the USD Index has been a reliable performer in 2022, the metrics above didn’t pull their weight in July. However, with material reversals occurring in August, the PMs have encountered heavy fundamental resistance.
Moreover, with the technicals painting a similar portrait, the PMs’ medium-term outlooks are profoundly bearish. As a result, while the GDXJ ETF managed to sidestep the volatility on Aug. 31, more downside should confront the junior miners in the months ahead.
Four Is a Crowd
While narratives about rampant inflation lured unsuspecting investors into precious metals long positions, I warned that “the Fed is trapped” crowd was fighting a losing battle. I wrote:
The narrative implies that the Fed can’t tighten monetary policy without crashing the U.S. economy. Thus, Fed officials are “trapped,” and the PMs should soar as inflation runs wild. However, this hyper-inflationist theory is much more semblance than substance.
To explain, adopters assumed that the Fed couldn’t taper its asset purchases without crashing the U.S. economy. However, the Fed tapered, then accelerated the taper, and the U.S. economy remained resilient. Now, the new narrative is that the Fed can’t raise interest rates without crashing the U.S. economy. However, it’s simply misleading.
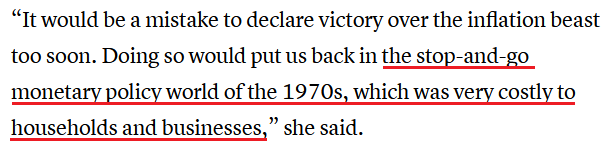
Furthermore, with nine rate hikes realized in 2022, the hyper-inflationists suffered the same fate as the “transitory” promoters. Moreover, with Cleveland Fed President Loretta Mester the fourth official to echo my warning about the 1970s and 1980s, their message couldn’t be clearer.
Please see below:
 Source: CNBC
She added:
“My current view is that it will be necessary to move the fed funds rate up to somewhat above 4% by early next year and hold it there. I do not anticipate the Fed cutting the fed funds rate target next year (…). Even if the economy were to go into a recession, we have to get inflation down.”
Therefore, while her mention of an FFR “somewhat above 4% by early next year” aligns with our way of thinking, the financial markets are still pricing in rate cuts. As a result, the expectations gap leaves room for more hawkish re-pricings in the months ahead.
Peak Nothing
While the headline Consumer Price Index (CPI) should decelerate somewhat when the data is released on Sept. 13, the consensus materially underestimates how difficult it will be to normalize the metric to 2%. Moreover, with Eurozone inflation exceeding expectations on Aug. 31, the data highlights why the pricing pressures pose a major challenge to global central banks.
Please see below:
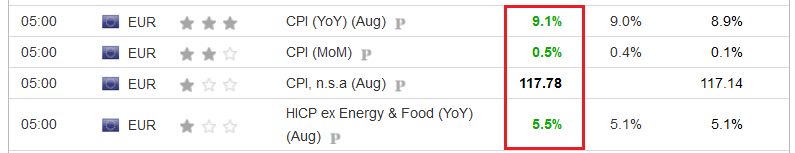 Source: Investing.com
In addition, it’s important to remember that the U.S. is not immune to what unfolds in Europe. For example, roughly 30% of S&P 500 companies’ earnings are generated overseas, so weakness in foreign markets could heavily impact U.S. stocks, and, therefore, the PMs.
Furthermore, Sam’s Club – a warehouse retailer owned by Walmart – raised its annual membership fees for the first time in nearly a decade on Aug. 31. The higher prices take effect on Oct. 17 and will jump from $45 to $50 for club members and from $100 to $110 for “Plus” members. As a result, the 10% to 11% price increases are another example of U.S. companies protecting their profit margins.
Please see below:
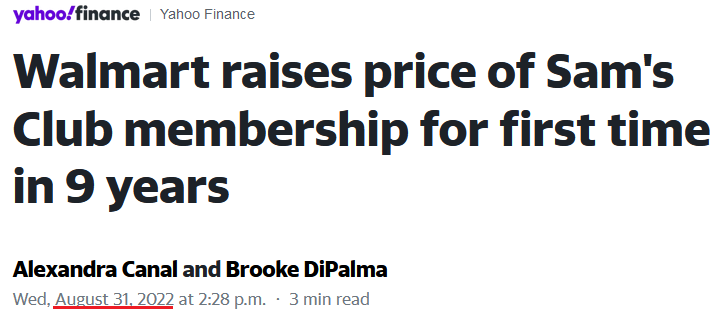 Source: Yahoo Finance
Finally, the ISM released its Chicago Business Barometer on Aug. 31. The headline index increased from 52.1 in July to 52.2 in August.
Please see below:
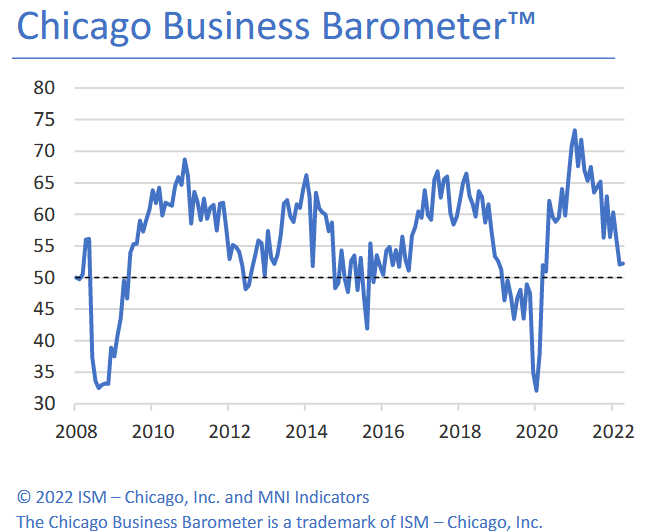
Moreover, the report revealed that “prices paid held firm in August, all but unchanged at 81.8, with price pressures remaining acute.” In addition, “employment edged down 1.5 points to 54.6, implying little change in the tightness of the labor market.”
Thus, with both indexes remaining relatively uplifted, the U.S. labor market and inflation are slowing at a snail’s pace. Therefore, the Fed will have to continue its hawkish crusade in order to normalize wage and output inflation.
The Bottom Line
With the technical and fundamental outlooks unfolding exactly as expected, our GDXJ ETF short position has paid handsomely in 2022. However, asset prices don’t move in a straight line, and counter-trend rallies will likely occur during the GDXJ ETF’s medium-term drawdown. Yet, with the junior miners making lower closing and/or intraday lows throughout their 2021 and 2022 journeys, similar outcomes should materialize in the months ahead. As such, a final sell-off should confront the PMs before long-term buying opportunities emerge.
In conclusion, the PMs were mixed on Aug. 31, as the GDXJ ETF ended the day in the green. However, with the Fed hawked up, real yields rising, and the USD Index poised to make higher highs, the fundamental and technical environments do not support higher precious metals prices.
Overview of the Upcoming Part of the Decline
- It seems to me that the corrective upswing is over, and that the next big move lower is already underway.
- If we see a situation where miners slide in a meaningful and volatile way while silver doesn’t (it just declines moderately), I plan to – once again – switch from short positions in miners to short positions in silver. At this time, it’s too early to say at what price levels this could take place and if we get this kind of opportunity at all – perhaps with gold prices close to $1,600.
- I plan to exit all remaining short positions once gold shows substantial strength relative to the USD Index while the latter is still rallying. This may be the case with gold prices close to $1,400. I expect silver to fall the hardest in the final part of the move. This moment (when gold performs very strongly against the rallying USD and miners are strong relative to gold after its substantial decline) is likely to be the best entry point for long-term investments, in my view. This can also happen with gold close to $1,400, but at the moment it’s too early to say with certainty.
- The above is based on the information available today, and it might change in the following days/weeks.
You will find my general overview of the outlook for gold on the chart below:
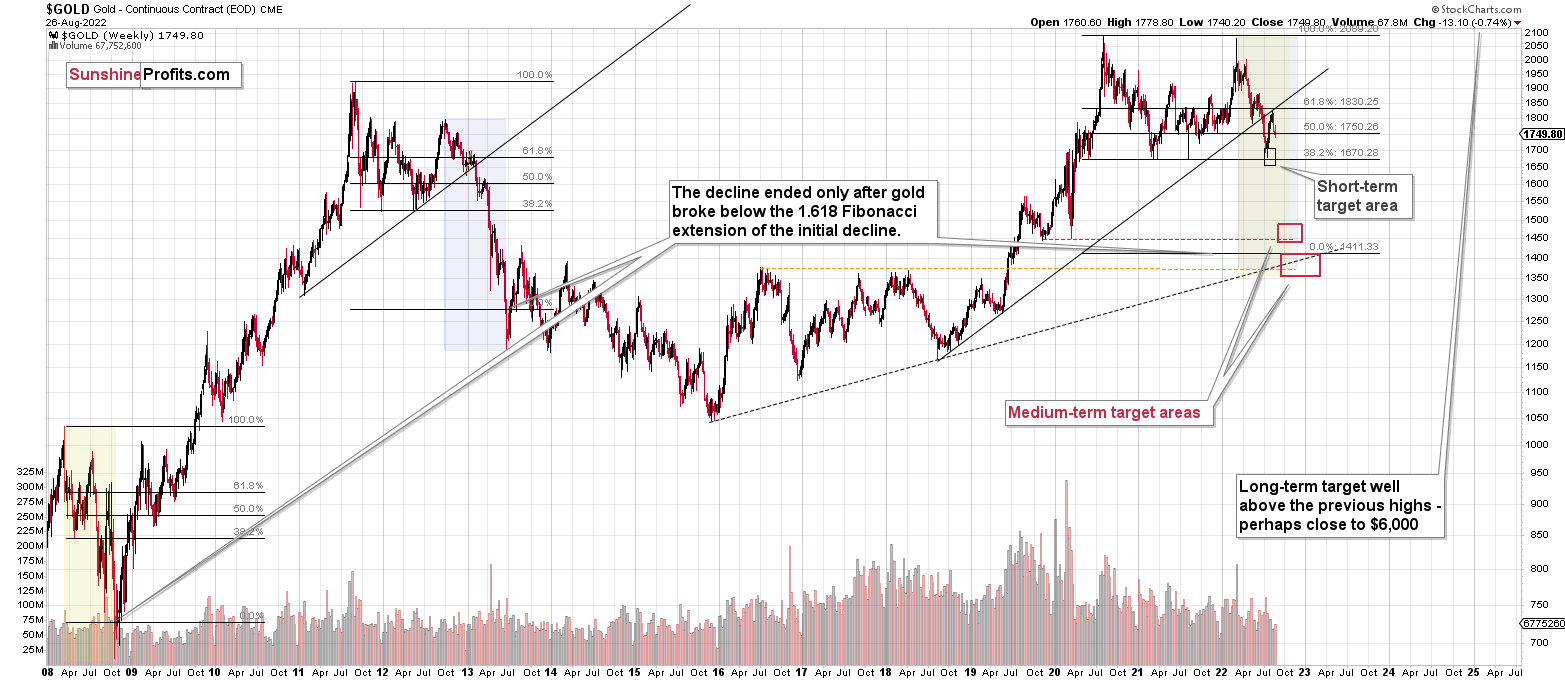
Please note that the above timing details are relatively broad and “for general overview only” – so that you know more or less what I think and how volatile I think the moves are likely to be – on an approximate basis. These time targets are not binding nor clear enough for me to think that they should be used for purchasing options, warrants, or similar instruments.
Summary
Summing up, it seems that the corrective upswing is over, which means that the powerful medium-term downtrend can now resume.
You have been profiting from how this situation develops practically throughout the entire year, and the above indicates (I’m not making any guarantees, of course) that the biggest gains are likely just ahead.
After the final sell-off (that takes gold to about $1,350-$1,500), I expect the precious metals to rally significantly. The final part of the decline might take as little as 1-5 weeks, so it's important to stay alert to any changes.
As always, we'll keep you – our subscribers – informed.
To summarize:
Trading capital (supplementary part of the portfolio; our opinion): Full speculative short positions (300% of the full position) in junior mining stocks are justified from the risk to reward point of view with the following binding exit profit-take price levels:
Mining stocks (price levels for the GDXJ ETF): binding profit-take exit price: $20.32; stop-loss: none (the volatility is too big to justify a stop-loss order in case of this particular trade)
Alternatively, if one seeks leverage, we’re providing the binding profit-take levels for the JDST (2x leveraged). The binding profit-take level for the JDST: $29.87; stop-loss for the JDST: none (the volatility is too big to justify a SL order in case of this particular trade).
For-your-information targets (our opinion; we continue to think that mining stocks are the preferred way of taking advantage of the upcoming price move, but if for whatever reason one wants / has to use silver or gold for this trade, we are providing the details anyway.):
Silver futures downside profit-take exit price: $12.32
SLV profit-take exit price: $11.32
ZSL profit-take exit price: $79.87
Gold futures downside profit-take exit price: $1,504
HGD.TO – alternative (Canadian) 2x inverse leveraged gold stocks ETF – the upside profit-take exit price: $19.87
HZD.TO – alternative (Canadian) 2x inverse leveraged silver ETF – the upside profit-take exit price: $49.87
Long-term capital (core part of the portfolio; our opinion): No positions (in other words: cash)
Insurance capital (core part of the portfolio; our opinion): Full position
Whether you’ve already subscribed or not, we encourage you to find out how to make the most of our alerts and read our replies to the most common alert-and-gold-trading-related-questions.
Please note that we describe the situation for the day that the alert is posted in the trading section. In other words, if we are writing about a speculative position, it means that it is up-to-date on the day it was posted. We are also featuring the initial target prices to decide whether keeping a position on a given day is in tune with your approach (some moves are too small for medium-term traders, and some might appear too big for day-traders).
Additionally, you might want to read why our stop-loss orders are usually relatively far from the current price.
Please note that a full position doesn't mean using all of the capital for a given trade. You will find details on our thoughts on gold portfolio structuring in the Key Insights section on our website.
As a reminder - "initial target price" means exactly that - an "initial" one. It's not a price level at which we suggest closing positions. If this becomes the case (as it did in the previous trade), we will refer to these levels as levels of exit orders (exactly as we've done previously). Stop-loss levels, however, are naturally not "initial", but something that, in our opinion, might be entered as an order.
Since it is impossible to synchronize target prices and stop-loss levels for all the ETFs and ETNs with the main markets that we provide these levels for (gold, silver and mining stocks - the GDX ETF), the stop-loss levels and target prices for other ETNs and ETF (among other: UGL, GLL, AGQ, ZSL, NUGT, DUST, JNUG, JDST) are provided as supplementary, and not as "final". This means that if a stop-loss or a target level is reached for any of the "additional instruments" (GLL for instance), but not for the "main instrument" (gold in this case), we will view positions in both gold and GLL as still open and the stop-loss for GLL would have to be moved lower. On the other hand, if gold moves to a stop-loss level but GLL doesn't, then we will view both positions (in gold and GLL) as closed. In other words, since it's not possible to be 100% certain that each related instrument moves to a given level when the underlying instrument does, we can't provide levels that would be binding. The levels that we do provide are our best estimate of the levels that will correspond to the levels in the underlying assets, but it will be the underlying assets that one will need to focus on regarding the signs pointing to closing a given position or keeping it open. We might adjust the levels in the "additional instruments" without adjusting the levels in the "main instruments", which will simply mean that we have improved our estimation of these levels, not that we changed our outlook on the markets. We are already working on a tool that would update these levels daily for the most popular ETFs, ETNs and individual mining stocks.
Our preferred ways to invest in and to trade gold along with the reasoning can be found in the how to buy gold section. Furthermore, our preferred ETFs and ETNs can be found in our Gold & Silver ETF Ranking.
As a reminder, Gold & Silver Trading Alerts are posted before or on each trading day (we usually post them before the opening bell, but we don't promise doing that each day). If there's anything urgent, we will send you an additional small alert before posting the main one.
Thank you.
Przemyslaw Radomski, CFA
Founder, Editor-in-chief

