

Briefly: in our opinion, full (300% of the regular position size) speculative short positions in junior mining stocks are justified from the risk/reward point of view at the moment of publishing this Alert. Also, I’m adjusting the targets for the leveraged instruments – as some time passed since I’ve done so previously, and the markets have been moving back and forth in the meantime.
The stock market declined only slightly yesterday, so everything that I wrote about it and about the implications of the situation remains up-to-date [quote is unchanged, but I’m uploading new charts]:
We’re almost there.
We’re almost at the point where stock market investors give up and let the big plunge unfold. I wrote about the link between the general stock market and the precious metals market previously, but as a quick reminder, they are likely to decline together, at least initially, and junior mining stocks are likely to feel the biggest pain.
For broader context, please take a look at yesterday’s analysis, if you haven’t had the chance to do so yet.
If you’re familiar with it, let’s take a closer look at the S&P 500 futures.
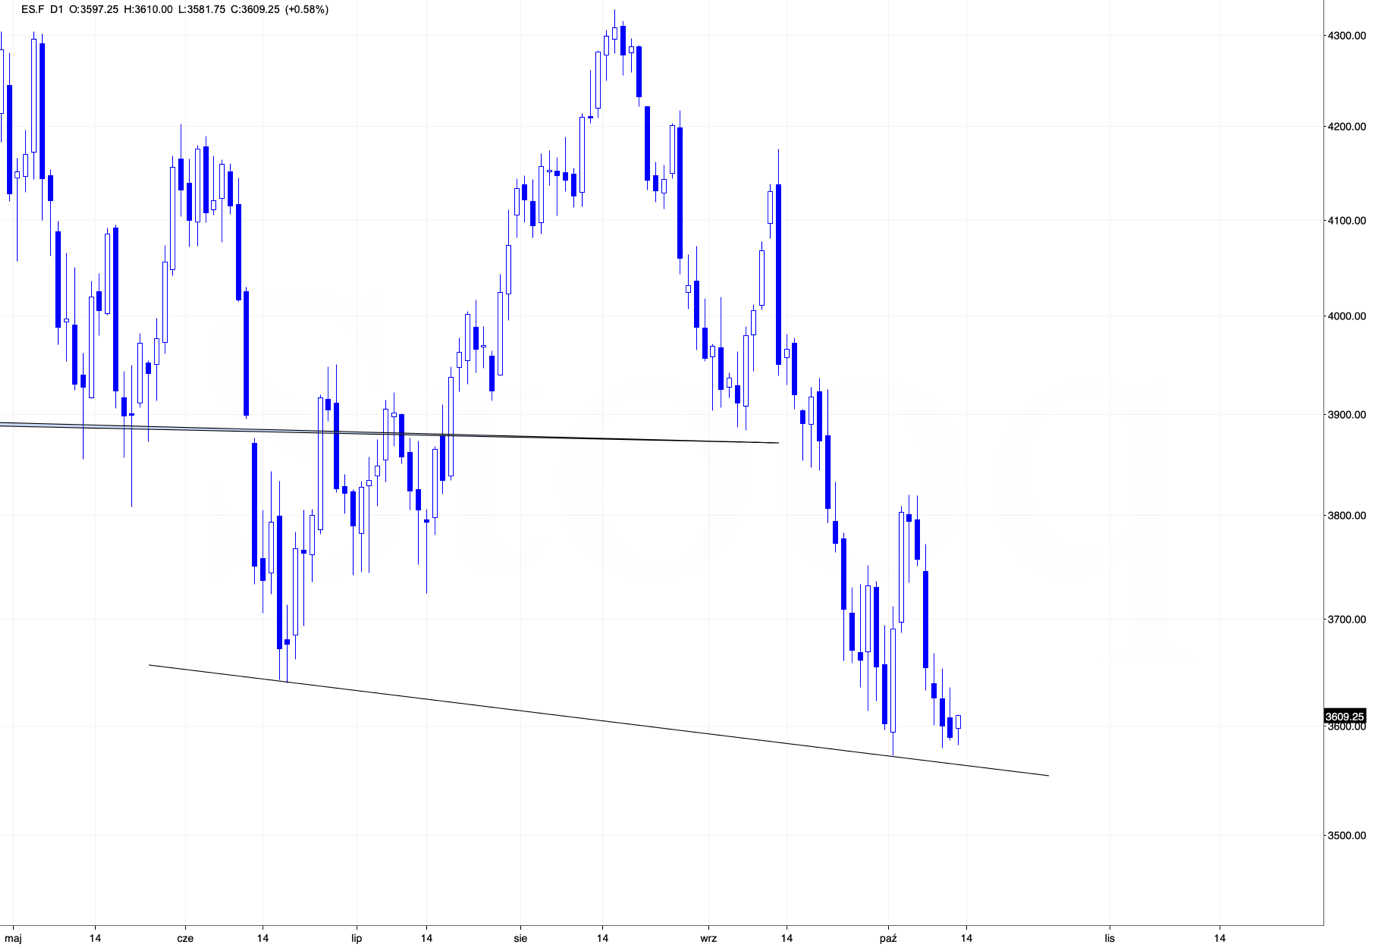
Even though it might not be clear at first sight, stocks actually made a new yearly low yesterday, which, of course, is something important.
They moved back up in today’s pre-market trading, but the breakdown could really be confirmed this time. We already saw a corrective rally earlier this month, and it failed to ignite a trend reversal. It's no surprise that interest rates are rising and inflation has yet to abate. History shows that rates need to climb much higher for that to happen.
Anyway, if stocks decline further soon – and that appears likely – they will then break below the neck level of the head-and-shoulder formation that started in mid-June. Based on this formation, stocks are likely to move much lower – approximately repeating their August-September decline.
What if junior mining stocks also repeat their August-September decline?
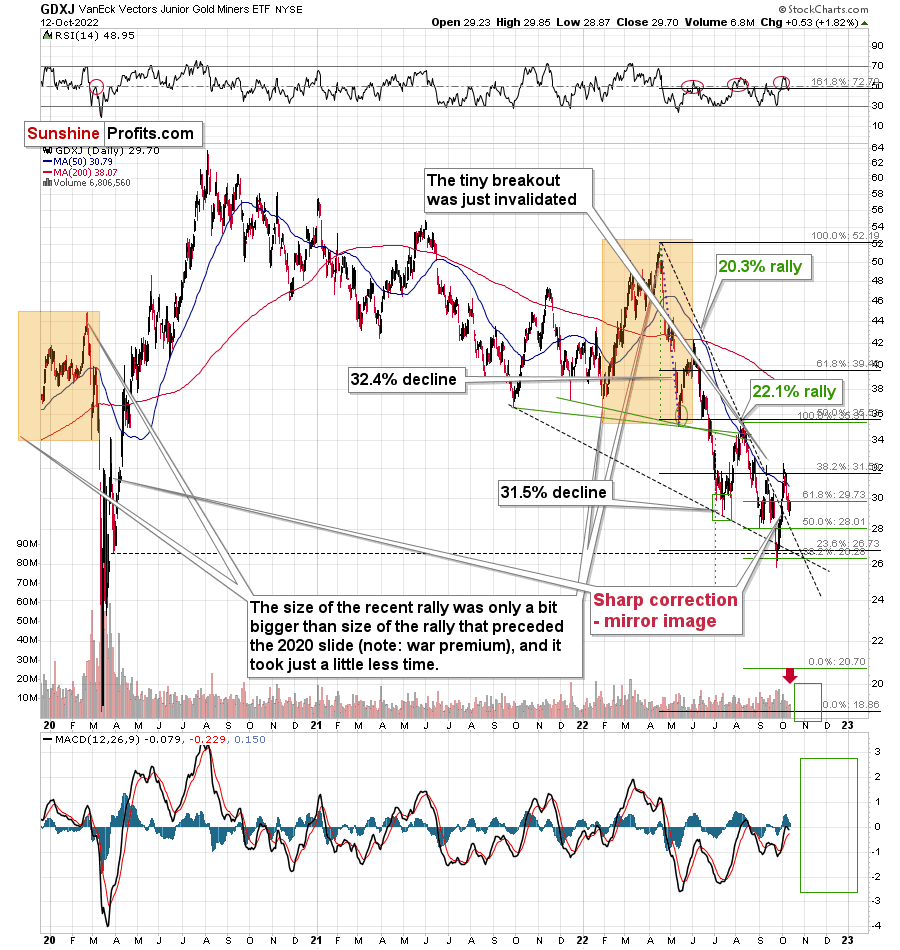
Well, then they would be likely to fall significantly – to $22-24.
However, based on the link to 2013, and based on where the strong support levels are (there aren’t any really strong support levels between ~$26 and the 2020 lows), the GDXJ is likely to decline even more.
The GDXJ ETF ended yesterday’s session slightly higher, but please note that this move up materialized on low volume. This tells us that it’s just a pause within the decline.
So, all in all, my previous bearish comments on gold, silver, and mining stocks remain up-to-date, and there’s little new that I can add today that I haven’t already written about in recent days. Before moving to the fundamentals, I’d like you to take a look at the below USD Index chart, and appreciate how perfectly the monthly turning point worked recently.
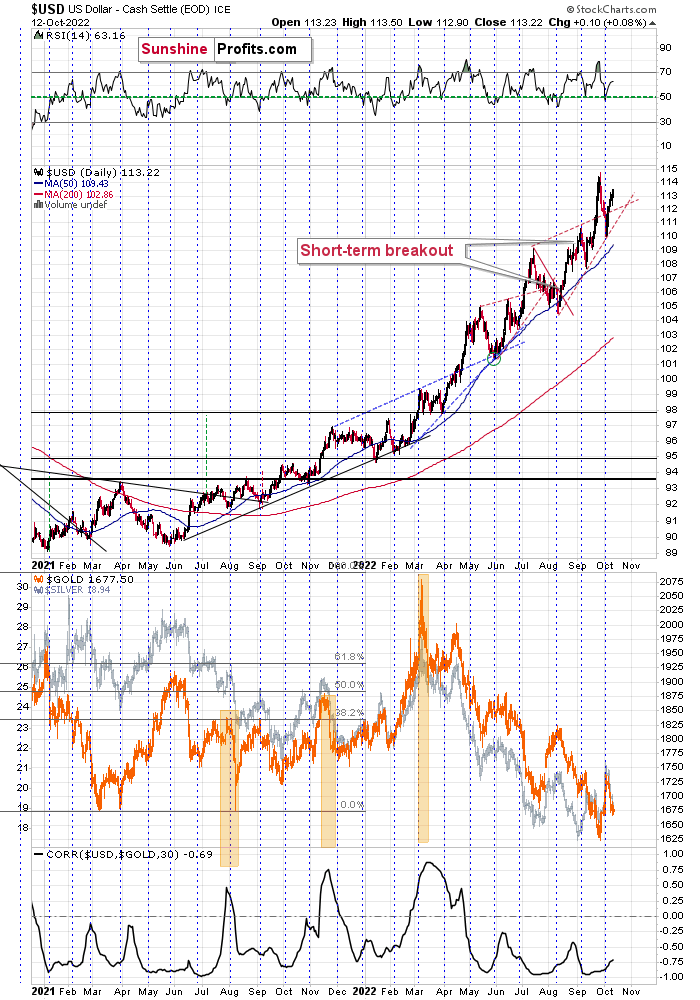
On Oct. 3, I wrote the following:
Nothing changed in the USD Index – it just verified the breakout above its rising support/resistance line. It declined close to the turn of the month, which is when it tends to reverse its course.
As the breakout held, the outlook for the U.S. dollar remains bullish, and given the above-mentioned monthly seasonality for the dollar, it seems that the rally is likely to resume any day now.
Indeed, the USD Index’s rally resumed just a few days later.
Having said that, let’s take a look at the markets from a more fundamental point of view.
Focus on the Medium Term
While today’s Consumer Price Index (CPI) release could spark a frenzy across the financial markets, I’ve warned repeatedly that the path of inflation is much more important than any one print.
Therefore, while a hot print may send risk assets into a tailspin and a cool print may elicit a celebration, the reality is that normalizing the metric to 2% is a challenge that’s profoundly bearish for gold, silver, mining stocks, and the S&P 500.
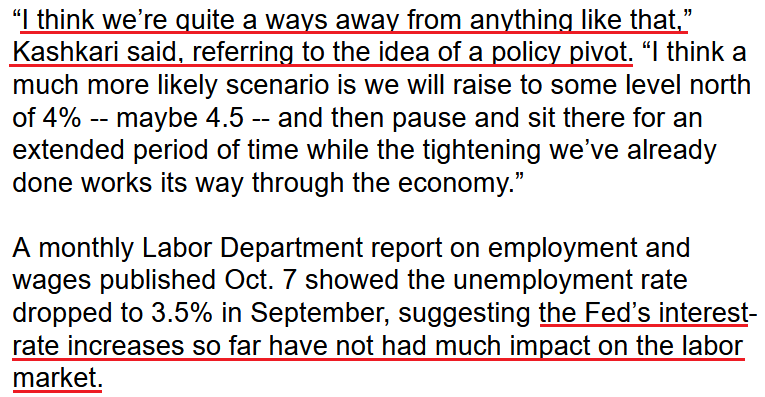
Furthermore, Minneapolis Fed President Neel Kashkari said on Oct. 12 that officials must “walk the walk” to remain credible and reduce inflation.
“If the economy entered a steep downturn, we could always stop what we’re doing,” he said. “We could always reverse what we’re doing, if we thought that inflation was headed back down very, very quickly.
“For me, the bar for such a change is very high because we have not yet seen much evidence that the underlying inflation – the services inflation, the wage inflation, the labor market – is yet softening.”
As such, with the pivot crowd realizing their daydream has turned into a nightmare, Fed officials continue to vocalize that higher-for-longer interest rates should be expected.
Please see below:
 Source: Bloomberg
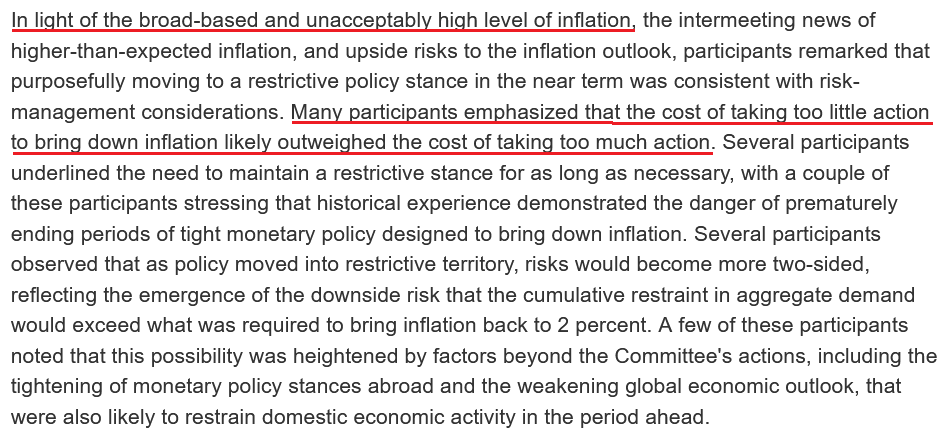
Likewise, the Fed released the minutes from its September 20-21 monetary policy meeting. The report revealed:
“Many participants noted that, with inflation well above the Committee's 2% objective and showing little sign so far of abating, and with supply and demand imbalances in the economy continuing, they had raised their assessment of the path of the federal funds rate that would likely be needed to achieve the Committee's goals.”
In addition:
“Most participants remarked that, although some interest-sensitive categories of spending – such as housing and business fixed investment – had already started to respond to the tightening of financial conditions, a sizable portion of economic activity had yet to display much response. They noted also that inflation had not yet responded appreciably to policy tightening and that a significant reduction in inflation would likely lag that of aggregate demand.”
Thus, with Fed officials increasingly hawked up, the implications of the minutes are highly bearish for the PMs.
Please see below:
 Source: U.S. Fed
To that point, I warned on Dec. 23, 2021 that investors were miscalculating the Fed’s resolve. I wrote:
The narrative implies that the Fed can’t tighten monetary policy without crashing the U.S. economy. So Fed officials are “trapped,” and the PMs should soar as inflation runs wild. However, this hyper-inflationist theory is much more semblance than substance.
To explain, adopters assumed that the Fed couldn’t taper its asset purchases without crashing the U.S. economy. However, the Fed tapered, then accelerated the taper, and the U.S. economy remained resilient. Now, the new narrative is that the Fed can’t raise interest rates without crashing the U.S. economy. However, it’s simply misleading….
Also, please note that when the Fed called inflation “transitory,” I wrote for months that officials were misreading the data. As a result, I don’t have a horse in this race. However, now, they likely have it right. Thus, if investors assume that the Fed won’t tighten, their bets will likely go bust in 2022.
Yet, with the narrative shifting substantially, the prediction has proven prescient. Likewise, with investors now heeding the Fed’s hawkish warnings, the unprecedented liquidity drain should result in more pain for risk assets over the medium term.
Please see below:
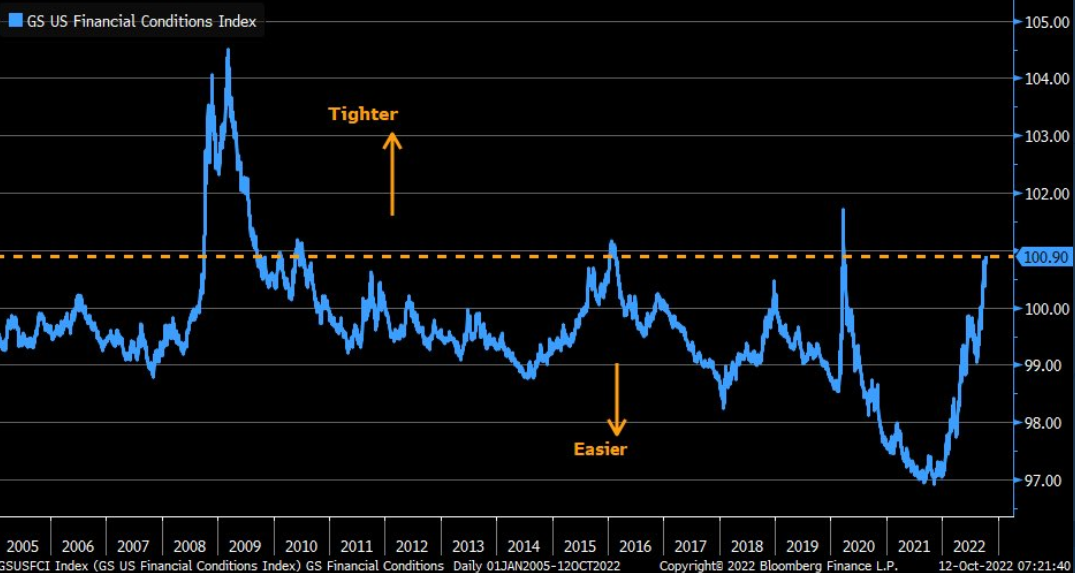
To explain, the blue line above tracks the Goldman Sachs Financial Conditions Index (FCI). For context, the metric uses interest rates, credit spreads, equity prices, and the U.S. dollar to determine how tight or loose financial conditions are.
If you analyze the right side of the chart, you can see that the blue line has risen substantially in 2022; and after surpassing its 2018/2019 high, the next stop is the 2015/2016 high. Moreover, with the current CPI well above 2015/2016, a similar reading is likely the minimum standard.
Therefore, with the FCI poised to continue its ascent until inflation subsides, the index may even reach its March 2020 pandemic-induced high in the months ahead.
Also noteworthy, I've warned on numerous occasions that investors underestimated the demand side of the inflation equation. In a nutshell: with U.S. consumers flush with cash, their spending habits would, and did, keep inflation elevated for much longer than the consensus expected.
So with Bank of America CEO Brian Moynihan – who heads the second largest bank in the U.S. – noting on Oct. 12 that consumer spending is up 10% so far in October, Americans' ability and willingness to spend still makes the Fed's inflation fight one of attrition.
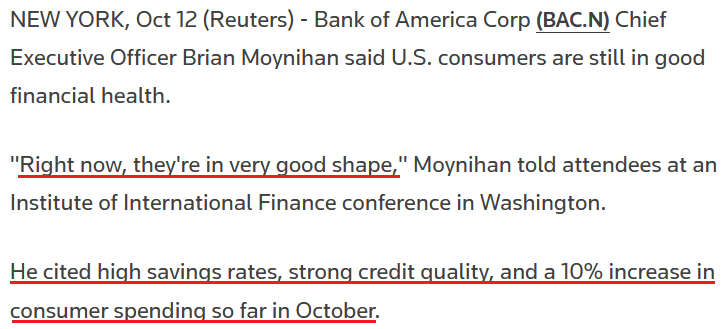 Source: Reuters
500 Problems
While the GDXJ ETF outperformed the S&P 500 on Oct. 12, the former is much more correlated to the latter’s performance than its precious metals peers. As a result, the S&P 500 has a material influence.
Moreover, with the U.S. equity benchmark’s fundamental outlook deteriorating rapidly, it’s likely only a matter of time before a profound slide occurs.
Please see below:
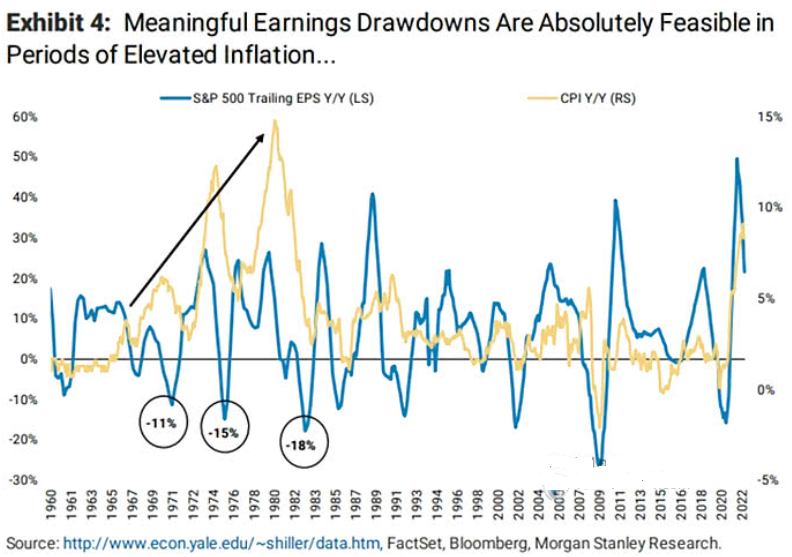
To explain, Morgan Stanley found that S&P 500 earnings took a major hit during the inflationary malaise of the 1970s/1980s. If you analyze the three black circles at the bottom left of the chart above, you can see that the S&P 500’s trailing 12-month earnings per share (the blue line) sank by 11%, 15%, and 18% year-over-year (YoY) while the YoY CPI (the gold line) accelerated. As such, a similar backdrop puts S&P 500 earnings in a precarious position.
Second, the rapid rise in U.S. Treasury yields has eroded the TINA (there is no alternative) argument and left the S&P 500 as a higher-risk-lower-reward asset.
Please see below:
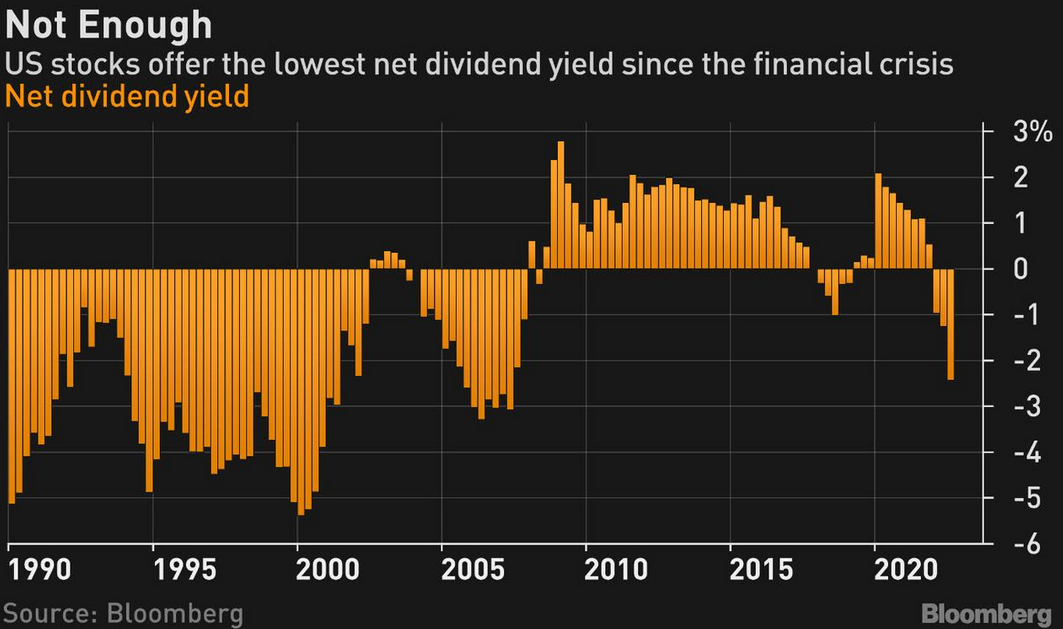
To explain, the orange bars above track the S&P 500’s net dividend yield. For context, the metric is calculated by subtracting the U.S. 2-Year Treasury yield from the S&P 500’s dividend yield.
If you analyze the right side of the chart, you can see that the metric has sunk to levels last seen during the run-up to the global financial crisis (GFC). As a result, while the S&P 500 has declined substantially in 2022, the index is far from cheap.
Furthermore, historical periods where the S&P 500’s net dividend yield has been this low have offered relatively little upside for equity bulls.
Please see below:
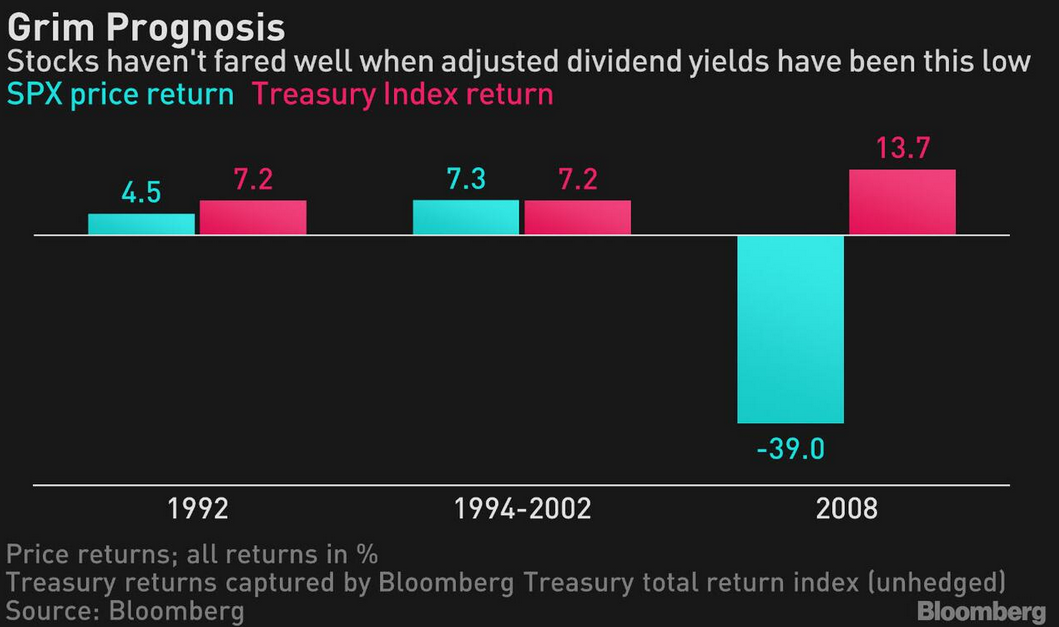
To explain, Treasury bonds (the pink bars) mildly and substantially outperformed the S&P 500 (the blue bars) in 1992 and 2008 when the latter’s net dividend yield was similar. In contrast, while an immaterial S&P 500 outperformance was present from 1994 to 2002, the periodic return was relatively weak.
In addition, the results don’t capture the volatility incurred (Sharpe ratio) to achieve those returns, as Treasury bonds are often much less volatile than equities. So stocks are relatively less attractive in this environment.
Finally, with the Fed running to the rescue every time investors threw a tantrum, the post-GFC crowd was programmed to mindlessly buy the dip. However, with unanchored inflation leaving market participants abandoned in 2022, the dip buyers’ confidence isn’t what it once was.
Please see below:
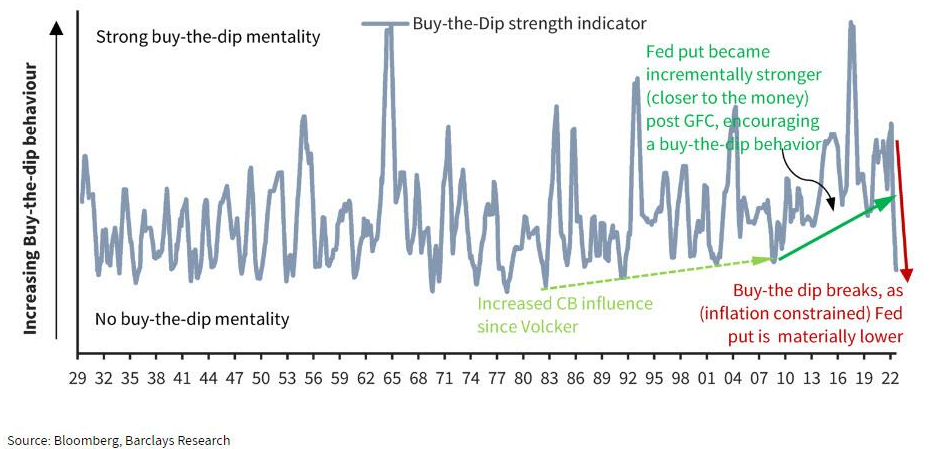
To explain, the blue line above tracks Barclay’s buy-the-dip strength indicator, which measures investors’ propensity to increase their longs when volatility strikes. If you analyze the right side of the chart, you can see that the blue line has declined substantially now that the crowd can’t rely on the Fed to save the day.
As such, with gold, silver, mining stocks, and the S&P 500 confronting a treacherous medium-term backdrop, the group will have to earn their future returns rather than having hope and sentiment dictate their price action.
The Bottom Line
With volatility poised to remain high, the CPI release may lead to abnormal swings across currencies, bonds, stocks and commodities. However, the monthly print is largely overhyped, and the daily rallies and falls are relatively immaterial when analyzed from a medium-term perspective. As a result, while the PMs may move violently in either direction, one print shouldn’t influence where they end up in the months ahead.
In conclusion, the PMs were mixed on Oct. 12, as mining stocks ended the day in the green. Moreover, while the S&P 500 sold off into the close, the USD Index and the U.S. 10-Year real yield were essentially flat. Therefore, with assets in limbo until the CPI data is digested, short-term clarity should emerge in the hours ahead.
Overview of the Upcoming Part of the Decline
- It seems to me that the corrective upswing is over, and that the next big move lower is already underway.
- If we see a situation where miners slide in a meaningful and volatile way while silver doesn’t (it just declines moderately), I plan to – once again – switch from short positions in miners to short positions in silver. At this time, it’s too early to say at what price levels this could take place and if we get this kind of opportunity at all – perhaps with gold prices close to $1,600.
- I plan to switch from the short positions in junior mining stocks or silver (whichever I’ll have at that moment) to long positions in junior mining stocks when gold / mining stocks move to their 2020 lows (approximately). While I’m probably not going to write about it at this stage yet, this is when some investors might consider getting back in with their long-term investing capital (or perhaps 1/3 or 1/2 thereof).
- I plan to return to short positions in junior mining stocks after a rebound – and the rebound could take gold from about $1,450 to about $1,550, and it could take the GDXJ from about $20 to about $24.
- I plan to exit all remaining short positions once gold shows substantial strength relative to the USD Index while the latter is still rallying. This may be the case with gold prices close to $1,400 and GDXJ close to $15 . This moment (when gold performs very strongly against the rallying USD and miners are strong relative to gold after its substantial decline) is likely to be the best entry point for long-term investments, in my view. This can also happen with gold close to $1,400, but at the moment it’s too early to say with certainty.
- The above is based on the information available today, and it might change in the following days/weeks.
You will find my general overview of the outlook for gold on the chart below:
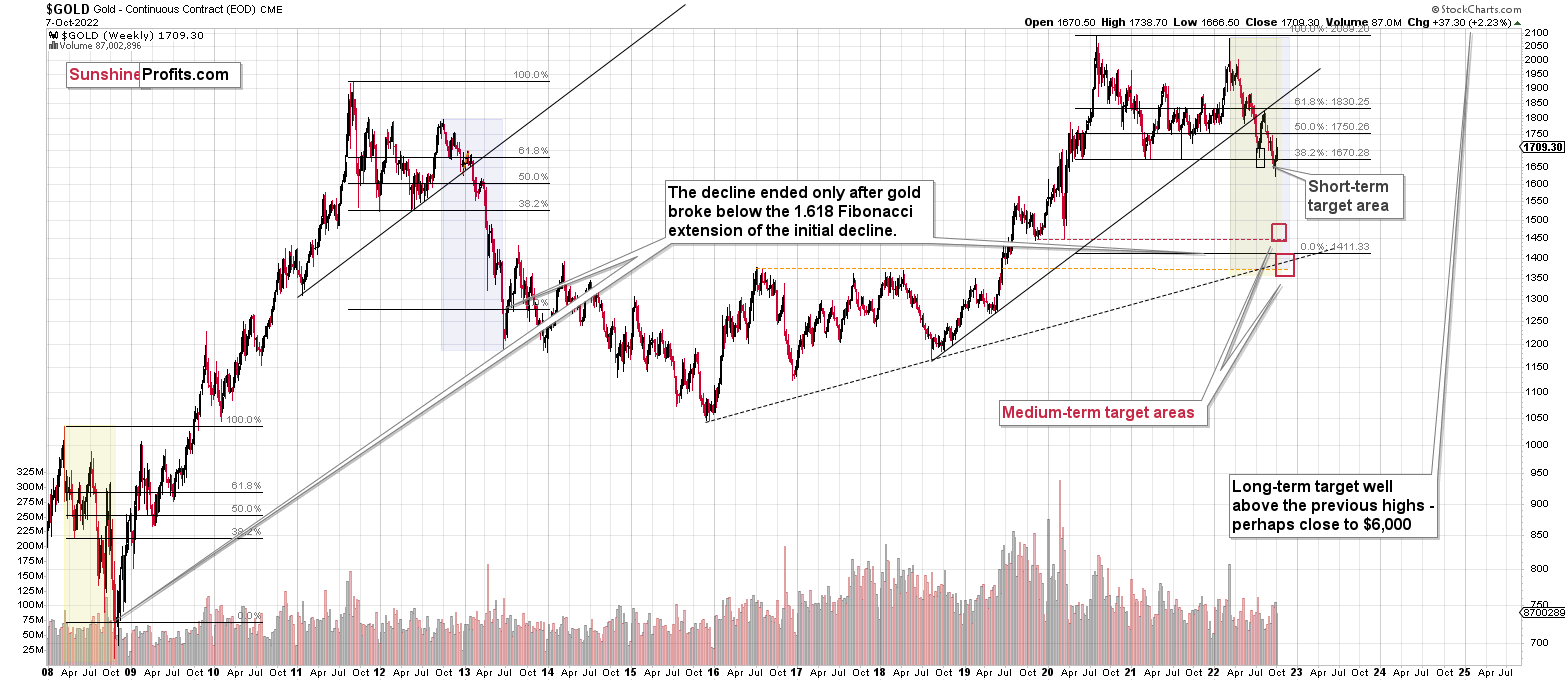
Please note that the above timing details are relatively broad and “for general overview only” – so that you know more or less what I think and how volatile I think the moves are likely to be – on an approximate basis. These time targets are not binding nor clear enough for me to think that they should be used for purchasing options, warrants, or similar instruments.
Letters to the Editor
Q: Do you expect a capitulation day or two in precious metals and markets in the near term?
A: I wouldn’t say “expect,” but I’d say that such a move would not surprise me. But it wouldn’t surprise me, if the slide happened in a week or two, either. Still, based on what we see in the general stock market, it seems to me that we’re very close to the slide.
Summary
Summing up, it seems that the biggest part of the 2013-like decline is taking place right now, and – while I can’t make any promises regarding performance - it seems likely to me that our big profits are about to become huge, and then ridiculously big in the relatively near future.
As far as this quick corrective upswing is concerned, it seems that it might already be over.
The current quick upswing most likely doesn’t change anything. Fundamentals and technicals continue to point to lower precious metals values in the coming weeks / months. The current geopolitical news-based rally is likely to serve as nothing more than just a verification of the breakdown below the previous lows in gold.
Things might happen very fast in the coming days, and if I plan to make any adjustments, I’ll keep you informed. Still, if the targets that I’m mentioning in the “Trading” part of the summary are reached, I think that profits should be taken off the table without an additional confirmation from me. I will probably get on the long side of the market at that time, but I’ll send a confirmation if I decide to do so.
After the final sell-off (that takes gold to about $1,350-$1,500), I expect the precious metals to rally significantly. The final part of the decline might take as little as 1-5 weeks, so it's important to stay alert to any changes.
As always, we'll keep you – our subscribers – informed.
To summarize:
Trading capital (supplementary part of the portfolio; our opinion): Full speculative short positions (300% of the full position) in junior mining stocks are justified from the risk to reward point of view with the following binding exit profit-take price levels:
Mining stocks (price levels for the GDXJ ETF): binding profit-take exit price: $20.32; stop-loss: none (the volatility is too big to justify a stop-loss order in case of this particular trade)
Alternatively, if one seeks leverage, we’re providing the binding profit-take levels for the JDST (2x leveraged). The binding profit-take level for the JDST: $27.87; stop-loss for the JDST: none (the volatility is too big to justify a SL order in case of this particular trade).
For-your-information targets (our opinion; we continue to think that mining stocks are the preferred way of taking advantage of the upcoming price move, but if for whatever reason one wants / has to use silver or gold for this trade, we are providing the details anyway.):
Silver futures downside profit-take exit price: $12.32
SLV profit-take exit price: $11.32
ZSL profit-take exit price: $74.87
Gold futures downside profit-take exit price: $1,504
HGD.TO – alternative (Canadian) 2x inverse leveraged gold stocks ETF – the upside profit-take exit price: $18.47
HZD.TO – alternative (Canadian) 2x inverse leveraged silver ETF – the upside profit-take exit price: $46.87
Long-term capital (core part of the portfolio; our opinion): No positions (in other words: cash)
Insurance capital (core part of the portfolio; our opinion): Full position
Whether you’ve already subscribed or not, we encourage you to find out how to make the most of our alerts and read our replies to the most common alert-and-gold-trading-related-questions.
Please note that we describe the situation for the day that the alert is posted in the trading section. In other words, if we are writing about a speculative position, it means that it is up-to-date on the day it was posted. We are also featuring the initial target prices to decide whether keeping a position on a given day is in tune with your approach (some moves are too small for medium-term traders, and some might appear too big for day-traders).
Additionally, you might want to read why our stop-loss orders are usually relatively far from the current price.
Please note that a full position doesn't mean using all of the capital for a given trade. You will find details on our thoughts on gold portfolio structuring in the Key Insights section on our website.
As a reminder - "initial target price" means exactly that - an "initial" one. It's not a price level at which we suggest closing positions. If this becomes the case (as it did in the previous trade), we will refer to these levels as levels of exit orders (exactly as we've done previously). Stop-loss levels, however, are naturally not "initial", but something that, in our opinion, might be entered as an order.
Since it is impossible to synchronize target prices and stop-loss levels for all the ETFs and ETNs with the main markets that we provide these levels for (gold, silver and mining stocks - the GDX ETF), the stop-loss levels and target prices for other ETNs and ETF (among other: UGL, GLL, AGQ, ZSL, NUGT, DUST, JNUG, JDST) are provided as supplementary, and not as "final". This means that if a stop-loss or a target level is reached for any of the "additional instruments" (GLL for instance), but not for the "main instrument" (gold in this case), we will view positions in both gold and GLL as still open and the stop-loss for GLL would have to be moved lower. On the other hand, if gold moves to a stop-loss level but GLL doesn't, then we will view both positions (in gold and GLL) as closed. In other words, since it's not possible to be 100% certain that each related instrument moves to a given level when the underlying instrument does, we can't provide levels that would be binding. The levels that we do provide are our best estimate of the levels that will correspond to the levels in the underlying assets, but it will be the underlying assets that one will need to focus on regarding the signs pointing to closing a given position or keeping it open. We might adjust the levels in the "additional instruments" without adjusting the levels in the "main instruments", which will simply mean that we have improved our estimation of these levels, not that we changed our outlook on the markets. We are already working on a tool that would update these levels daily for the most popular ETFs, ETNs and individual mining stocks.
Our preferred ways to invest in and to trade gold along with the reasoning can be found in the how to buy gold section. Furthermore, our preferred ETFs and ETNs can be found in our Gold & Silver ETF Ranking.
As a reminder, Gold & Silver Trading Alerts are posted before or on each trading day (we usually post them before the opening bell, but we don't promise doing that each day). If there's anything urgent, we will send you an additional small alert before posting the main one.
Thank you.
Przemyslaw Radomski, CFA
Founder, Editor-in-chief

