

Briefly: in our opinion, full (300% of the regular position size) speculative short positions in junior mining stocks are justified from the risk/reward point of view at the moment of publishing this Alert.
The GDXJ ETF was underwater once again, as the junior miners materially underperformed the S&P 500. The former declined by 3.77% on Jun. 28, while the latter declined by 2.01%.
Furthermore, gold declined by 0.20%, silver by 1.71%, and the USD Index rallied by 0.56%. As a result, the PMs continue to perform as expected.
Fireworks Came Early
While it seemed logical that a sense of calm would dominate the financial markets until after the Jul. 4 holiday, asset prices erupted on Jun. 28. Moreover, with the abnormal bouts of volatility highlighting investors’ anxiety, their short-term psyches can’t seem to shake the medium-term fundamentals.
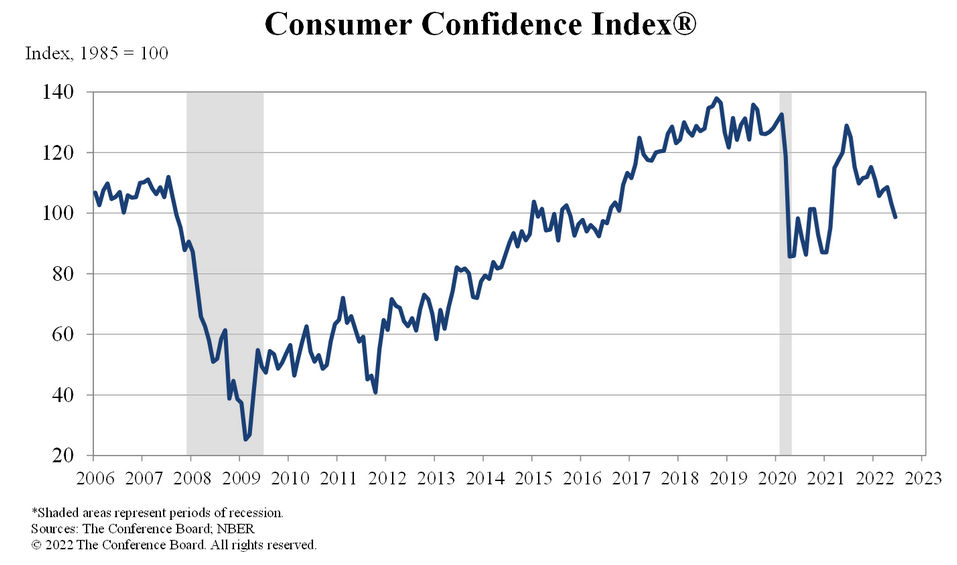
For example, The Conference Board released its Consumer Confidence Index on Jun. 28. The index declined from 103.2 in May to 98.7 in June, reaching its lowest level since February 2021. However, the report was profoundly hawkish for Fed policy. An excerpt read:
“51.3% of consumers said jobs were ‘plentiful,’ down from 51.9%. Conversely, 11.6% of consumers said jobs were ‘hard to get,’ down from 12.4%.”
Therefore, with Americans’ employment prospects holding up much better than their overall sentiment, the data adds fuel to the hawkish fire.
Please see below:
To that point, the report also showed Americans’12-month expected inflation rate hit an all-time high of 8%.
Please see below:
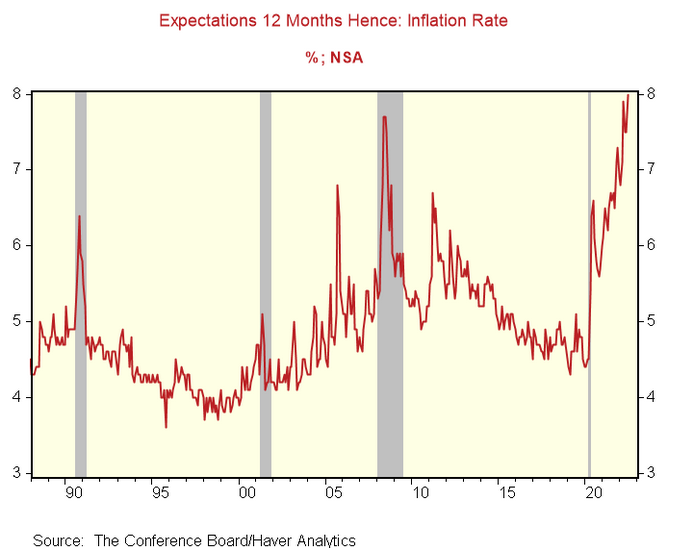
To explain, the red line above tracks The Conference Board’s inflation survey results. If you analyze the right side of the chart, you can see that the metric hit a new record high. As a result, Americans’ inflation expectations fall materially outside of the Fed’s expected range.
Furthermore, I’ve noted on numerous occasions that unanchored inflation is the perfect ingredient for U.S. recessions, and the data from The Conference Board was another stark reminder. For example, Lynn Franco, Senior Director of Economic Indicators at The Conference Board, said:
“While the Present Situation Index was relatively unchanged, the Expectations Index continued its recent downward trajectory – falling to its lowest point in nearly a decade. Consumers’ grimmer outlook was driven by increasing concerns about inflation, in particular rising gas and food prices. Expectations have now fallen well below a reading of 80, suggesting weaker growth in the second half of 2022 as well as a growing risk of recession by year-end.”
Please see below:
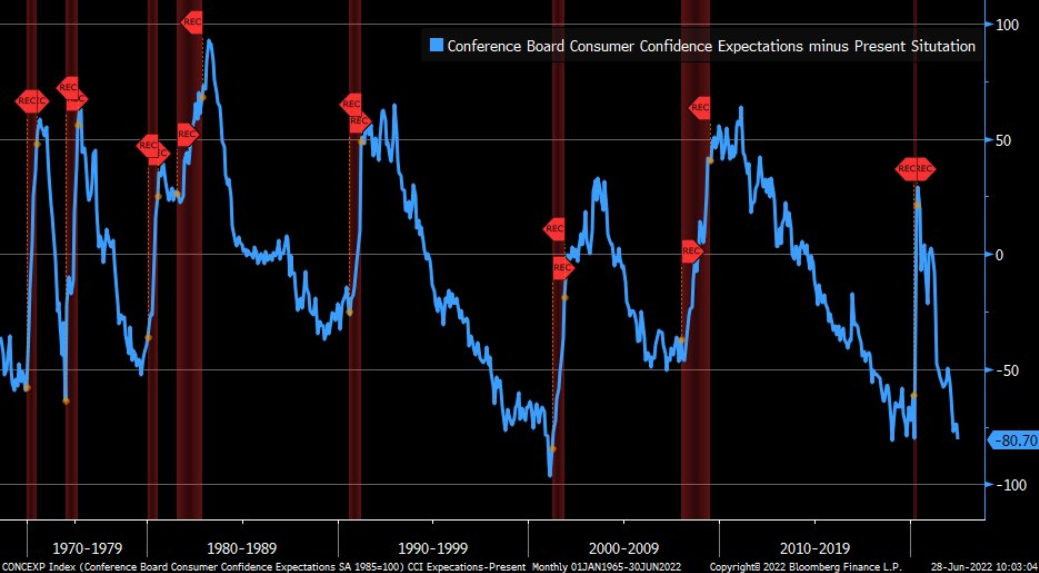
To explain, the blue line above subtracts The Confidence Board’s Present Situation Index from its Expectations Index. In a nutshell: when the blue line is falling, Americans expect the future to be worse than the present.
If you analyze the right side of the chart, you can see that the blue line has fallen off a cliff. Moreover, the vertical red bars highlight how sharp declines in the spread often occur before U.S. recessions. As a result, with inflation preventing the Fed from easing to support the U.S. economy, it’s likely only a matter of time before a recession is confirmed.
Likewise, since the pricing pressures are unlikely to abate without more rate hikes, it may be an extended wait before the Fed turns dovish.
Please see below:
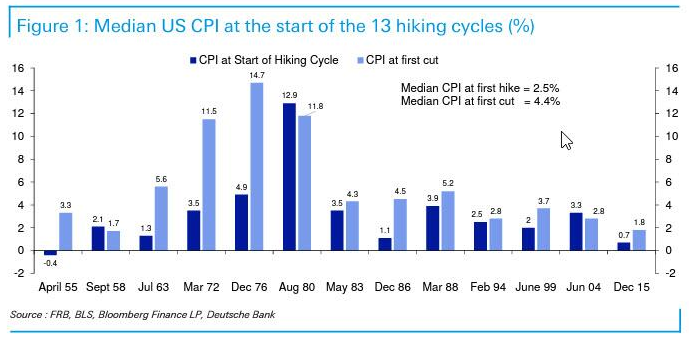
To explain, the dark blue bars above depict the year-over-year (YoY) percentage changes in the headline Consumer Price Index (CPI) when the Fed began its historical rate hike cycles, while the light blue bars above depict the CPI levels when the Fed finally cut rates.
The data shows that the median rate hike occurred with the headline CPI at 2.5% YoY. Therefore, the Fed normally tightens before inflation gets out of control. However, while I warned throughout 2021 that the Fed was materially behind the inflation curve, that ship has already sailed.
More importantly, history shows that the median rate cut occurred with the headline CPI at 4.4% YoY. Furthermore, anything higher than 5% is a material outlier. Therefore, with the headline CPI currently at 8.5% YoY, we’re far from levels where the Fed can run to the rescue. As a result, my comments from Apr. 6 still hold. I wrote:
Please remember that the Fed needs to slow the U.S. economy to calm inflation, and rising asset prices are mutually exclusive to this goal. Therefore, officials should keep hammering the financial markets until investors finally get the message.
Moreover, with the Fed in inflation-fighting mode and reformed doves warning that the U.S. economy “could teeter” as the drama unfolds, the reality is that there is no easy solution to the Fed’s problem. To calm inflation, it has to kill demand. As that occurs, investors should suffer a severe crisis of confidence.
Take Shelter
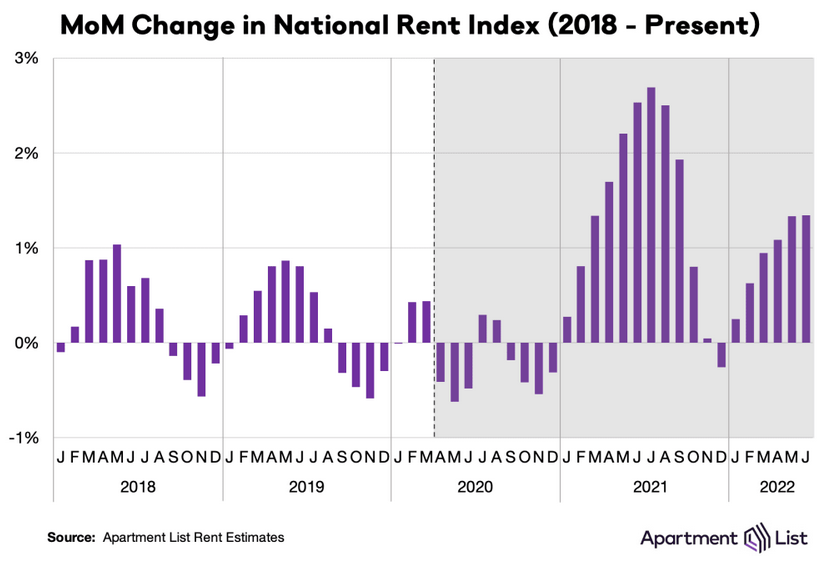
While investors focus much of their attention on food and energy prices, rent inflation is material. For example, the Shelter CPI accounts for more than 30% of the headline CPI’s movement. Moreover, Apartment List released its National Rent Report on Jun. 28. An excerpt read:
“Our national rent index increased by 1.3 percent month-over-month in June, consistent with last month’s increase. In June 2021, our national rent index jumped by 2.5 percent month-over-month, nearly doubling this month’s increase. In contrast, from 2017 to 2019, month-over-month growth in June averaged 0.7 percent, just over half of this month’s increase.”
Please see below:
In addition:
“In the first half of this year, our national rent index has increased by 5.4 percent, well below last year’s 8.8 percent increase over the same months. However, this year’s pace is also still notably faster than that of the years prior to 2021. For comparison, rent growth from January to June totalled 3.1 percent in 2017, 3.6 percent in 2018, 3.4 percent in 2019, and -0.7 percent in 2020.”
Please see below:
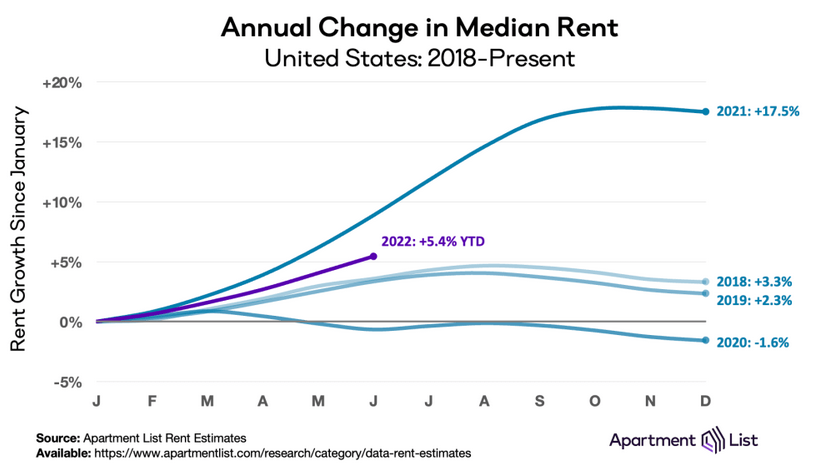
Thus, while 2022 rent inflation lags 2021, the important point is that the six-month percentage change has already eclipsed the annual figures from 2018 and 2019. As a result, more hawkish policy should dominate the headlines in the coming months, and a realization is profoundly bearish for the S&P 500 and the PMs.
A Real Conundrum
I’ve long warned about the impact of U.S. real yields on the PMs. However, plenty of liquidity beneficiaries suffer when the Fed tightens monetary policy. To explain, I wrote on Jan. 12:
[Like] hyper-growth NASDAQ stocks and speculative assets like cryptocurrencies, the PMs, suffer from a similar fundamental affliction. For context, the PMs are less volatile than speculative assets. However, it's important to remember that gold, silver, and mining stocks peaked amid the liquidity-fueled surge in the summer of 2020. Likewise, their uprisings coincided with real interest rates that were at all-time lows at the time.
Conversely, with the Fed's liquidity drain already unfolding and real interest rates poised to rise in the coming months, the PMs should suffer from the likely re-pricings.
Thus, while gold has remained relatively uplifted, silver and the GDXJ ETF have lost material ground in 2022. Likewise, while Americans’ inflation expectations have become unanchored, bond investors understand the implications of the Fed’s rate hike cycle. As a result, the U.S. 10-Year breakeven inflation rate has performed as expected. For context, I wrote on Apr. 20:
The next leg higher for the U.S. 10-Year real yield may occur for the opposite reasons. For example, I noted above that we don’t need nominal yields to rise for real yields to rise. Moreover, while the U.S. 10-Year Treasury yield was undervalued in 2021 and was poised to move higher, the U.S. 10-Year breakeven inflation rate is overvalued in 2022 and is poised to move lower.
Please see below:
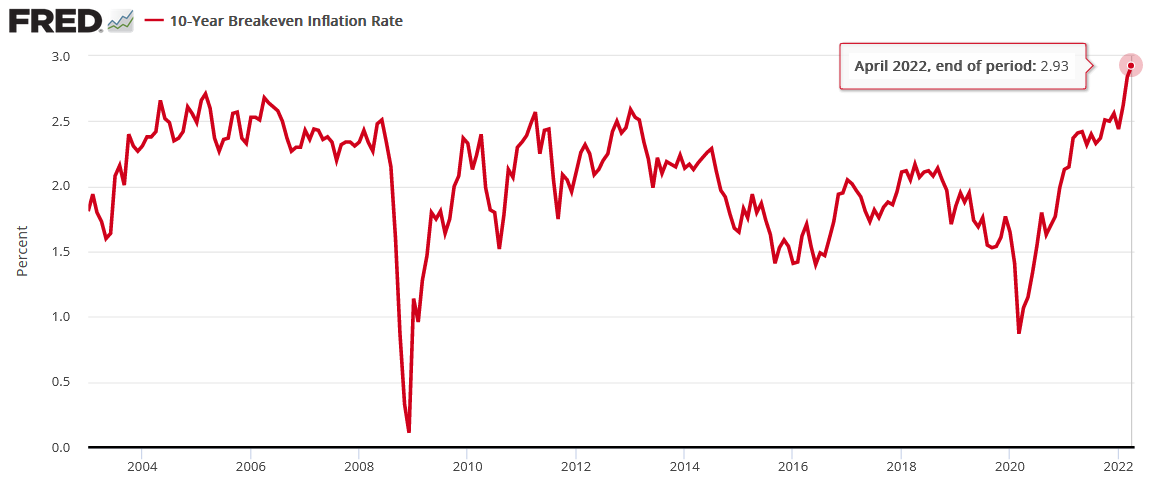
To explain, the U.S. 10-Year breakeven inflation rate ended the Apr. 19 session at 2.93%, only slightly below the all-time high of 2.95% set in March. However, like the PMs, investors’ long-term inflation expectations remain in la-la land.
With the Fed on a hawkish crusade to stifle demand and reduce inflation, the central bank can achieve this goal. The only question is how much economic pain officials are willing to tolerate to get the job done.
Furthermore, with the metric declining on cue, the U.S. 10-Year breakeven inflation rate ended the Jun. 28 session at 2.48%.
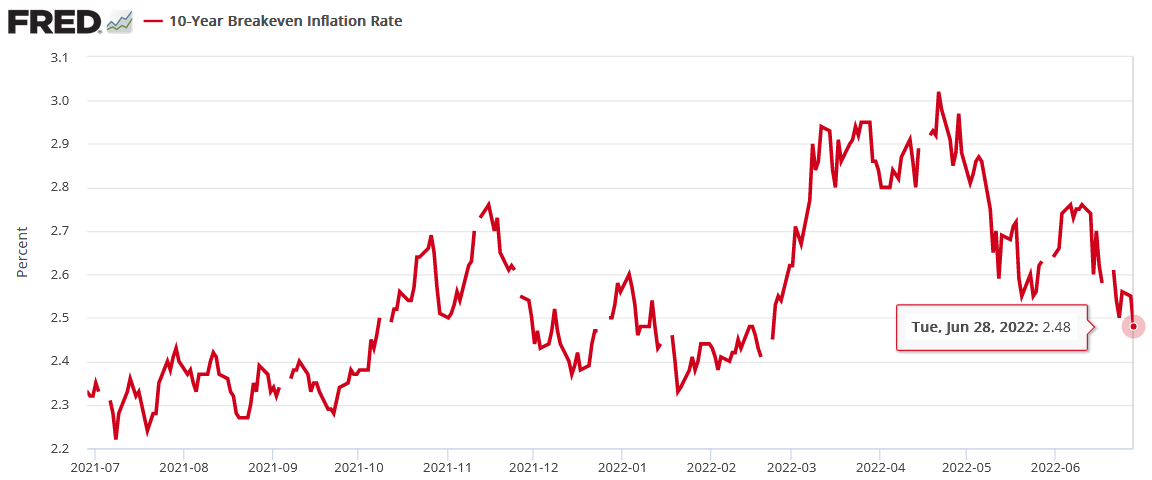
Therefore, with the U.S. 10-Year Treasury yield ending the day at 3.20%, the U.S. 10-Year real yield remains elevated at 0.72%. However, the Fed needs to push the metric higher to curb inflation, and a realization should profoundly impact the NASDAQ 100, the S&P 500, and the GDXJ ETF.
Please see below:
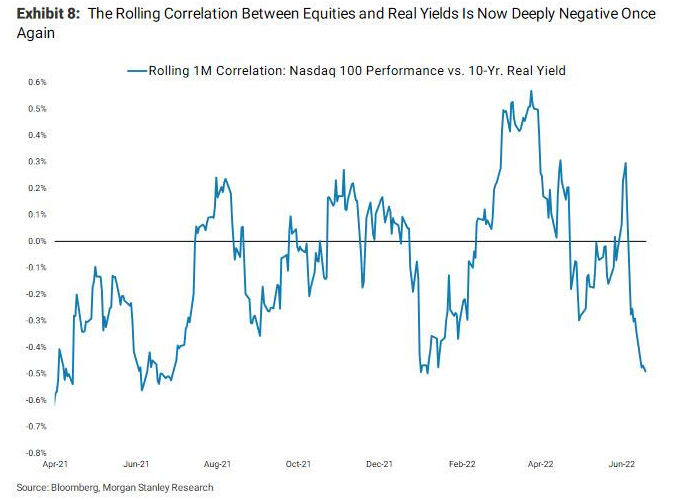
To explain, the blue line above tracks the rolling one-month correlation between the NASDAQ 100 and the U.S. 10-Year real yield. If you analyze the right side of the chart, you can see that the blue line has fallen sharply, indicating that a higher U.S. 10-Year real yield has sent the NASDAQ 100 running in the opposite direction. Likewise, with the GDXJ ETF a liquidity beneficiary that’s more correlated with the general stock market, a continuation of the theme should result in lower lows over the medium term.
The Bottom Line
Stocks sold off on Jun. 28, as asset prices continued to whipsaw violently in both directions. However, the GDXJ ETF has fallen more on down days and risen less on up days than the S&P 500. As a result, the underperformance is profoundly bearish, and the dynamic should continue in the months ahead.
In conclusion, the PMs declined on Jun. 28, as pessimism reigned. Moreover, with the USD Index rallying, the PMs’ medium-term fundamentals continue to worsen. Therefore, a final flush should occur before long-term buying opportunities emerge.
Overview of the Upcoming Part of the Decline
- It seems to me that the precious metals market is already in its medium-term decline that is about to take it much lower (to the 2021 lows in case of gold - $1,650 - $1,700)
- If we see a situation where miners slide in a meaningful and volatile way while silver doesn’t (it just declines moderately), I plan to – once again – switch from short positions in miners to short positions in silver. At this time, it’s too early to say at what price levels this could take place and if we get this kind of opportunity at all – perhaps with gold prices close to $1,600.
- I plan to exit all remaining short positions once gold shows substantial strength relative to the USD Index while the latter is still rallying. This may be the case with gold close to $1,400. I expect silver to fall the hardest in the final part of the move. This moment (when gold performs very strongly against the rallying USD and miners are strong relative to gold after its substantial decline) is likely to be the best entry point for long-term investments, in my view. This can also happen with gold close to $1,400, but at the moment it’s too early to say with certainty.
- The above is based on the information available today, and it might change in the following days/weeks.
You will find my general overview of the outlook for gold on the chart below:
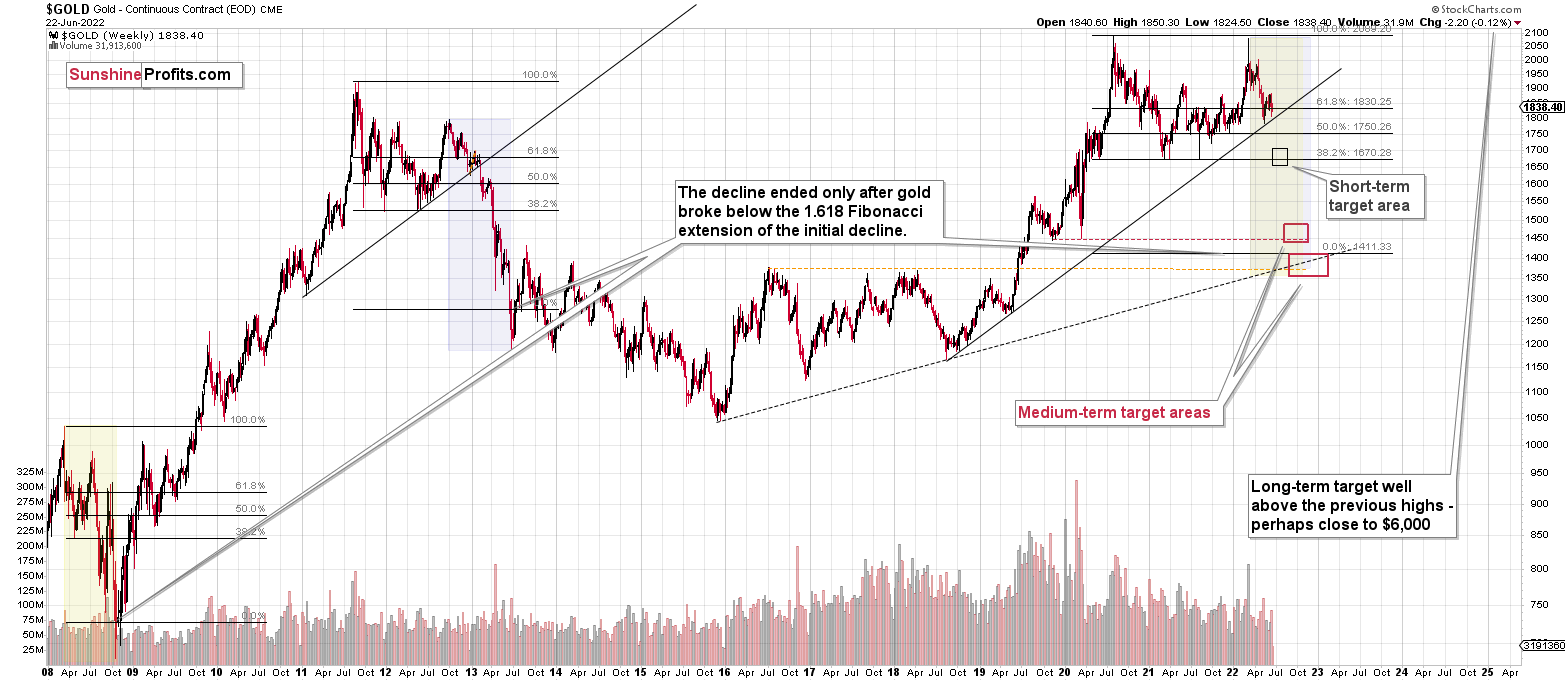
Please note that the above timing details are relatively broad and “for general overview only” – so that you know more or less what I think and how volatile I think the moves are likely to be – on an approximate basis. These time targets are not binding or clear enough for me to think that they should be used for purchasing options, warrants, or similar instruments.
Summary
Summing up, it seems to me that the short-term rally in the precious metals market is over, and the decline will now continue. And the tiny correction’s days are likely numbered, too.
I previously wrote that the profits from the previous long position (congratulations once again) were likely to further enhance the profits on this huge decline, and that’s exactly what happened. The profit potential with regard to the upcoming gargantuan decline remains huge.
As investors are starting to wake up to reality, the precious metals sector (particularly junior mining stocks) is declining sharply. Here are the key aspects of the reality that market participants have ignored:
- rising real interest rates,
- rising USD Index values.
Both of the aforementioned are the two most important fundamental drivers of the gold price. Since neither the USD Index nor real interest rates are likely to stop rising anytime soon (especially now that inflation has become highly political), the gold price is likely to fall sooner or later. Given the analogy to 2012 in gold, silver, and mining stocks, “sooner” is the more likely outcome.
After the final sell-off (that takes gold to about $1,350-$1,500), I expect the precious metals to rally significantly. The final part of the decline might take as little as 1-5 weeks, so it's important to stay alert to any changes.
Also, on an administrative note, due to Przemysław Radomski’s travel schedule, Wednesday’s regular Gold & Silver Trading Alert covers the fundamental part of the analysis. However, if anything major happens and it impacts his views on the positions that are currently justified from the risk-to-reward point of view, he’ll send you a quick intraday message.
As always, we'll keep you – our subscribers – informed.
To summarize:
Trading capital (supplementary part of the portfolio; our opinion): Full speculative short positions (300% of the full position) in junior mining stocks are justified from the risk to reward point of view with the following binding exit profit-take price levels:
Mining stocks (price levels for the GDXJ ETF): binding profit-take exit price: $27.32; stop-loss: none (the volatility is too big to justify a stop-loss order in case of this particular trade)
Alternatively, if one seeks leverage, we’re providing the binding profit-take levels for the JDST (2x leveraged). The binding profit-take level for the JDST: $18.35; stop-loss for the JDST: none (the volatility is too big to justify a SL order in case of this particular trade).
For-your-information targets (our opinion; we continue to think that mining stocks are the preferred way of taking advantage of the upcoming price move, but if for whatever reason one wants / has to use silver or gold for this trade, we are providing the details anyway.):
Silver futures downside profit-take exit price: $17.22
SLV profit-take exit price: $16.22
ZSL profit-take exit price: $41.47
Gold futures downside profit-take exit price: $1,706
HGD.TO – alternative (Canadian) 2x inverse leveraged gold stocks ETF – the upside profit-take exit price: $11.87
HZD.TO – alternative (Canadian) 2x inverse leveraged silver ETF – the upside profit-take exit price: $31.87
Long-term capital (core part of the portfolio; our opinion): No positions (in other words: cash)
Insurance capital (core part of the portfolio; our opinion): Full position
Whether you’ve already subscribed or not, we encourage you to find out how to make the most of our alerts and read our replies to the most common alert-and-gold-trading-related-questions.
Please note that we describe the situation for the day that the alert is posted in the trading section. In other words, if we are writing about a speculative position, it means that it is up-to-date on the day it was posted. We are also featuring the initial target prices to decide whether keeping a position on a given day is in tune with your approach (some moves are too small for medium-term traders, and some might appear too big for day-traders).
Additionally, you might want to read why our stop-loss orders are usually relatively far from the current price.
Please note that a full position doesn't mean using all of the capital for a given trade. You will find details on our thoughts on gold portfolio structuring in the Key Insights section on our website.
As a reminder - "initial target price" means exactly that - an "initial" one. It's not a price level at which we suggest closing positions. If this becomes the case (as it did in the previous trade), we will refer to these levels as levels of exit orders (exactly as we've done previously). Stop-loss levels, however, are naturally not "initial", but something that, in our opinion, might be entered as an order.
Since it is impossible to synchronize target prices and stop-loss levels for all the ETFs and ETNs with the main markets that we provide these levels for (gold, silver and mining stocks - the GDX ETF), the stop-loss levels and target prices for other ETNs and ETF (among other: UGL, GLL, AGQ, ZSL, NUGT, DUST, JNUG, JDST) are provided as supplementary, and not as "final". This means that if a stop-loss or a target level is reached for any of the "additional instruments" (GLL for instance), but not for the "main instrument" (gold in this case), we will view positions in both gold and GLL as still open and the stop-loss for GLL would have to be moved lower. On the other hand, if gold moves to a stop-loss level but GLL doesn't, then we will view both positions (in gold and GLL) as closed. In other words, since it's not possible to be 100% certain that each related instrument moves to a given level when the underlying instrument does, we can't provide levels that would be binding. The levels that we do provide are our best estimate of the levels that will correspond to the levels in the underlying assets, but it will be the underlying assets that one will need to focus on regarding the signs pointing to closing a given position or keeping it open. We might adjust the levels in the "additional instruments" without adjusting the levels in the "main instruments", which will simply mean that we have improved our estimation of these levels, not that we changed our outlook on the markets. We are already working on a tool that would update these levels daily for the most popular ETFs, ETNs and individual mining stocks.
Our preferred ways to invest in and to trade gold along with the reasoning can be found in the how to buy gold section. Furthermore, our preferred ETFs and ETNs can be found in our Gold & Silver ETF Ranking.
As a reminder, Gold & Silver Trading Alerts are posted before or on each trading day (we usually post them before the opening bell, but we don't promise doing that each day). If there's anything urgent, we will send you an additional small alert before posting the main one.
Thank you.
Przemyslaw Radomski, CFA
Founder, Editor-in-chief

