

Briefly: In our opinion, short (full) speculative positions in gold and silver are justified from the risk/reward point of view. We think that no speculative positions are currently justified from the risk/reward perspective in the mining stocks.
Gold and mining stocks moved to new highs last week. Gold even broke above its declining resistance line and closed the week above it. How can we profit from this situation?
More or less, in the same way we’ve been doing it in the recent months and years – by analyzing the situation thoroughly, checking the outlook and positioning ourselves accordingly by focusing on the part of the market that provides the greatest opportunity and most favorable risk/reward ratio. Let’s take a look at the charts (charts courtesy of http://stockcharts.com).
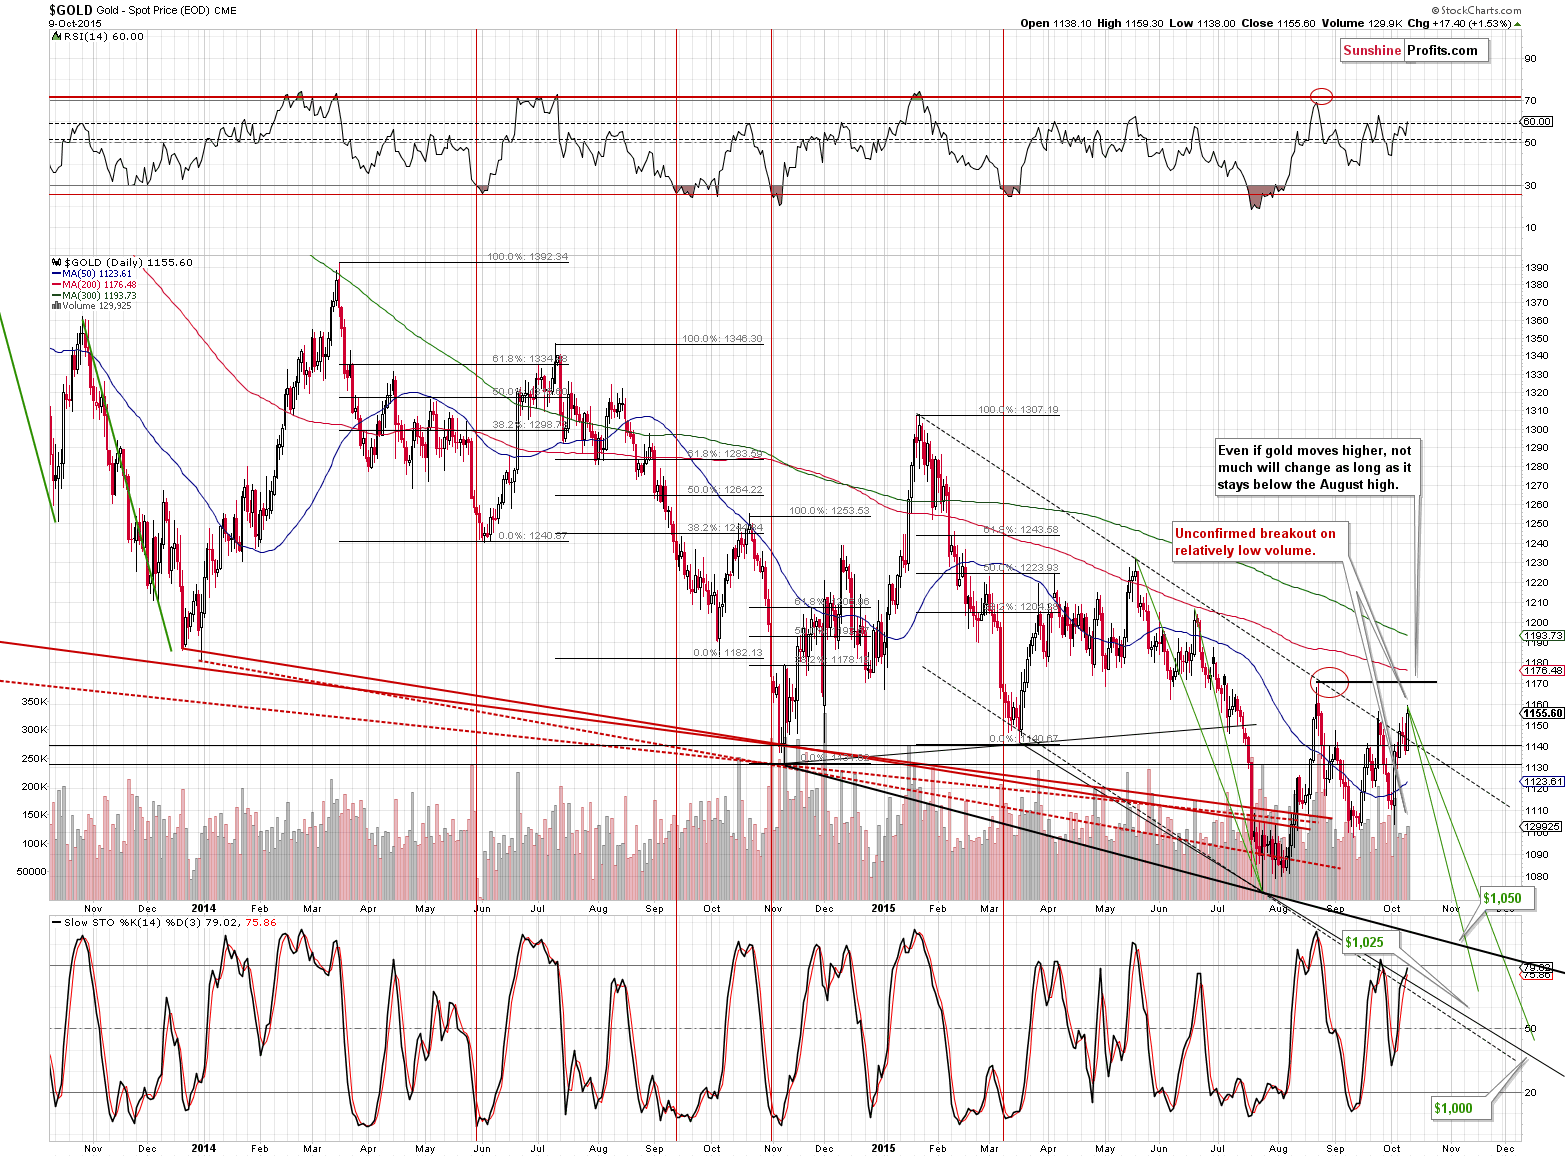
Gold has indeed moved above the declining resistance line and closed above it. It was only one daily close above it and the volume that accompanied the “breakout” was relatively low. Consequently, the “breakout” didn’t change much even though it seems significant at the first sight. Moreover, please note that gold didn’t move above the August high.
As you can see, the above chart is not as bullish as it seems at the first sight and… It’s the only chart that we have that features any change whatsoever over what we already wrote.
Gold moved higher in today’s pre-market trading, but it didn’t move above the August high, so this move didn’t change much.
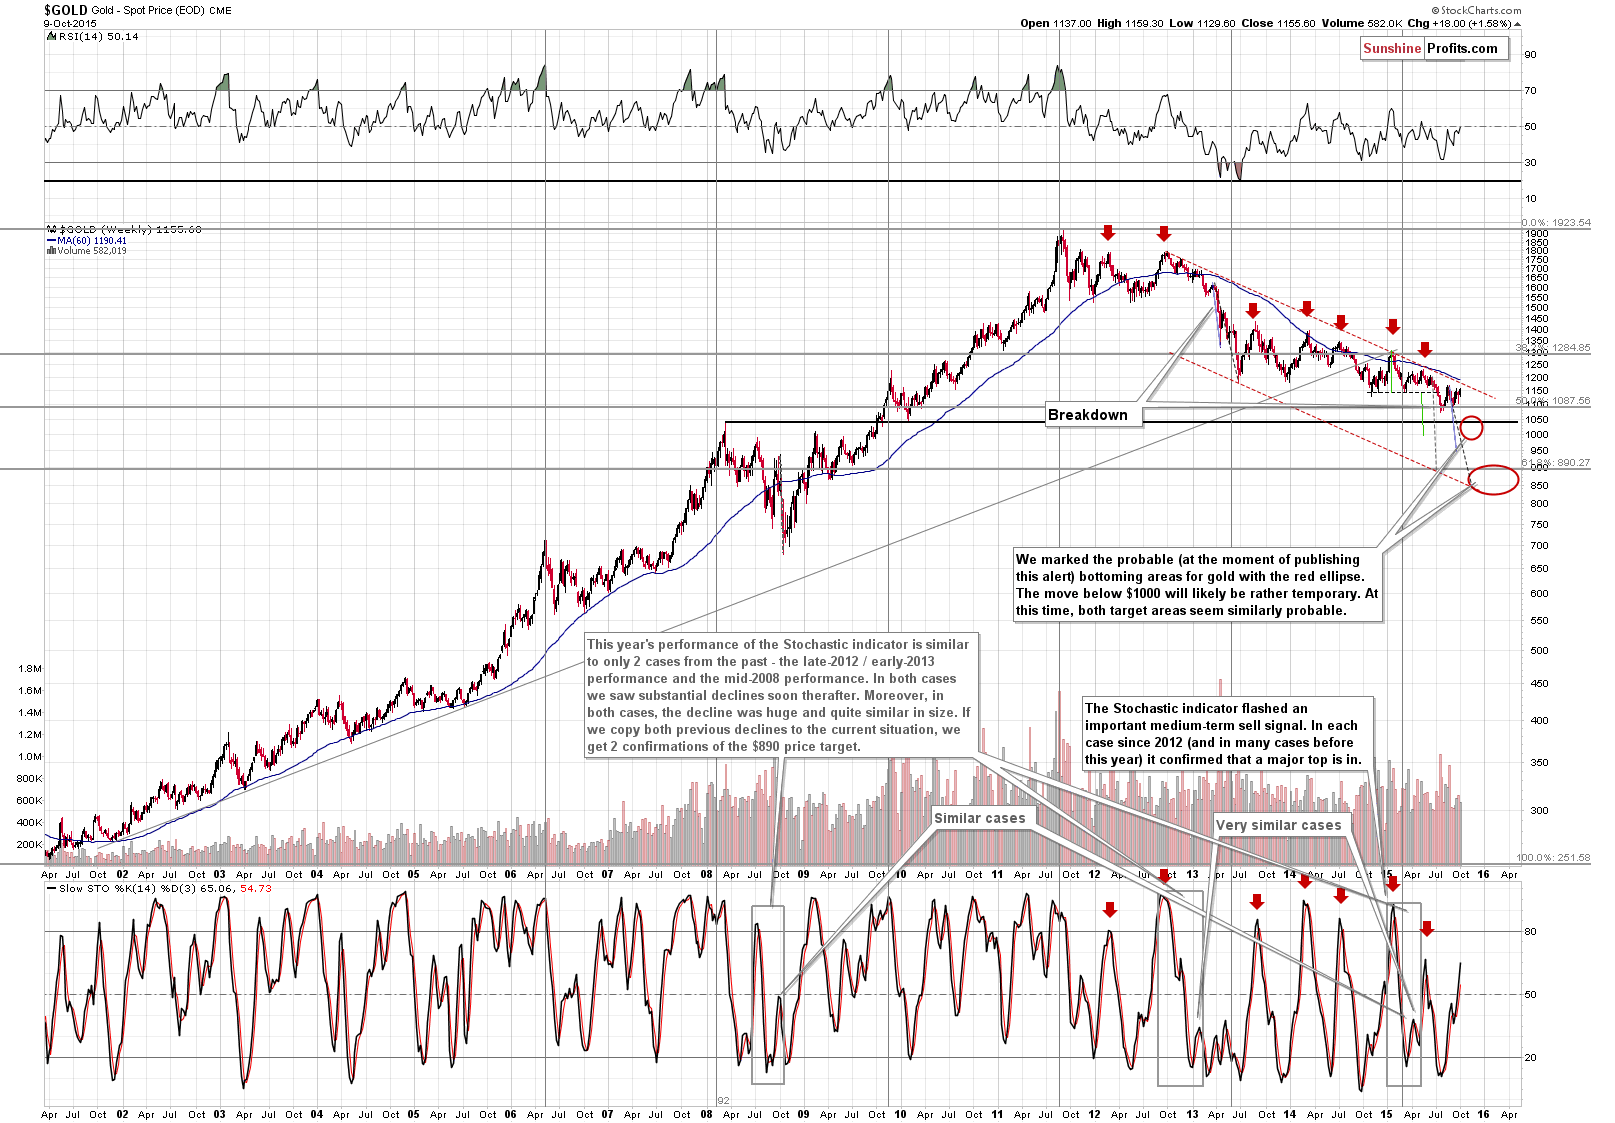
There were no changes on the long-term gold chart. Gold remains below the declining resistance line – there was no breakout and the medium-term outlook remains bearish.
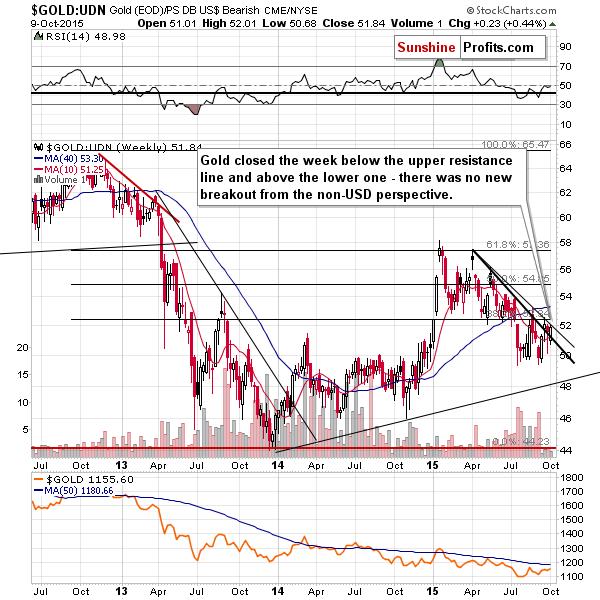
The price of gold seen from the non-USD perspective is not encouraging either. There was a small breakout above the lower of the declining resistance lines (as had been the case recently) but there was no breakout above the upper line (the one based on the intra-day highs). Consequently, nothing changed from the non-USD perspective, and the medium-term trend remains down.
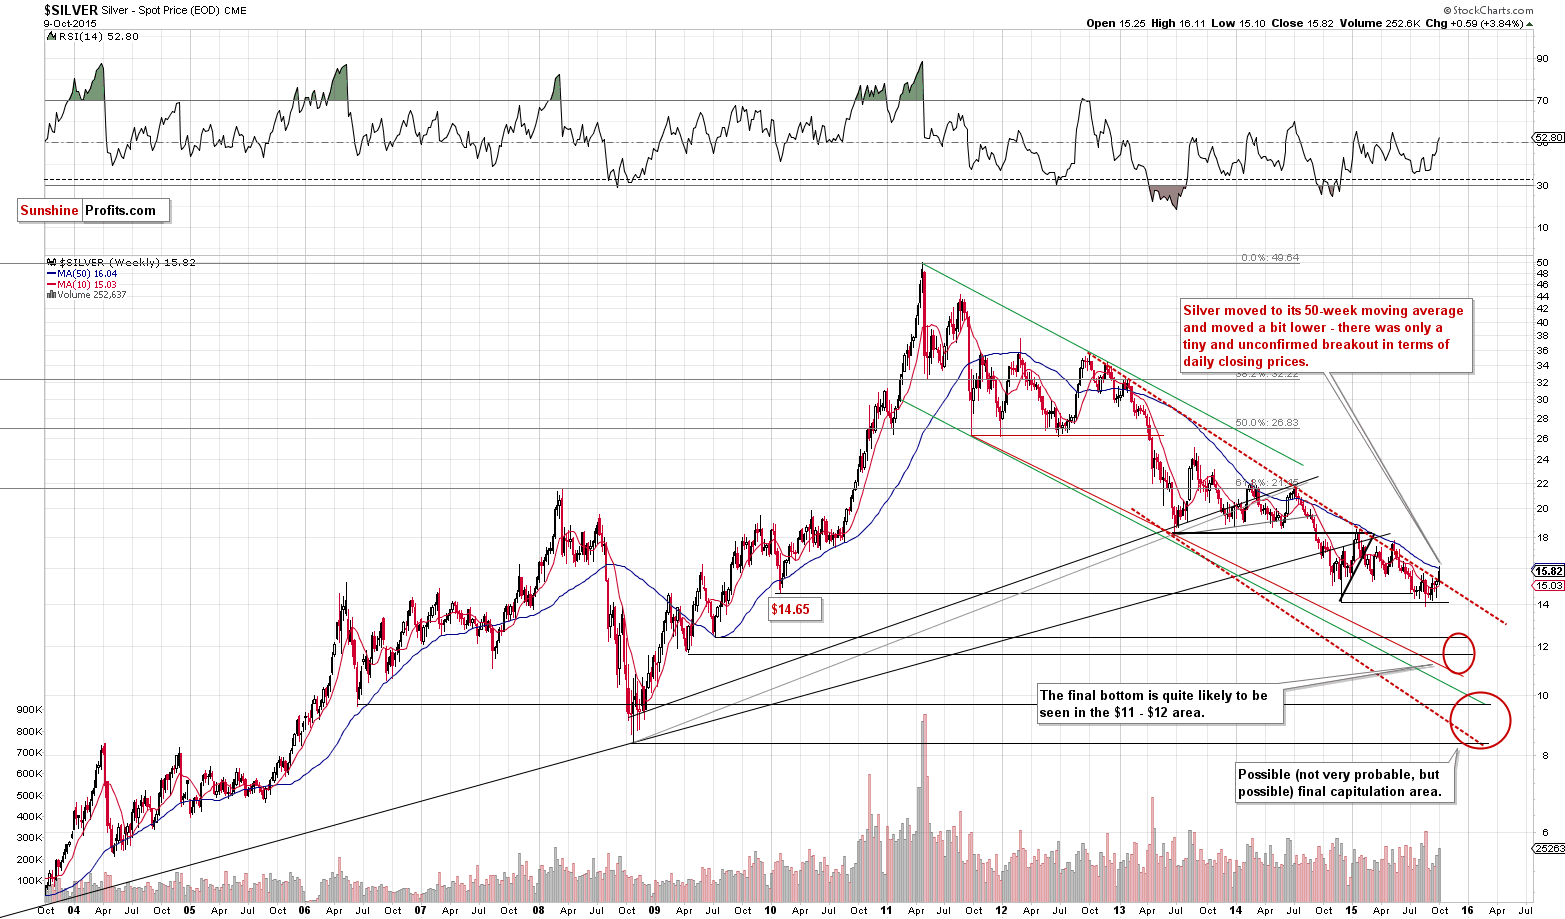
Silver’s long-term chart didn’t change either. Silver tried to move above the 50-week moving average just like it did in mid-2014 and mid-2015 and failed. The medium-term outlook remains bearish.
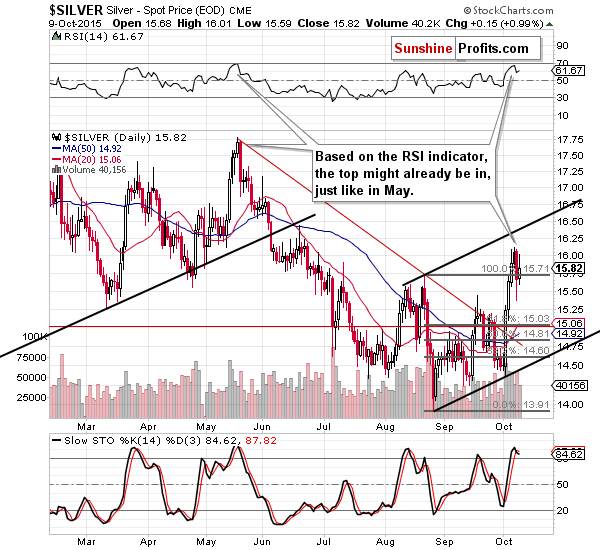
On Friday we wrote the following about silver’s short-term chart:
Silver moved sharply lower initially (and this showed why we were reluctant to temporarily close a short position in silver – because the move could have been even bigger) but finally corrected about half of the decline before the end of the session. Is the reversal bullish? Not really – such plunges were seen in the early stages of declines, even if they were subsequently corrected. The situation in silver deteriorated, but only a bit.
Silver moved back to $16 in today’s pre-market trading, but since double tops were quite common previously, we don’t necessarily view this as a sign of strength.
The above remains up-to-date – silver closed well below the $16 level, so it’s not even a double top that we would be discussing. We continue to view silver’s breakout above the August high as not important and not bullish as the vast majority of silver’s breakouts were invalidated and followed by significant and sharp declines.
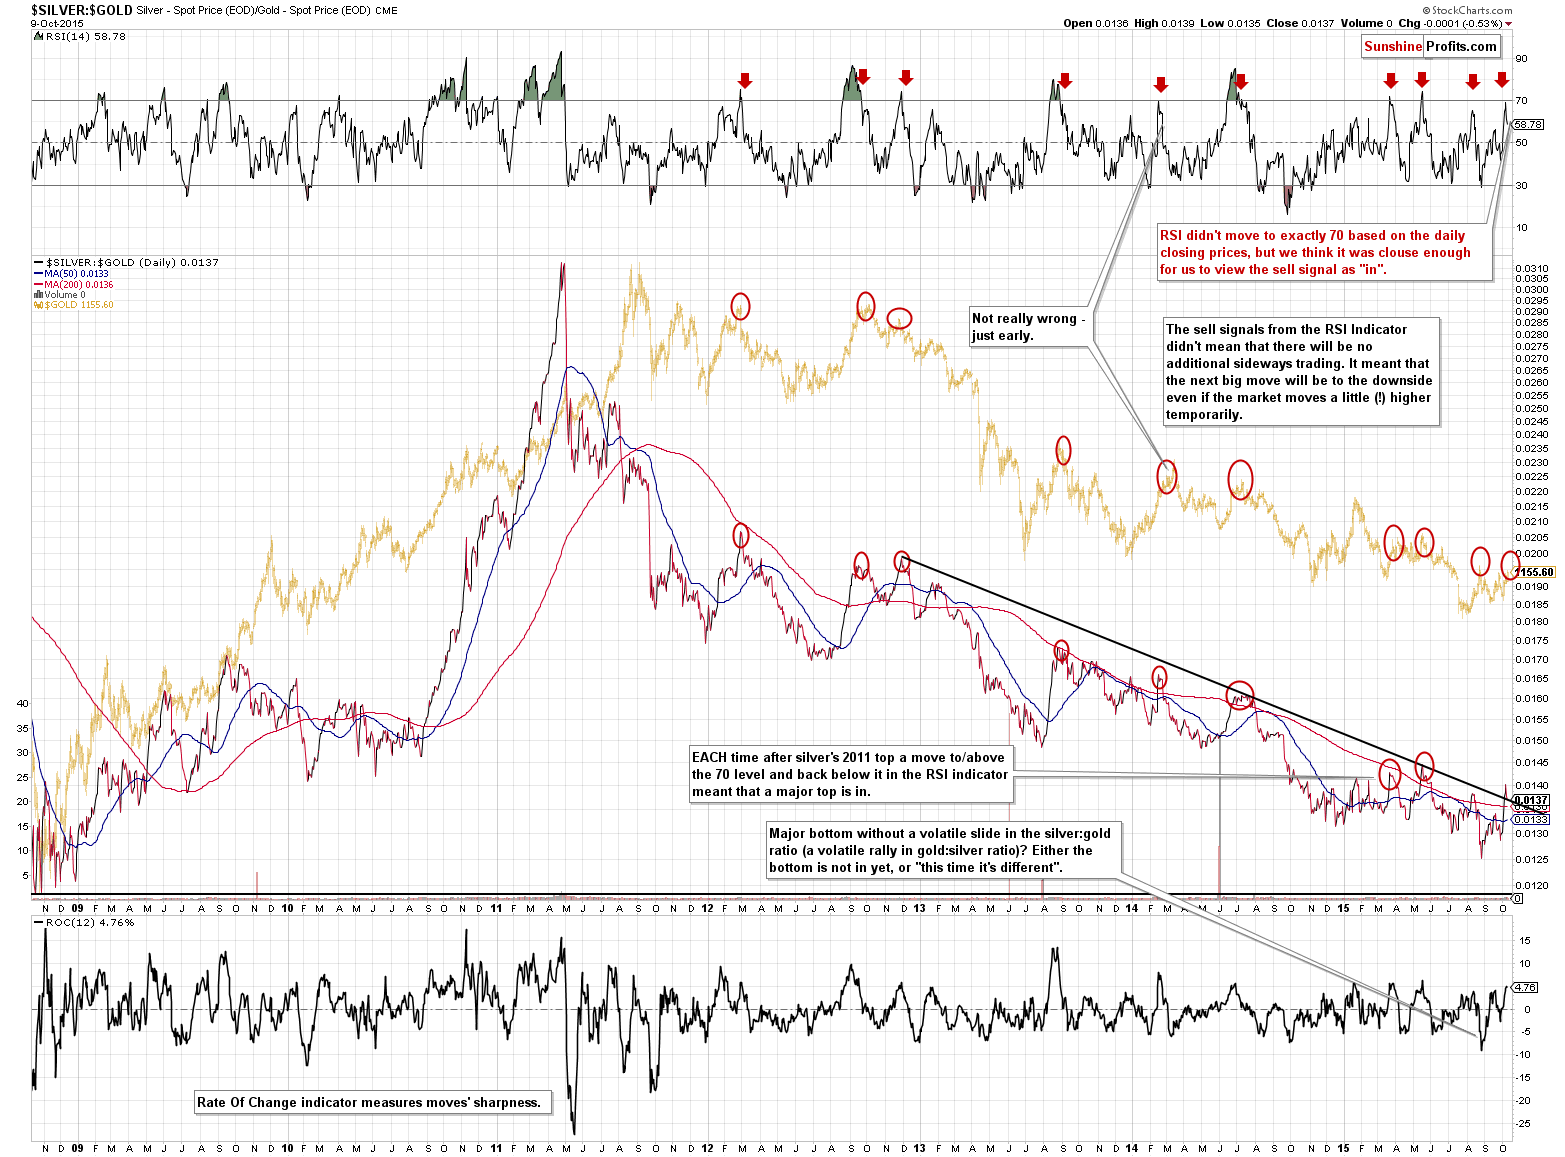
As far as silver’s relative performance to gold is concerned, we wrote the following on Friday:
The situation deteriorated clearly in the silver to gold ratio as both the ratio and the RSI turned south. In the case of the latter it’s important as the indicator was almost at the 70 level and these reversals close to the 70 level were seen either at local tops or right before them in the past. The implications are bearish. If silver outperforms gold today, then we might see a move to the 70 level which would confirm the bearish implications.
The above remains up-to-date. Silver didn’t outperform gold on Friday, but the top in the RSI indicator remains quite visible.
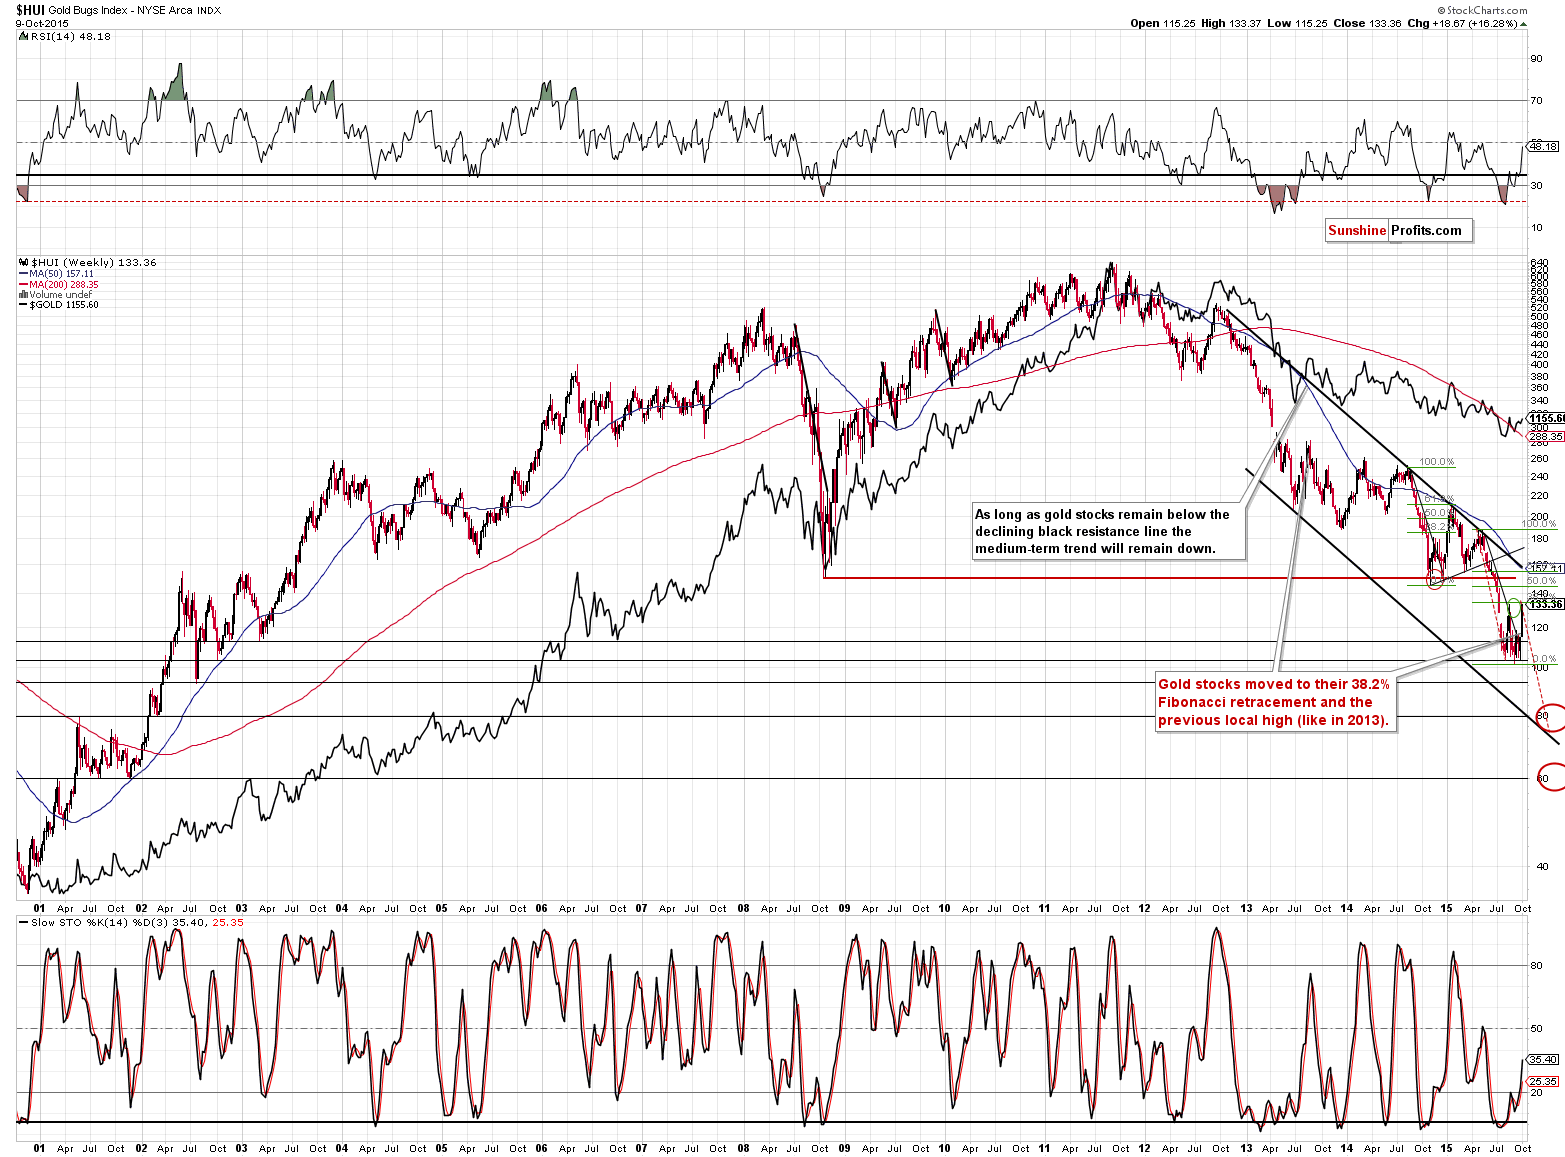
In the previous alerts we discussed 2 analogies that may be currently in play in the case of mining stocks:
This year’s big decline is somewhat similar to the late-2014 decline – both declines were similar in size and both initially corrected to their declining resistance line and more or less to the 38.2% Fibonacci retracement level only to decline back to their previous lows.
If this self-similarity is to continue, the HUI Index could move higher, up to 156 and… still remain (!) in a medium-term downtrend. Consequently, this analogy doesn’t really have important medium- or long-term implications. It does, however, have bullish short-term implications as a 30+ index point move is significant from the day-to-day perspective. Will gold stocks really rally up to 156 or so? The very important thing here is that this is not a precise prediction – the more distant target we have in the case of a self-similar pattern, the less precise it becomes. The self-similar pattern doesn’t have to work very precisely, it can be in place but only to a more-or-less extent. For instance, we could see a move to the August high, just like it was the case in silver, or we could see a reversal right away (after all, we already saw some strength after the second local bottom).
Speaking of analogous patterns, if we look at the RSI in order to see what past situations were similar to what we have today, we’ll see that in the last decade there was only one time when the RSI was below 20 – after which it moved back above 40 – in 2012. Given this analogy, we are in a similar situation to what we saw in the middle of 2012. Back then, when the RSI was close to 40, a local top was very close (in fact, prices higher than the ones at that top have not been seen up to this day). Back in 2012, the HUI topped at its previous local high, which at this time would imply a move to 130 or so.
On the long-term HUI Index chart we can see that it more or less moved to its previous local top. So far both of the mentioned analogies remain in place and the jury is still out as far as discussing whether the local top is already in or not is concerned.
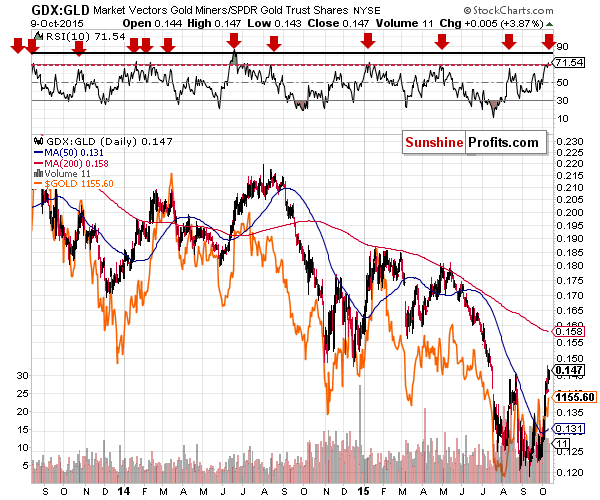
In Friday’s alert we wrote the following:
The GDX to GLD ratio flashed an imprecise sell signal as the RSI indicator moved close to the red horizontal line. In the past, reaching such levels meant that we are close to the local top. However, since this signal was not very precise, it doesn’t tell us if the top was indeed formed yesterday or will be formed within the next several days.
Now the sell signal is much more precise – the RSI moved above the 70 level and the implications are more bearish than they were based on Thursday’s closing prices.
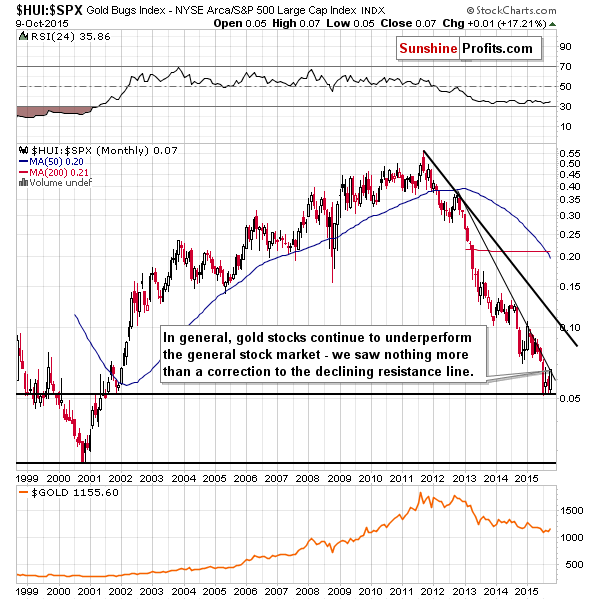
The performance of gold stocks relative to other stocks also suggests a turnaround. Gold stocks performed well on a relative basis… Unless you take a look at the big picture and realize that this outperformance was actually a correction in a major downtrend. There was no breakout and the declining resistance line was reached, which does not bode well for the precious metals sector.
Before summarizing, let’s take a look at the USD Index.
On Friday, we wrote the following:
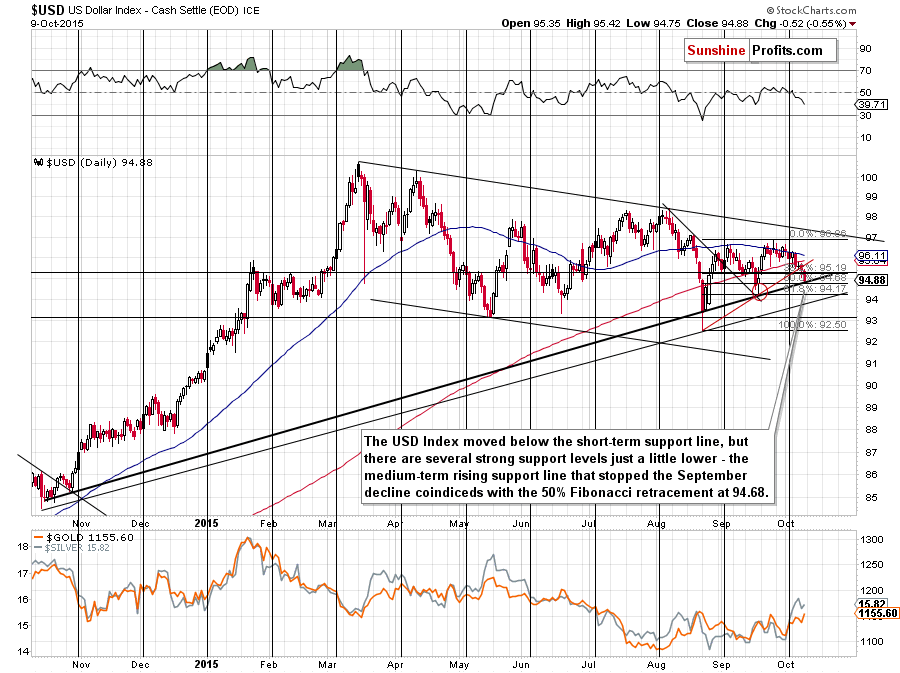
The USD Index moved lower in today’s pre-market trading and at the moment of writing these words it’s at about 94.90. The USD broke below the very short-term red support line, but there are several support levels just around the corner. The medium-term rising support line based on the lows (in terms of daily closing prices) of Oct. 2014 and Aug. 2015 is at 94.68, which is where we also have the Fibonacci 50% retracement. This support level is more significant than the rising red support/resistance line, so we don’t think that today’s decline (and yesterday’s one) changed much.
The USD Index moved even lower and it even moved to the rising support line (and almost moved to the 50% Fibonacci retracement level on Friday – it managed to reach this level in today’s pre-market trading), which is quite significant. It suggests that USD is likely to turn around and trigger a decline in commodity prices (including the precious metals sector).
Consequently, although it might seem that a lot happened (especially in gold) on Friday, actually not much changed and we think that the summary of the previous issue still correctly describes the situation today:
Summing up, while it continues to seem justified from the risk/reward perspective to wait out any temporary strength in gold and silver, it seems no positions are justified in the case of the mining stocks due to the bullish outlook for the general stock market. Perhaps we have just seen the local top (based on silver’s decline), but we haven’t seen enough sell signals to justify moving back on the short side of the market in case of the mining stocks. We might be very close to this moment, though.
Consequently, while we are not going long, we do think that staying on the sidelines in the case of the trading capital dedicated to the mining stocks, while keeping the existing short positions in gold and silver, is currently justified from the long-term perspective. Despite this rather long consolidation, it seems that the next big move will be to the downside and that significant profits will be made thanks to this move – likely higher than the ones from the previous trade and perhaps just as big (or higher) than from the previous short trade.
As always, we will keep you – our subscribers – updated.
To summarize:
Trading capital (our opinion): Short position (full) position in gold and silver (but not one in the mining stocks) is justified from the risk/reward perspective with the following stop-loss orders and initial (! – this means that reaching them doesn’t automatically close the position) target prices:
- Gold: initial target price: $1,050; stop-loss: $1,213, initial target price for the DGLD ETN: $98.37; stop loss for the DGLD ETN $65.60
- Silver: initial target price: $12.60; stop-loss: $16.73, initial target price for the DSLV ETN: $96.67; stop loss for DSLV ETN $40.28
Long-term capital (our opinion): No positions
Insurance capital (our opinion): Full position
Please note that a full position doesn’t mean using all of the capital for a given trade. You will find details on our thoughts on gold portfolio structuring in the Key Insights section on our website.
As a reminder – “initial target price” means exactly that – an “initial” one, it’s not a price level at which we suggest closing positions. If this becomes the case (like it did in the previous trade) we will refer to these levels as levels of exit orders (exactly as we’ve done previously). Stop-loss levels, however, are naturally not “initial”, but something that, in our opinion, might be entered as an order.
Since it is impossible to synchronize target prices and stop-loss levels for all the ETFs and ETNs with the main markets that we provide these levels for (gold, silver and mining stocks – the GDX ETF), the stop-loss levels and target prices for other ETNs and ETF (among other: UGLD, DGLD, USLV, DSLV, NUGT, DUST, JNUG, JDST) are provided as supplementary, and not as “final”. This means that if a stop-loss or a target level is reached for any of the “additional instruments” (DGLD for instance), but not for the “main instrument” (gold in this case), we will view positions in both gold and DGLD as still open and the stop-loss for DGLD would have to be moved lower. On the other hand, if gold moves to a stop-loss level but DGLD doesn’t, then we will view both positions (in gold and DGLD) as closed. In other words, since it’s not possible to be 100% certain that each related instrument moves to a given level when the underlying instrument does, we can’t provide levels that would be binding. The levels that we do provide are our best estimate of the levels that will correspond to the levels in the underlying assets, but it will be the underlying assets that one will need to focus on regarding the sings pointing to closing a given position or keeping it open. We might adjust the levels in the “additional instruments” without adjusting the levels in the “main instruments”, which will simply mean that we have improved our estimation of these levels, not that we changed our outlook on the markets. We are already working on a tool that would update these levels on a daily basis for the most popular ETFs, ETNs and individual mining stocks.
Our preferred ways to invest in and to trade gold along with the reasoning can be found in the how to buy gold section. Additionally, our preferred ETFs and ETNs can be found in our Gold & Silver ETF Ranking.
As always, we'll keep you - our subscribers - updated should our views on the market change. We will continue to send out Gold & Silver Trading Alerts on each trading day and we will send additional Alerts whenever appropriate.
The trading position presented above is the netted version of positions based on subjective signals (opinion) from your Editor, and the Tools and Indicators.
As a reminder, Gold & Silver Trading Alerts are posted before or on each trading day (we usually post them before the opening bell, but we don't promise doing that each day). If there's anything urgent, we will send you an additional small alert before posting the main one.
=====
Latest Free Trading Alerts:
Last week, the Trans-Pacific Partnership (TPP) was finally signed. What does it mean for the global economy and the gold market?
=====
Hand-picked precious-metals-related links:
Search for solutions to modernize gold trading gets kicked into high gear
South Africa’s AMCU votes to strike in gold sector
US still holds $54 billion of Germany's gold
=====
In other news:
Fed’s Fischer Says Economy May Merit Liftoff Later This Year
ECB's Coeure says too early to decide on more stimulus - CNBC
Fed should not raise interest rates just yet: China Finmin
Here's where you're wrong about China
'Something wrong' with ECB asset quality review: Official
One Way Emerging Markets Are Shooting Themselves in the Foot
Commodity contagion sparks second credit crisis as investors panic
=====
Thank you.
Sincerely,
Przemyslaw Radomski, CFA
Founder, Editor-in-chief
Gold & Silver Trading Alerts
Forex Trading Alerts
Oil Investment Updates
Oil Trading Alerts

