

Briefly: In our opinion, short (full) speculative positions in gold and silver are justified from the risk/reward point of view. We think that no speculative positions are currently justified from the risk/reward perspective in the mining stocks.
Miners rallied in the first part of yesterday’s session only to disappoint later on and finally close the day lower. Silver, on the other hand, plunged initially, but recovered a large part of the decline before the end of the session – what does it imply?
Overall, not much. It seems that the situation deteriorated, but not to a great extent. Let’s take a look at the charts (charts courtesy of http://stockcharts.com).
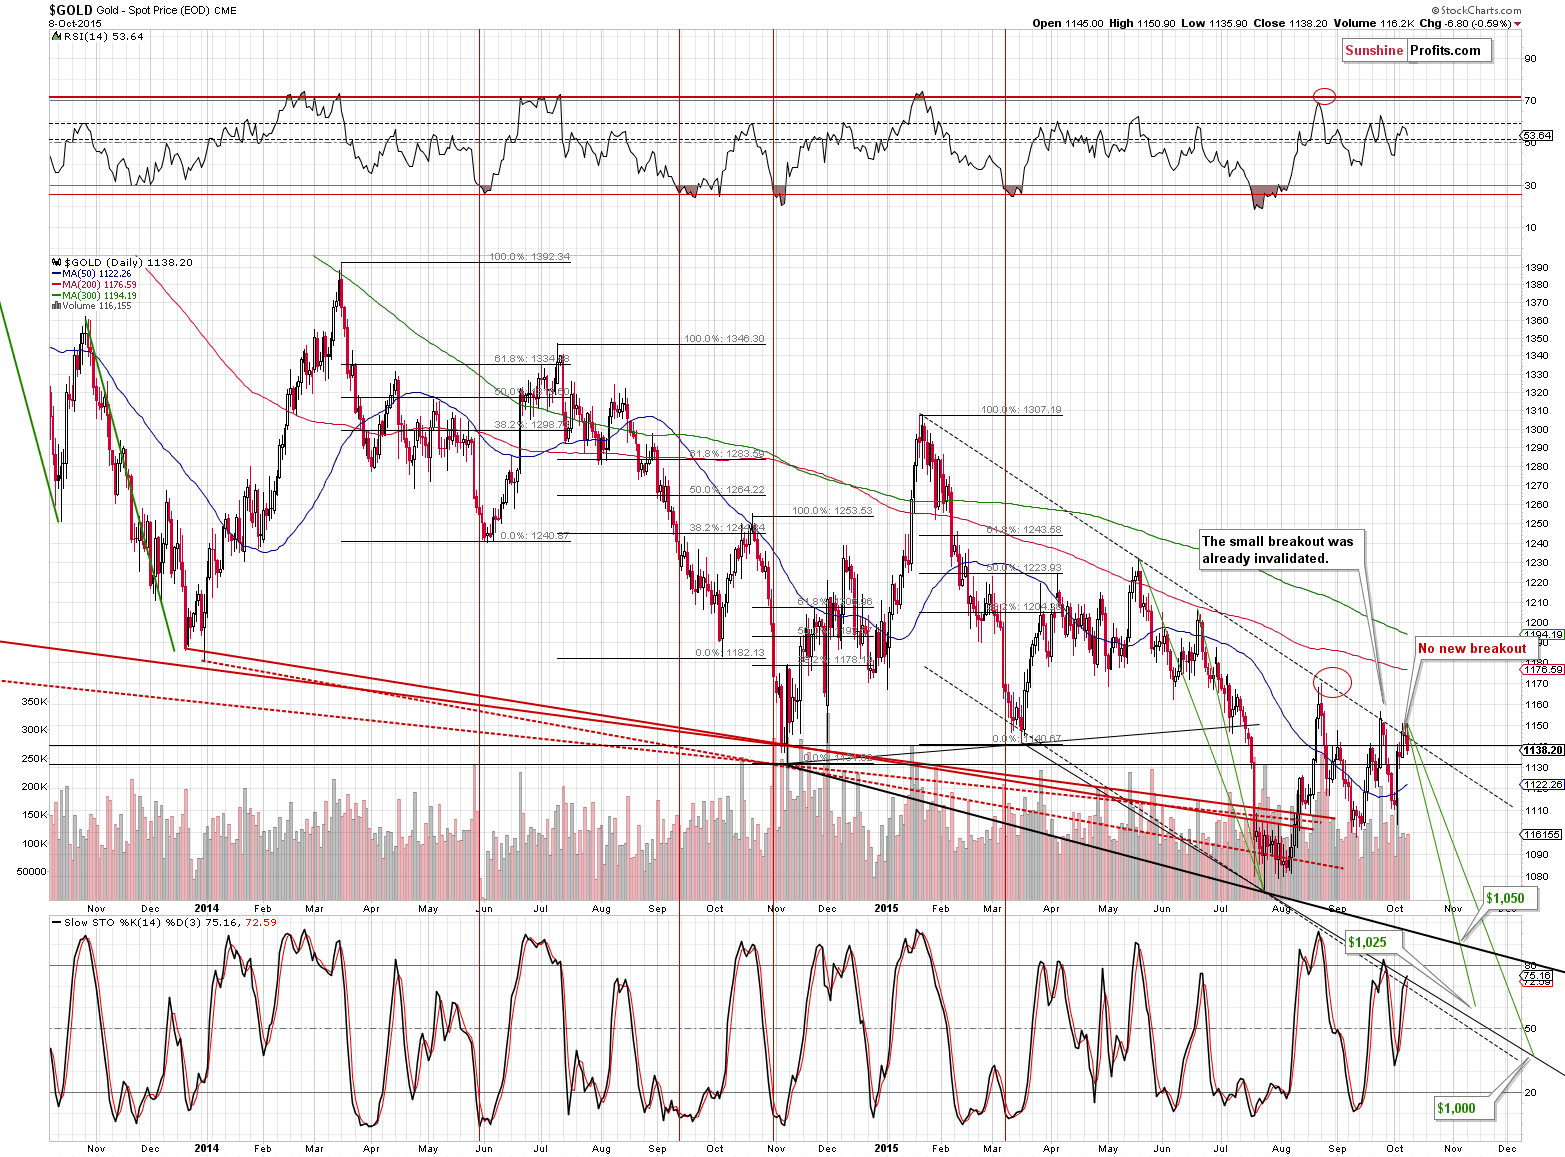
Gold once again tried to move above the declining resistance line, but once again failed to hold these gains and ultimately declined. The breakout’s invalidation is a bearish signal, so the situation on the above short-term gold chart deteriorated.
Gold moved higher in today’s pre-market trading (more or less to the Sep. 2015 high), but this breakout is far from being confirmed, so it doesn’t change much – at least not yet.
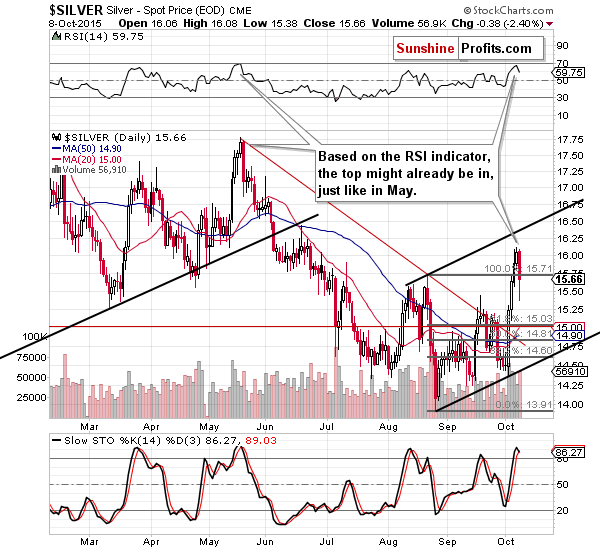
Silver moved sharply lower initially (and this showed why we were reluctant to temporarily close a short position in silver – because the move could have been even bigger) but finally corrected about half of the decline before the end of the session. Is the reversal bullish? Not really – such plunges were seen in the early stages of declines, even if they were subsequently corrected. The situation in silver deteriorated, but only a bit.
Silver moved back to $16 in today’s pre-market trading, but since double tops were quite common previously, we don’t necessarily view this as a sign of strength.
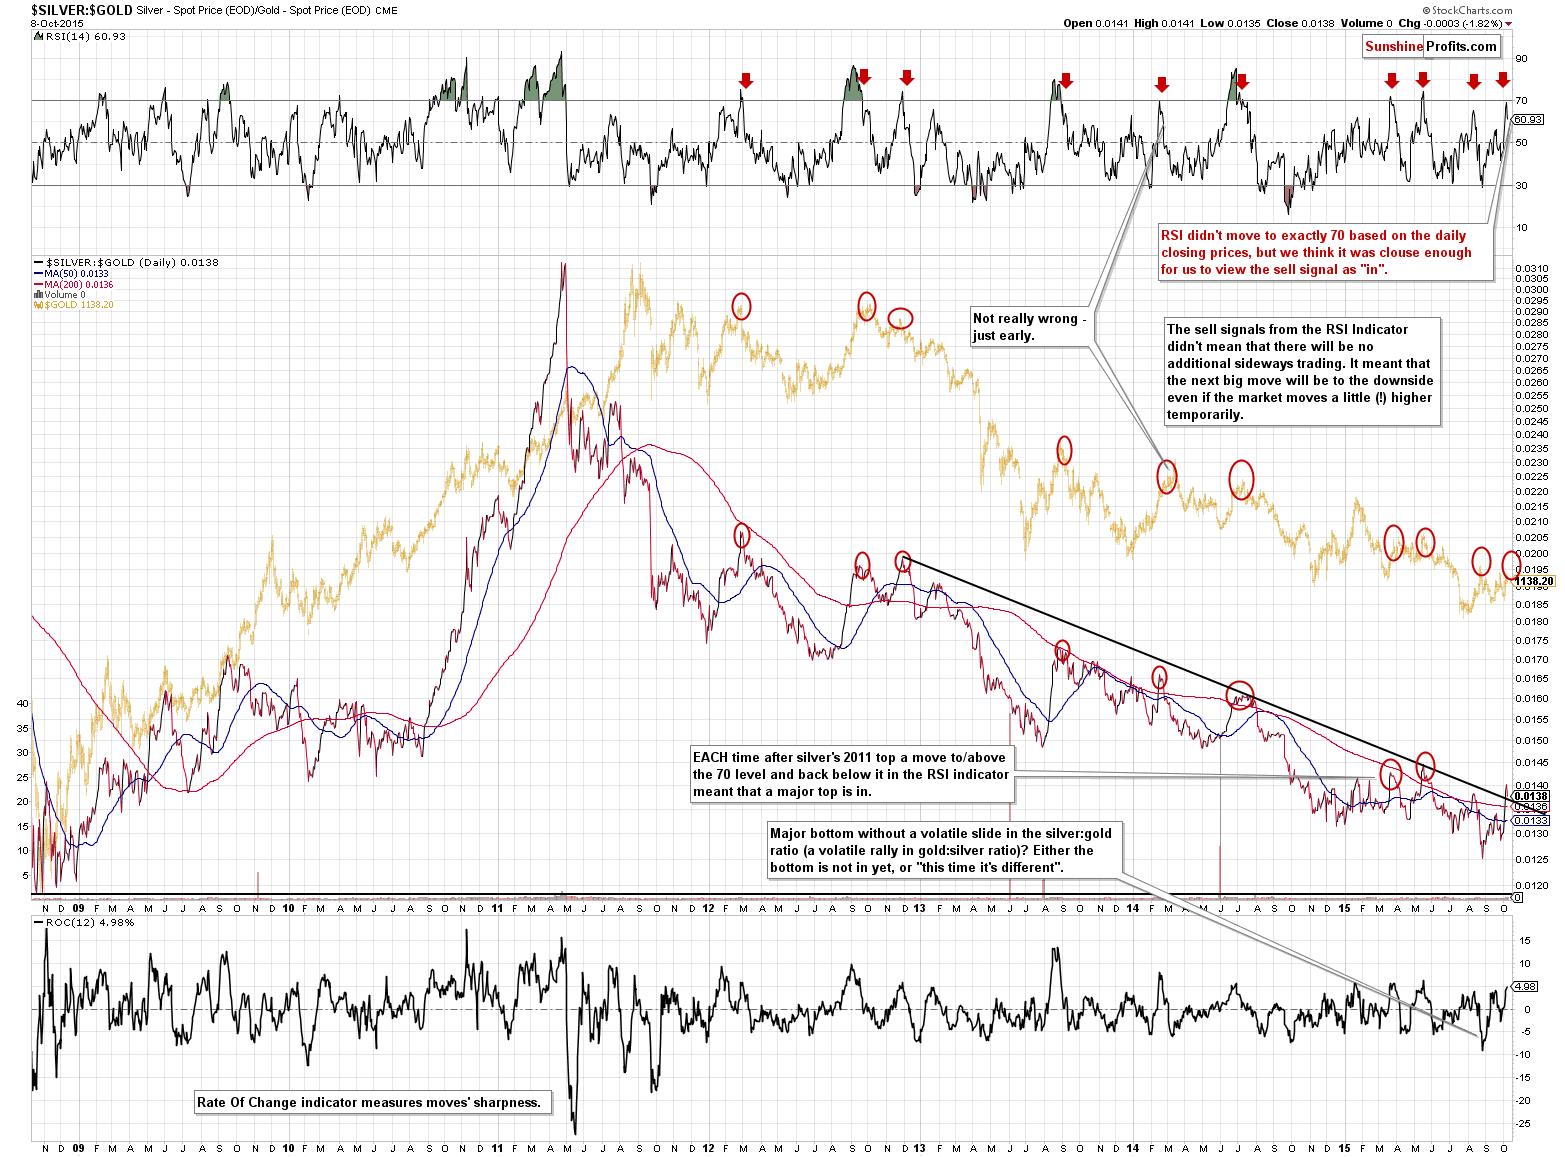
The situation deteriorated clearly in the silver to gold ratio as both the ratio and the RSI turned south. In the case of the latter it’s important as the indicator was almost at the 70 level and these reversals close to the 70 level were seen either at local tops or right before them in the past. The implications are bearish. If silver outperforms gold today, then we might see a move to the 70 level which would confirm the bearish implications.
In the previous alerts we discussed 2 analogies that may be currently in play in the case of mining stocks:
This year’s big decline is somewhat similar to the late-2014 decline – both declines were similar in size and both initially corrected to their declining resistance line and more or less to the 38.2% Fibonacci retracement level only to decline back to their previous lows.
If this self-similarity is to continue, the HUI Index could move higher, up to 156 and… still remain (!) in a medium-term downtrend. Consequently, this analogy doesn’t really have important medium- or long-term implications. It does, however, have bullish short-term implications as a 30+ index point move is significant from the day-to-day perspective. Will gold stocks really rally up to 156 or so? The very important thing here is that this is not a precise prediction – the more distant target we have in the case of a self-similar pattern, the less precise it becomes. The self-similar pattern doesn’t have to work very precisely, it can be in place but only to a more-or-less extent. For instance, we could see a move to the August high, just like it was the case in silver, or we could see a reversal right away (after all, we already saw some strength after the second local bottom).
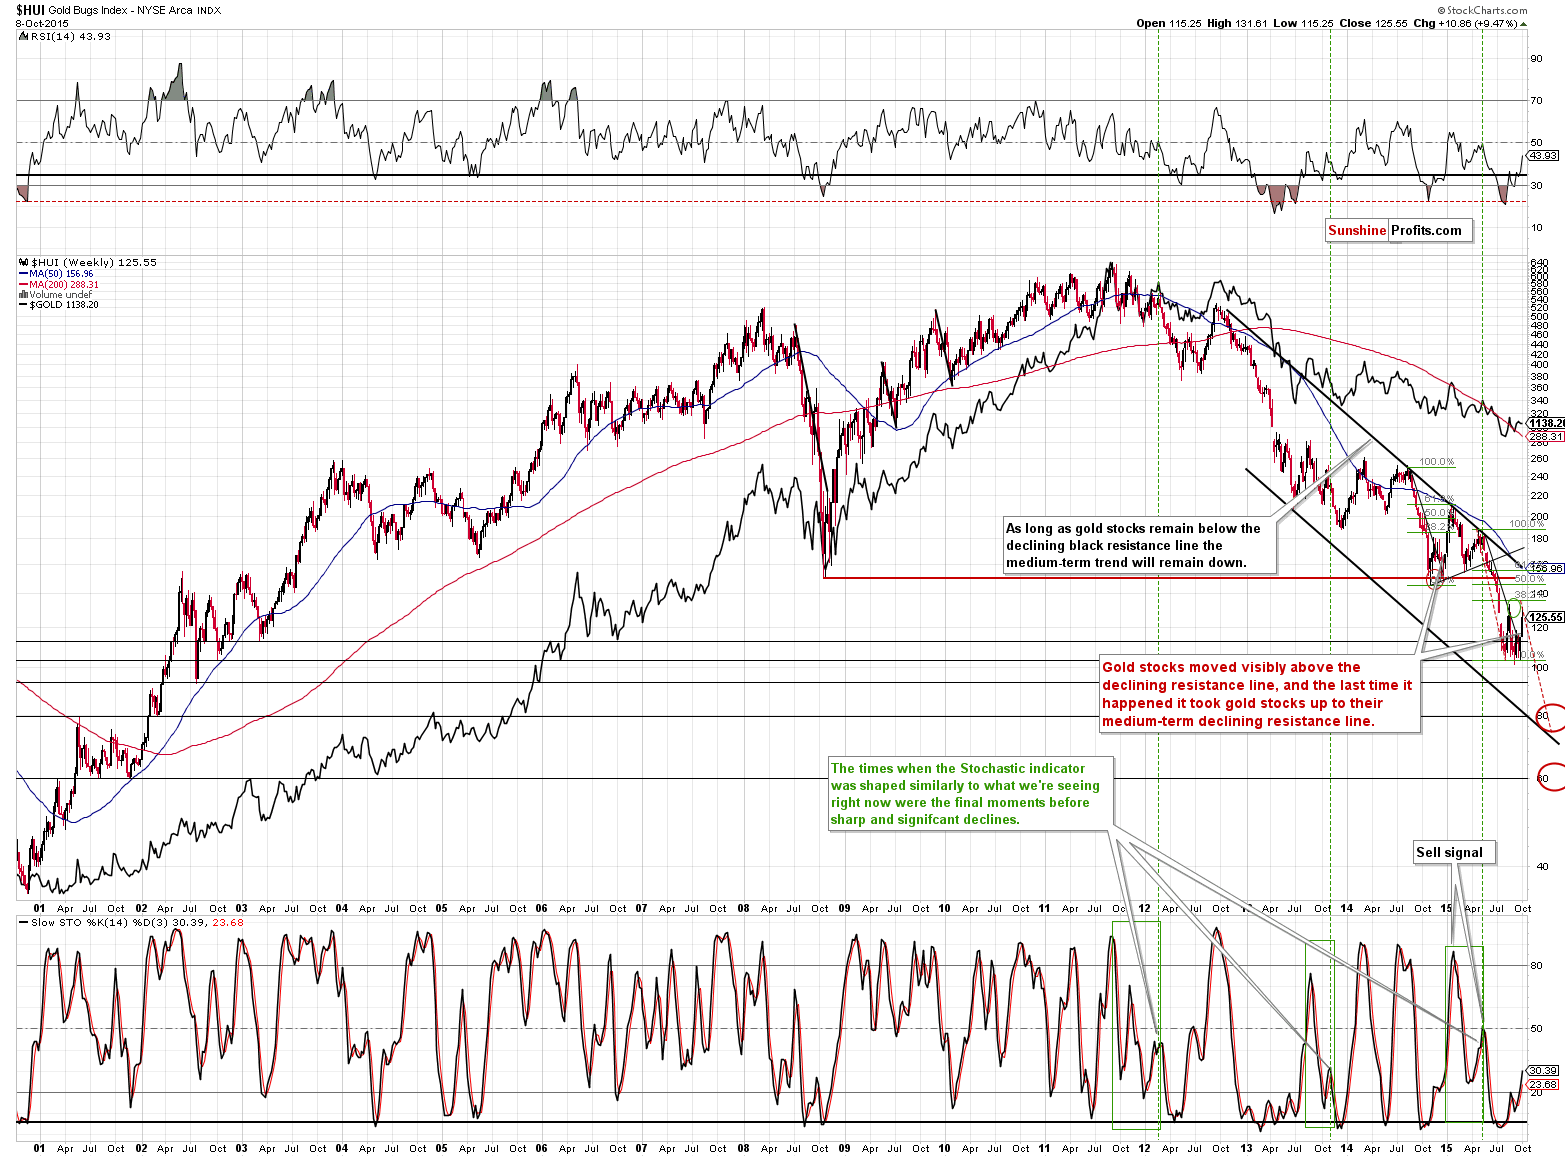
Speaking of analogous patterns, if we look at the RSI in order to see what past situations were similar to what we have today, we’ll see that in the last decade there was only one time when the RSI was below 20 – after which it moved back above 40 – in 2012. Given this analogy, we are in a similar situation to what we saw in the middle of 2012. Back then, when the RSI was close to 40, a local top was very close (in fact, prices higher than the ones at that top have not been seen up to this day). Back in 2012, the HUI topped at its previous local high, which at this time would imply a move to 130 or so.
On the long-term HUI Index chart we can see that it moved to its previous local top and reversed, which seems like a clear confirmation that the latter kind of analogy is in place and that the implications are bearish. However, after closer examination, prices still move in tune with the Jan 2015 rally as well. Even yesterday’s intra-day reversal is somewhat similar to the Jan. 7 2015 session. Consequently, both analogies remain in place and the jury is still out as far as discussing whether the local top is already in or not is concerned.
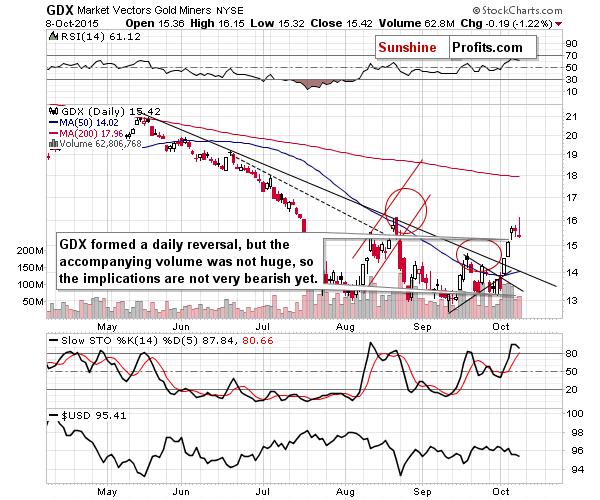
The volume was not particularly high during yesterday’s reversal, and if it had been a true reversal we would’ve expected it to be very high, so we don’t think that we’ve seen a very bearish sign for mining stocks yet.
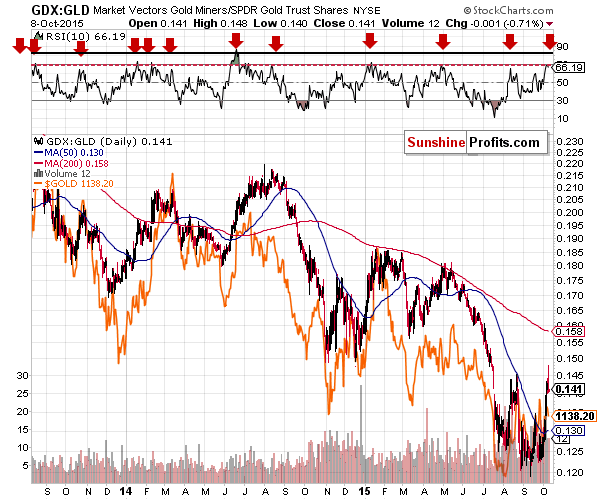
The GDX to GLD ratio flashed an imprecise sell signal as the RSI indicator moved close to the red horizontal line. In the past, reaching such levels meant that we are close to the local top. However, since this signal was not very precise, it doesn’t tell us if the top was indeed formed yesterday or will be formed within the next several days.
The GDX to GLD ratio flashed an imprecise sell signal as the RSI indicator moved close to the red horizontal line. In the past, reaching such levels meant that we are close to the local top. However, since this signal was not very precise, it doesn’t tell us if the top was indeed formed yesterday or will be formed within the next several days.
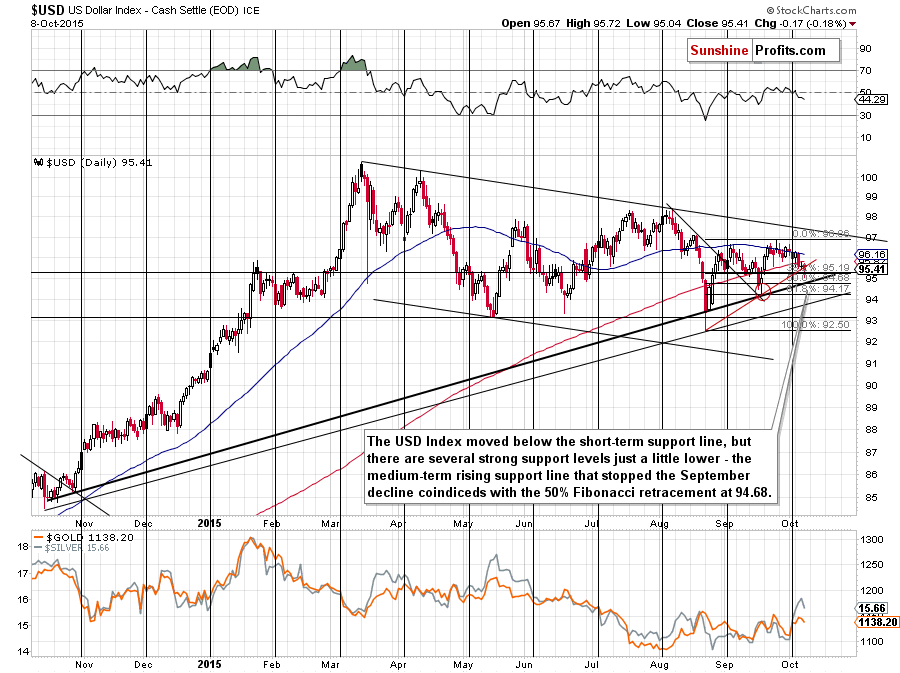
The USD Index moved lower in today’s pre-market trading and at the moment of writing these words it’s at about 94.90. The USD broke below the very short-term red support line, but there are several support levels just around the corner. The medium-term rising support line based on the lows (in terms of daily closing prices) of Oct. 2014 and Aug. 2015 is at 94.68, which is where we also have the Fibonacci 50% retracement. This support level is more significant than the rising red support/resistance line, so we don’t think that today’s decline (and yesterday’s one) changed much.
Consequently, although it might seem that a lot happened (especially in today’s pre-market trading), actually not much changed and we think that the summary of yesterday’s issue still correctly describes the situation today:
Summing up, while it continues to seem justified from the risk/reward perspective to wait out any temporary strength in gold and silver, it seems no positions are justified in the case of the mining stocks due to the bullish outlook for the general stock market. Perhaps we have just seen the local top (based on silver’s decline), but we haven’t seen enough sell signals to justify moving back on the short side of the market in case of the mining stocks. We might be very close to this moment, though.
Consequently, while we are not going long, we do think that staying on the sidelines in the case of the trading capital dedicated to the mining stocks, while keeping the existing short positions in gold and silver, is currently justified from the long-term perspective. Despite this rather long consolidation, it seems that the next big move will be to the downside and that significant profits will be made thanks to this move – likely higher than the ones from the previous trade and perhaps just as big (or higher) than from the previous short trade.
As always, we will keep you – our subscribers – updated.
To summarize:
Trading capital (our opinion): Short position (full) position in gold and silver (but not one in the mining stocks) is justified from the risk/reward perspective with the following stop-loss orders and initial (! – this means that reaching them doesn’t automatically close the position) target prices:
- Gold: initial target price: $1,050; stop-loss: $1,213, initial target price for the DGLD ETN: $98.37; stop loss for the DGLD ETN $65.60
- Silver: initial target price: $12.60; stop-loss: $16.73, initial target price for the DSLV ETN: $96.67; stop loss for DSLV ETN $40.28
Long-term capital (our opinion): No positions
Insurance capital (our opinion): Full position
Please note that a full position doesn’t mean using all of the capital for a given trade. You will find details on our thoughts on gold portfolio structuring in the Key Insights section on our website.
As a reminder – “initial target price” means exactly that – an “initial” one, it’s not a price level at which we suggest closing positions. If this becomes the case (like it did in the previous trade) we will refer to these levels as levels of exit orders (exactly as we’ve done previously). Stop-loss levels, however, are naturally not “initial”, but something that, in our opinion, might be entered as an order.
Since it is impossible to synchronize target prices and stop-loss levels for all the ETFs and ETNs with the main markets that we provide these levels for (gold, silver and mining stocks – the GDX ETF), the stop-loss levels and target prices for other ETNs and ETF (among other: UGLD, DGLD, USLV, DSLV, NUGT, DUST, JNUG, JDST) are provided as supplementary, and not as “final”. This means that if a stop-loss or a target level is reached for any of the “additional instruments” (DGLD for instance), but not for the “main instrument” (gold in this case), we will view positions in both gold and DGLD as still open and the stop-loss for DGLD would have to be moved lower. On the other hand, if gold moves to a stop-loss level but DGLD doesn’t, then we will view both positions (in gold and DGLD) as closed. In other words, since it’s not possible to be 100% certain that each related instrument moves to a given level when the underlying instrument does, we can’t provide levels that would be binding. The levels that we do provide are our best estimate of the levels that will correspond to the levels in the underlying assets, but it will be the underlying assets that one will need to focus on regarding the sings pointing to closing a given position or keeping it open. We might adjust the levels in the “additional instruments” without adjusting the levels in the “main instruments”, which will simply mean that we have improved our estimation of these levels, not that we changed our outlook on the markets. We are already working on a tool that would update these levels on a daily basis for the most popular ETFs, ETNs and individual mining stocks.
Our preferred ways to invest in and to trade gold along with the reasoning can be found in the how to buy gold section. Additionally, our preferred ETFs and ETNs can be found in our Gold & Silver ETF Ranking.
As always, we'll keep you - our subscribers - updated should our views on the market change. We will continue to send out Gold & Silver Trading Alerts on each trading day and we will send additional Alerts whenever appropriate.
The trading position presented above is the netted version of positions based on subjective signals (opinion) from your Editor, and the Tools and Indicators.
As a reminder, Gold & Silver Trading Alerts are posted before or on each trading day (we usually post them before the opening bell, but we don't promise doing that each day). If there's anything urgent, we will send you an additional small alert before posting the main one.
=====
Latest Free Trading Alerts:
Yesterday, the minutes of the Federal Reserve's September meeting were released. What do they say about the Fed’s stance and what do they mean for the gold market?
Why did China devalue the yuan and what are the possible consequences for the global economy and the gold market? We invite you to read our today’s article and learn what is the relationship between Chinese currency and the price of gold.
The Devaluation of Yuan and Gold
Yesterday, the Department of Labor reported that the number of initial jobless claims in the week ending October 3 declined by 13,000, beating analysts’ expectations for a 2,000 drop. As a result, the USD Index came back above 95.50, which pushed EUR/USD sharply lower. Thanks to this move, the exchange rate invalidated earlier breakout. Will we see further deterioration in the coming days?
Forex Trading Alert: EUR/USD – Time for Bigger Decline?
=====
Hand-picked precious-metals-related links:
UBS cuts gold, base metals price forecasts
Is there still a place for collective bargaining in SA’s mining sector?
=====
In other news:
IMF told that amid 'new mediocre' no room for mistakes by central banks
IMF's Lagarde: China's slowdown is 'healthy'
Carney says Bank of England rate hike not Fed-dependent
Spanish Bonds Beating German Peers Signals Wagers on Stimulus
Goldman Sachs sees oil rally fading
Glencore to cut 500,000T of zinc output as prices slide
=====
Thank you.
Sincerely,
Przemyslaw Radomski, CFA
Founder, Editor-in-chief
Gold & Silver Trading Alerts
Forex Trading Alerts
Oil Investment Updates
Oil Trading Alerts

