

Briefly: In our opinion, short (full) speculative positions in gold, silver and mining stocks are justified from the risk/reward point of view.
Gold, silver and mining stocks rallied last week as investors were positively surprised by the lack of changes in interest rates. Was this enough to trigger a massive rally, or was last week’s rally just a temporary phenomenon?
We continue to think that the latter was the case. There are quite a few reasons for it, let’s take a look at them (charts courtesy of http://stockcharts.com).
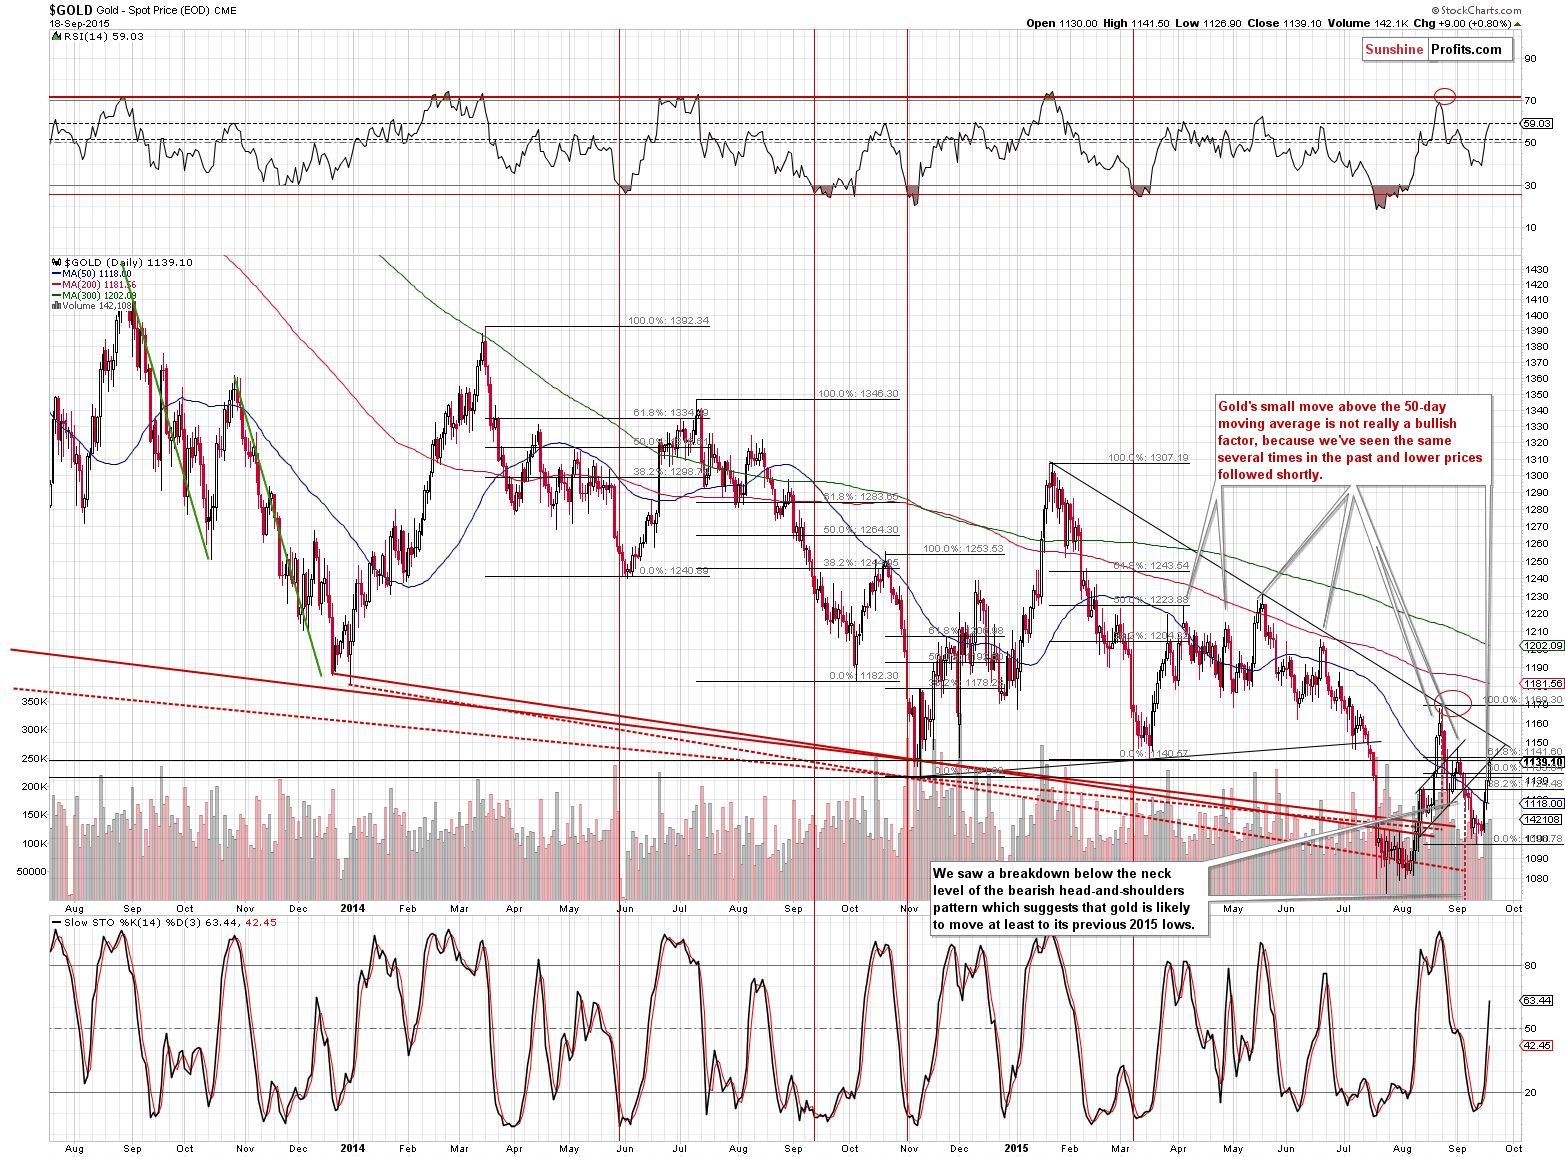
To a large extent, our previous comments on the short-term gold chart remain up-to-date:
Gold moved above its 50-day moving average, but this is much less bullish than it may seem. In fact, it’s not bullish at all. The reason is we saw such action several times earlier this year and it was still followed by more declines. Is this time different? Not likely – why would it be?
Gold corrected more than 50% of the Aug. – Sep. decline – it rallied to the 61.8% retracement and it could reverse shortly. However, if it doesn’t and we see a rally to $1,150 - $1,155 or so, then this would still not change the medium-term trend. Gold would still remain below the declining medium-term resistance line. Will gold move as high before reversing? That’s rather unclear but the decline is more likely than not and it doesn’t seem that exiting the short positions in light of the above possibility is really justified.
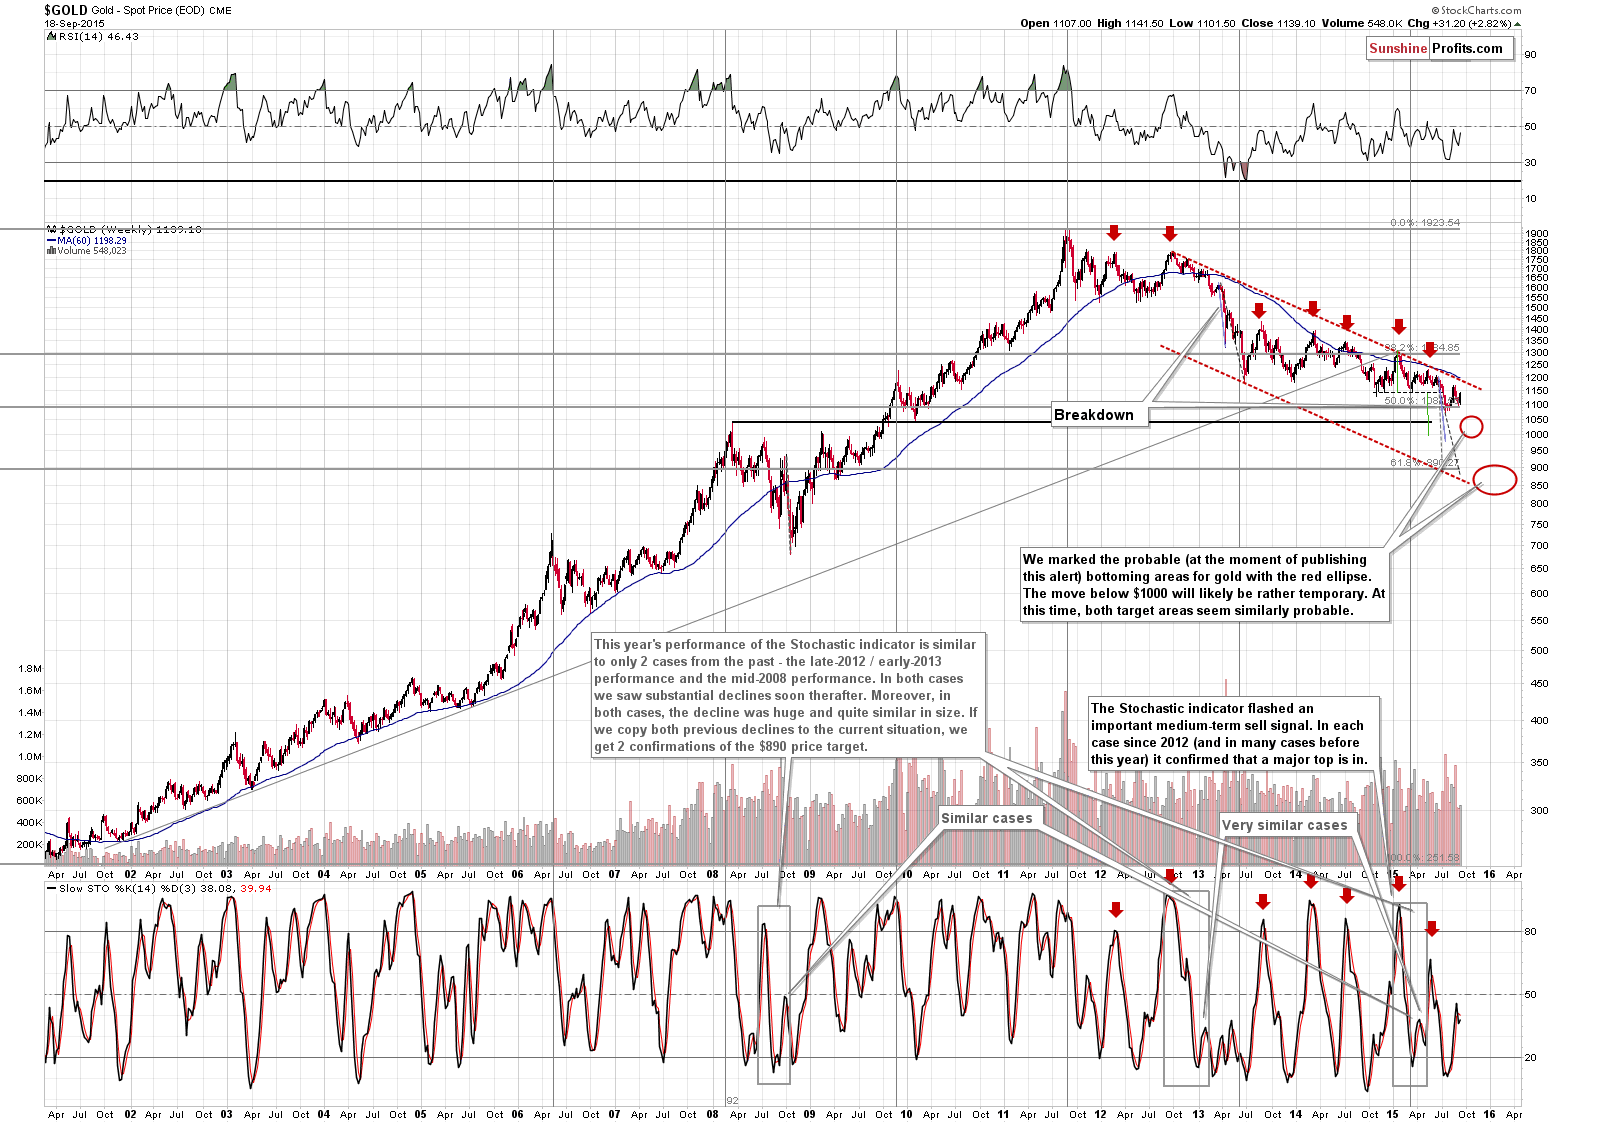
From the long-term perspective, nothing changed – the medium-term trend remains down.
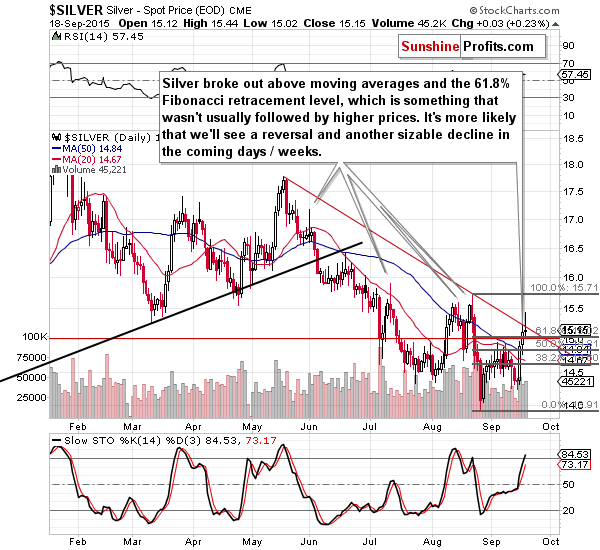
Silver moved higher once again and once again we don’t view this as a bullish sign. Our yesterday’s comments on the above remain up-to-date:
Viewing a daily rally on significant volume as a bearish sign seems to be against the direct way in which one can apply classic technical analysis, but the key thing that one needs to keep in mind is that this analysis and the analogies to past situations need to be applied to each market differently. “Technical rules” are not set in stone – they are more like guidelines that leave discovering the details to the one analyzing the market. The “problem” for those who are new to the silver market is that it doesn’t act in a classic way. We saw silver’s fake breakouts and false outperformance on many occasions and we witnessed and profited on the subsequent declines almost as many times. Consequently, we are far from viewing silver’s strength and outperformance as a true bullish sign. We view it as a bearish phenomenon.
More importantly, we saw a daily reversal in silver and this is something that we saw at the previous local tops, so again, it seems that the outlook is bearish.
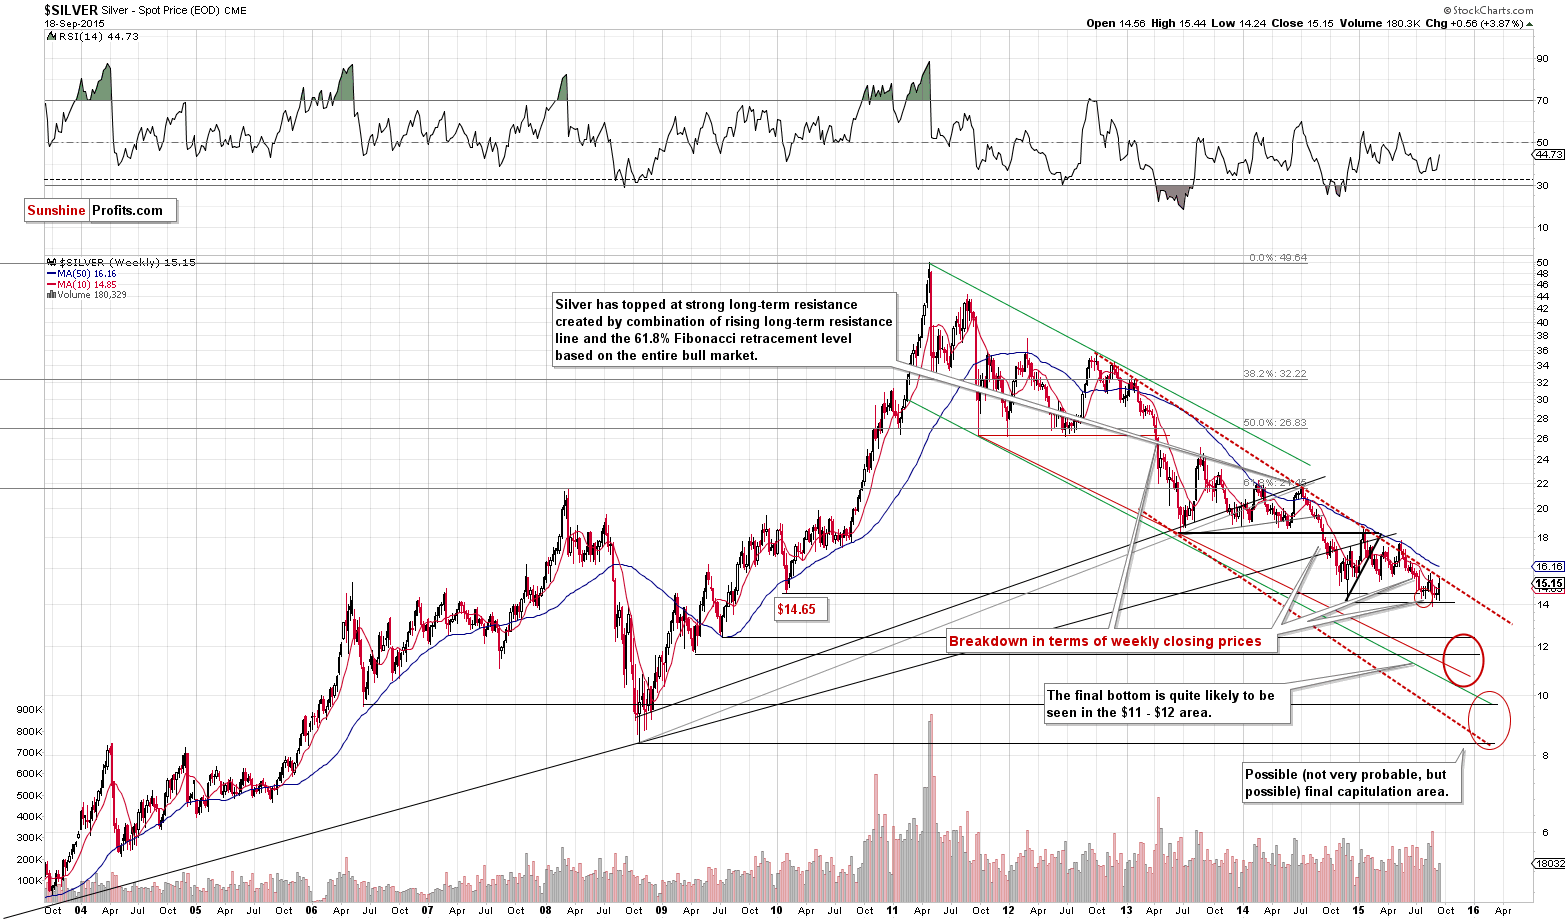
The long-term chart has even more bearish implications as silver moved to the long-term declining resistance line and reversed. It seems that silver is ready to decline once again.
What about mining stocks? Was their rally extraordinary?
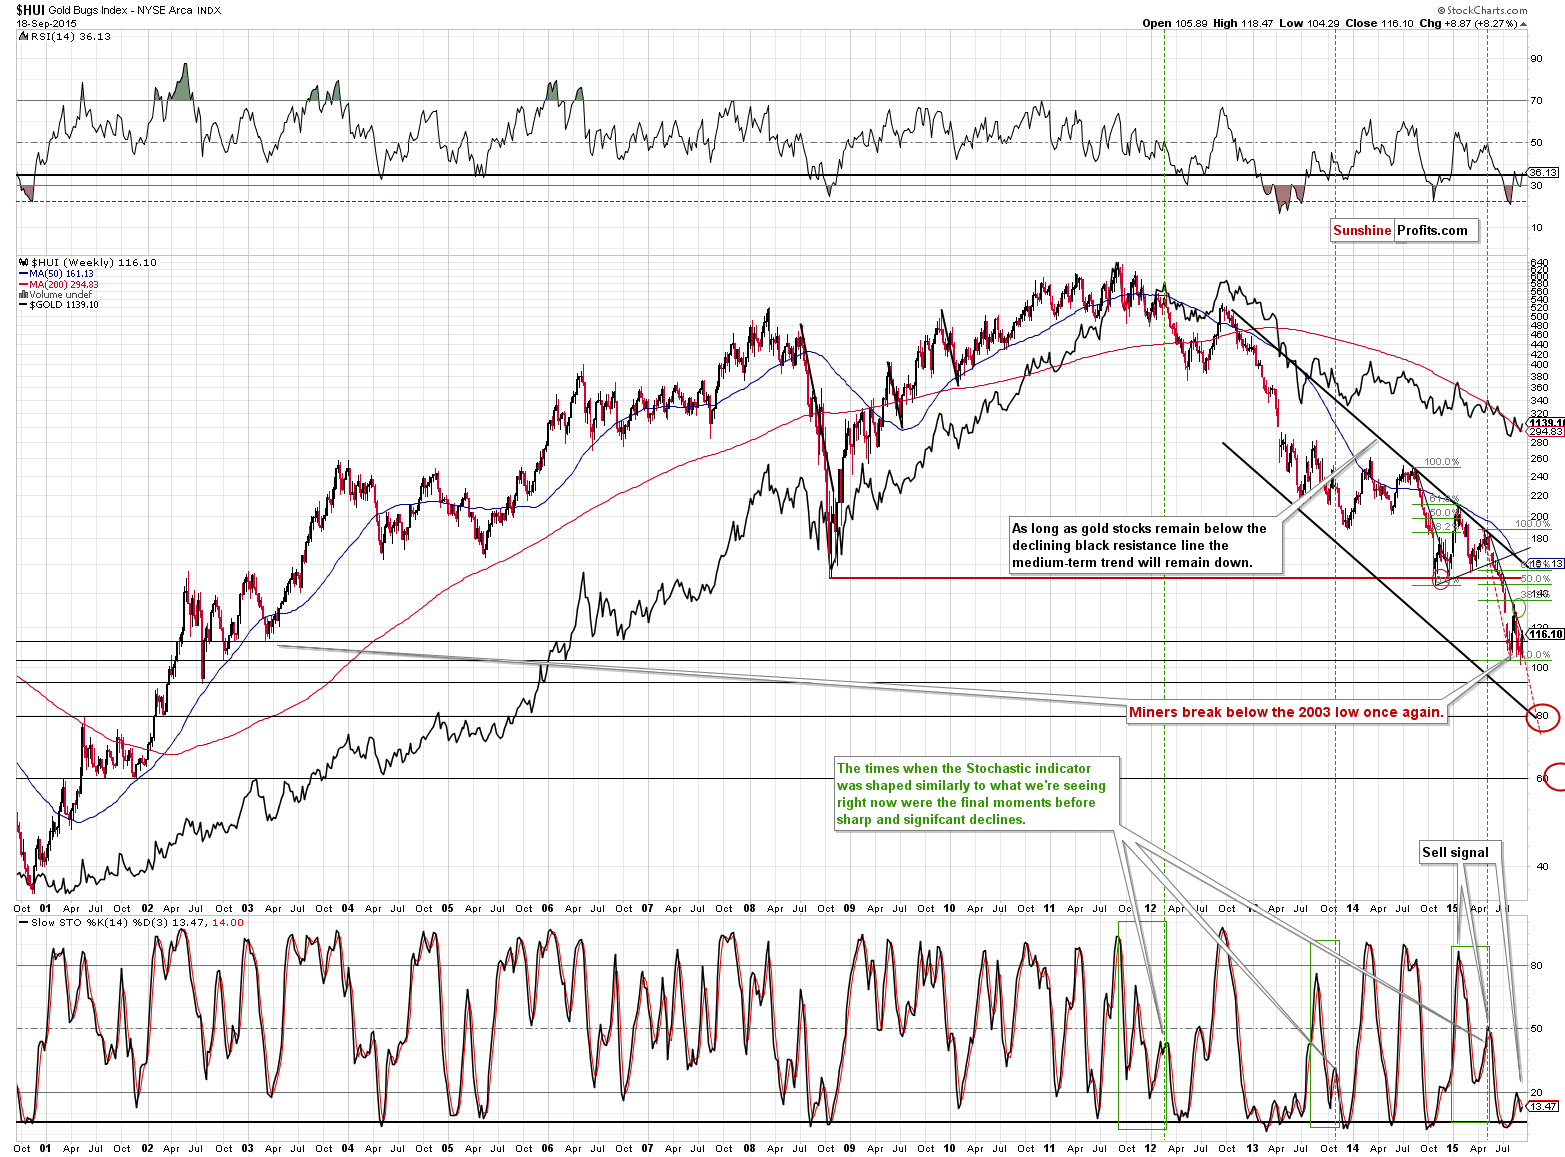
Our previous comments on the above chart remain up-to-date:
Not really. The decline continues and it’s still similar to what we saw during the previous downswing (red dashed lines on the above chart). Yesterday’s rally didn’t even make the decline less steep.
In our opinion, the sell signal from the weekly Stochastic indicator is a much more important signal than yesterday’s rally, and the implications continue to be very bearish for the medium term.
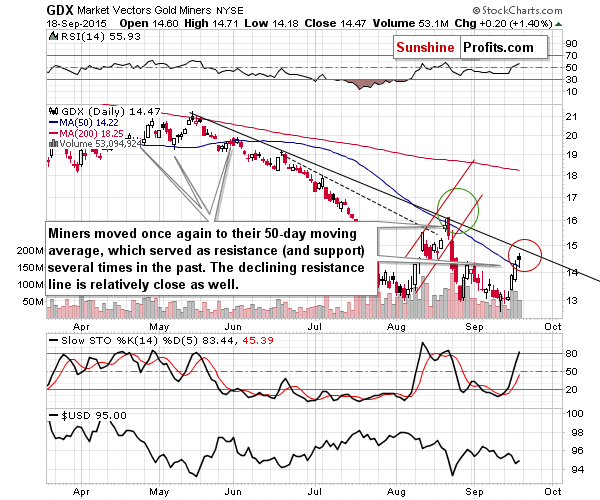
The situation on the short-term chart also remains unchanged from yesterday (as far as the outlook is concerned):
On the above short-term chart we see that while GDX reached one of the important resistance levels (the 50-day moving average), it has an additional one relatively close (the declining resistance line). We created a target area based on both of them. Even if the 50-day moving average doesn’t keep the rally in check, it seems that the declining resistance line will. Will GDX rally to it before reversing? It’s unclear, but we think that keeping the short position intact and focusing on the medium-term move is a good idea. We could exit the position and re-enter it later, but in this case we would be vulnerable to missing out on a sudden decline, just like the one that we saw about a month ago.
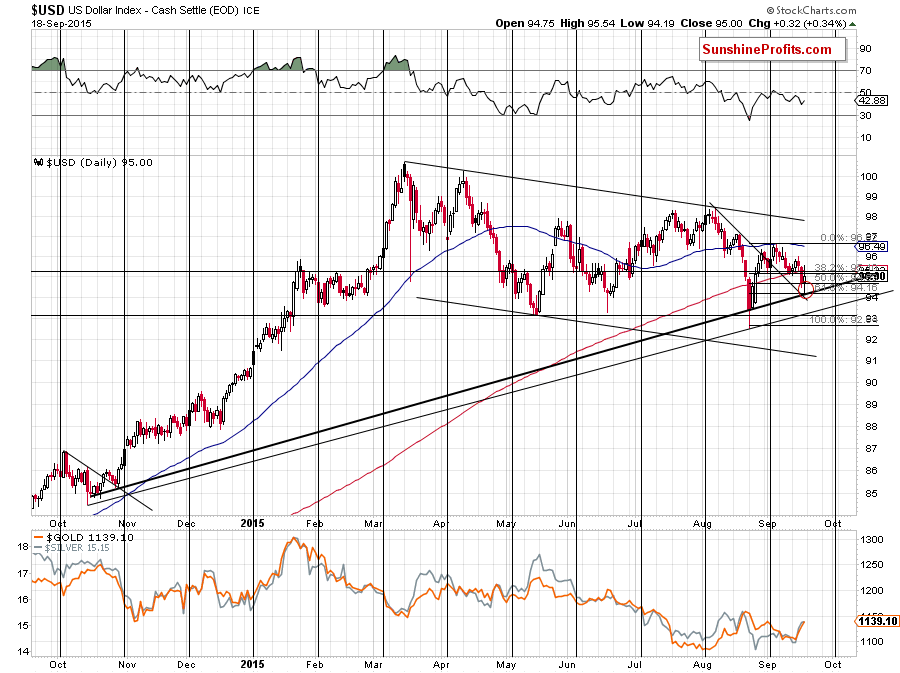
Meanwhile, the USD Index chart suggests that the decline in it and the rally in the precious metal sector may be over. The USD Index moved to our target area (the combination of support levels) and rallied back up. In Friday’s alert we wrote the following:
(…) there’s a combination of stronger support levels only a little lower (slightly above 94): the declining support line, the 61.8% Fibonacci retracement and the medium-term rising support line based on the daily closing prices. If this level doesn’t stop the decline, then it’s highly likely that the May low would. Either way, we think that lower values of the USD would only be temporary, just like higher values of precious metals and mining stocks (as far as the medium term is concerned; we think metals and miners will be much higher in the coming years).
At the moment of writing these words (Friday morning), the USD is trading at 94.17 (declining 0.32), so the mentioned combination of support levels has more or less been reached.
Since the support was reached, the rally is quite likely to continue, which is likely to have a negative effect on the precious metals market – if not immediately, then likely shortly.
Summing up, we had seen some additional strength as a possibility and this week it materialized, however, this move higher doesn’t seem to be anything more than a counter-trend correction. The medium-term trend remains down and there are some signs that this corrective rally is already over or about to be over. It seems that the profits from our short position will increase significantly in the coming weeks (not necessarily days).
As always, we will keep you – our subscribers – updated.
To summarize:
Trading capital (our opinion): Short position (full) position in gold, silver and mining stocks is justified from the risk/reward perspective with the following stop-loss orders and initial (! – this means that reaching them doesn’t automatically close the position) target prices:
- Gold: initial target price: $1,050; stop-loss: $1,213, initial target price for the DGLD ETN: $98.37; stop loss for the DGLD ETN $65.60
- Silver: initial target price: $12.60; stop-loss: $16.73, initial target price for the DSLV ETN: $96.67; stop loss for DSLV ETN $40.28
- Mining stocks (price levels for the GDX ETN): initial target price: $11.57; stop-loss: $17.33, initial target price for the DUST ETN: $41.10; stop loss for the DUST ETN $8.54
In case one wants to bet on junior mining stocks' prices (we do not suggest doing so – we think senior mining stocks are more predictable in the case of short-term trades – if one wants to do it anyway, we provide the details), here are the stop-loss details and initial target prices:
- GDXJ: initial target price: $16.27; stop-loss: $24.33
- JDST: initial target price: $16.98; stop-loss: $3.42
Long-term capital (our opinion): No positions
Insurance capital (our opinion): Full position
Please note that a full position doesn’t mean using all of the capital for a given trade. You will find details on our thoughts on gold portfolio structuring in the Key Insights section on our website.
As a reminder – “initial target price” means exactly that – an “initial” one, it’s not a price level at which we suggest closing positions. If this becomes the case (like it did in the previous trade) we will refer to these levels as levels of exit orders (exactly as we’ve done previously). Stop-loss levels, however, are naturally not “initial”, but something that, in our opinion, might be entered as an order.
Since it is impossible to synchronize target prices and stop-loss levels for all the ETFs and ETNs with the main markets that we provide these levels for (gold, silver and mining stocks – the GDX ETF), the stop-loss levels and target prices for other ETNs and ETF (among other: UGLD, DGLD, USLV, DSLV, NUGT, DUST, JNUG, JDST) are provided as supplementary, and not as “final”. This means that if a stop-loss or a target level is reached for any of the “additional instruments” (DGLD for instance), but not for the “main instrument” (gold in this case), we will view positions in both gold and DGLD as still open and the stop-loss for DGLD would have to be moved lower. On the other hand, if gold moves to a stop-loss level but DGLD doesn’t, then we will view both positions (in gold and DGLD) as closed. In other words, since it’s not possible to be 100% certain that each related instrument moves to a given level when the underlying instrument does, we can’t provide levels that would be binding. The levels that we do provide are our best estimate of the levels that will correspond to the levels in the underlying assets, but it will be the underlying assets that one will need to focus on regarding the sings pointing to closing a given position or keeping it open. We might adjust the levels in the “additional instruments” without adjusting the levels in the “main instruments”, which will simply mean that we have improved our estimation of these levels, not that we changed our outlook on the markets. We are already working on a tool that would update these levels on a daily basis for the most popular ETFs, ETNs and individual mining stocks.
Our preferred ways to invest in and to trade gold along with the reasoning can be found in the how to buy gold section. Additionally, our preferred ETFs and ETNs can be found in our Gold & Silver ETF Ranking.
As always, we'll keep you - our subscribers - updated should our views on the market change. We will continue to send out Gold & Silver Trading Alerts on each trading day and we will send additional Alerts whenever appropriate.
The trading position presented above is the netted version of positions based on subjective signals (opinion) from your Editor, and the Tools and Indicators.
As a reminder, Gold & Silver Trading Alerts are posted before or on each trading day (we usually post them before the opening bell, but we don't promise doing that each day). If there's anything urgent, we will send you an additional small alert before posting the main one.
=====
Latest Free Trading Alerts:
The recent Fed’s statement on monetary policy was accompanied by Yellen’s press conference and the FOMC's Summary of Economic Projections. What can we learn from them?
Yellen’s September Press Conference and FOMC Projections
=====
Hand-picked precious-metals-related links:
Gold price momentum more positive: JP Morgan survey
A return to the gold standard?
Billionaire Eric Sprott Warns This Could Turn Into Armageddon For The Gold Shorts
ScotiaMocatta: Commitments of Traders (CFTC)
=====
In other news:
Yellen Pause Ups Pressure on Draghi as Global Pessimism Mounts
Is the stock market holding Janet Yellen hostage?
Moody's downgrades credit rating of France
Post-Fed, what will the VIX do until year-end?
Baltic Dry Index jumps most since '09 on speculated ship shortage
Goldman Sachs Says Euro May Weaken Up to 10 Cents on ECB Easing
=====
Thank you.
Sincerely,
Przemyslaw Radomski, CFA
Founder, Editor-in-chief
Gold & Silver Trading Alerts
Forex Trading Alerts
Oil Investment Updates
Oil Trading Alerts

