

Briefly: In our opinion, long (half) speculative positions in gold, silver and mining stocks are justified from the risk/reward point of view. In other words, we are taking profits off the table for half of the current long position.
Gold, silver and mining stocks soared yesterday. The volume that accompanied these gains was significant, especially in gold. In fact, gold rallied well above its 2014 low. The key question now is if the precious metals sector is actually really breaking higher and has already started the main part of the rally. Has it?
It’s too early to make such statements, in our view. Gold moved higher on strong volume, but that doesn’t mean that the entire decline is over – only that everyone got too bearish temporarily (as measured by the previous amount of bearish comments in the mass media about gold).
Let’s take a closer look (charts courtesy of http://stockcharts.com).
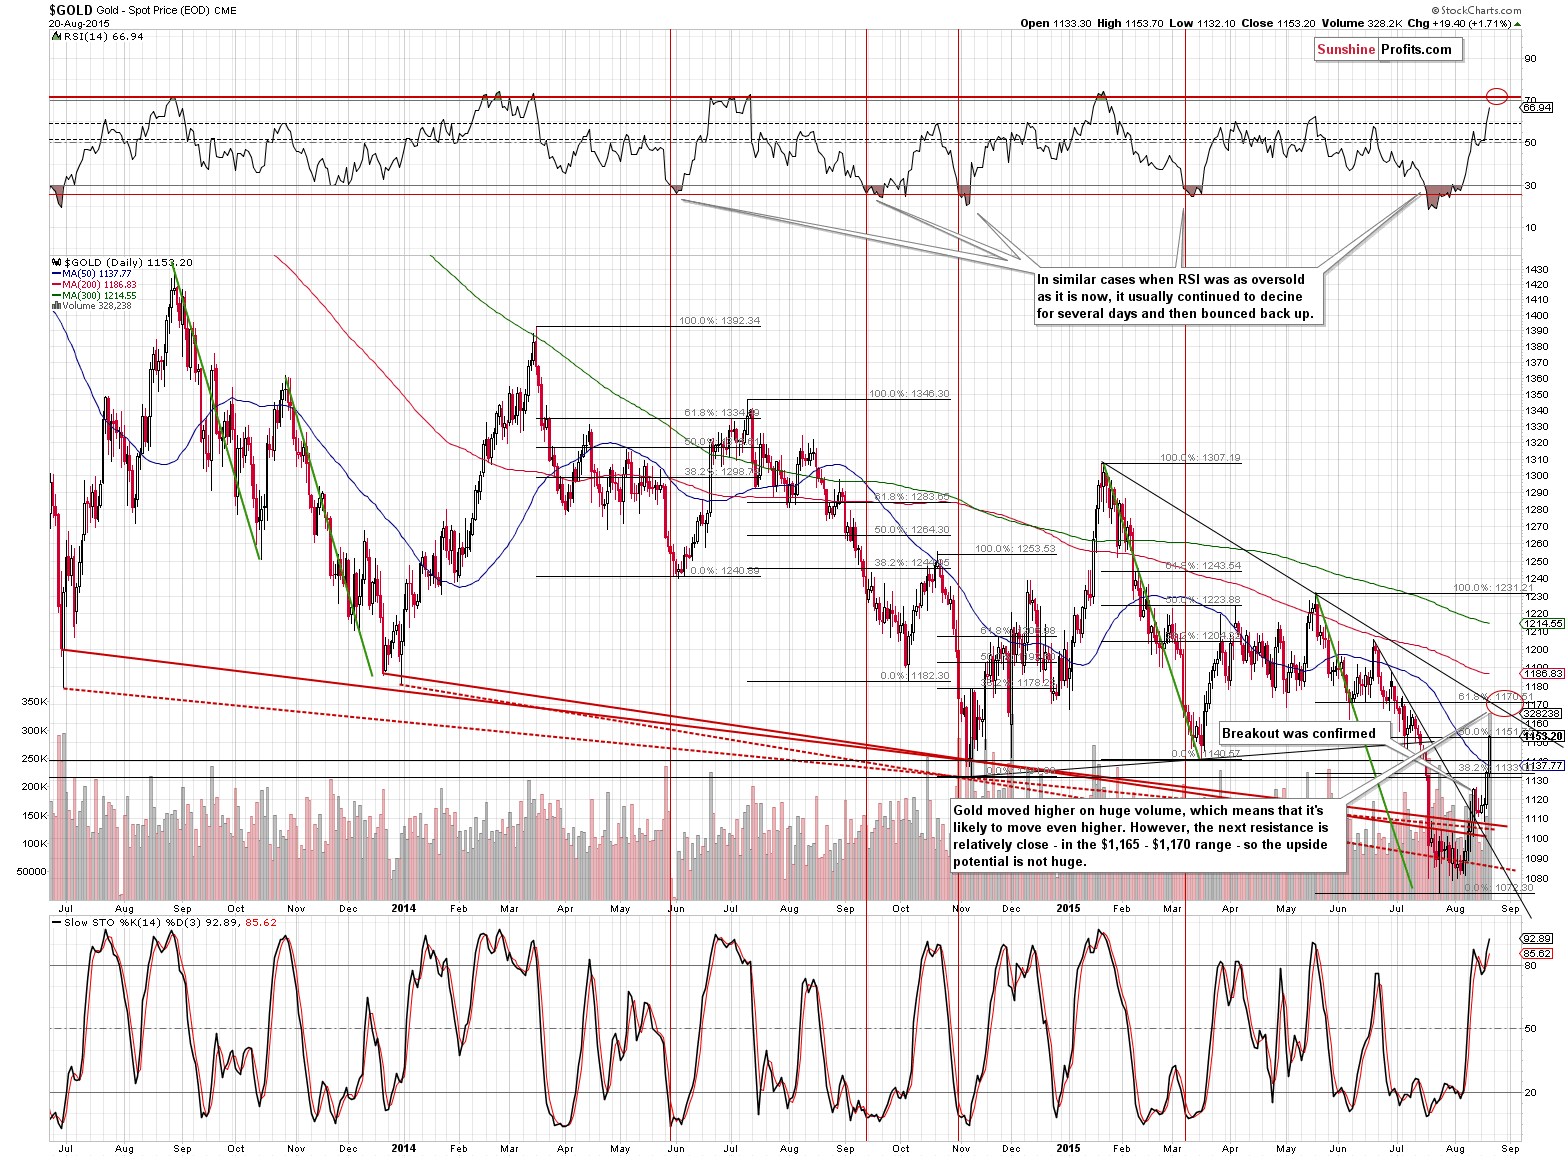
Gold moved higher and on strong volume, which is a very bullish sign for the short term. The fact that gold moved above the 2014 low also bodes well for the precious metals sector in general.
However, more significant resistance levels remains just above where gold is right now. The 61.8% Fibonacci retracement and the declining resistance line coincide at about $1,170, which is our current target for the yellow metal. The RSI indicator moved above our previous interim target area and at this time it’s likely to move slightly above 70 before topping. This means that gold is likely to move higher but not significantly so.
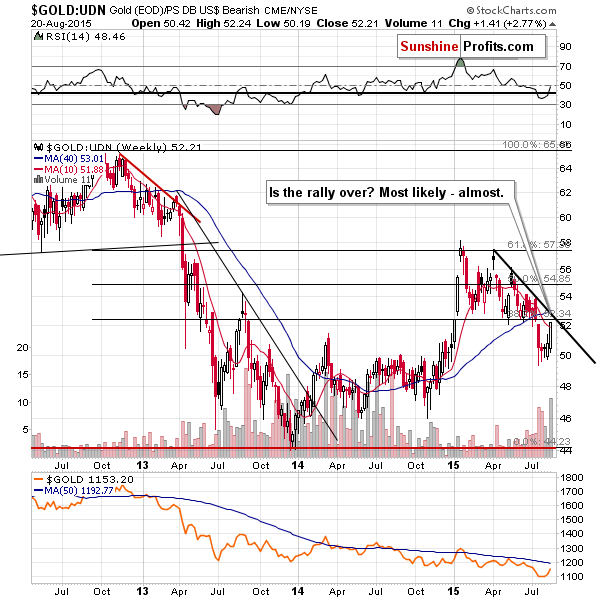
The rally is visible from the non-USD perspective as well. Gold hasn’t met the resistance line, yet, though. The above chart tells us that while gold can easily move higher, it’s not likely to move much higher, which is in tune what we can infer from the previous chart.
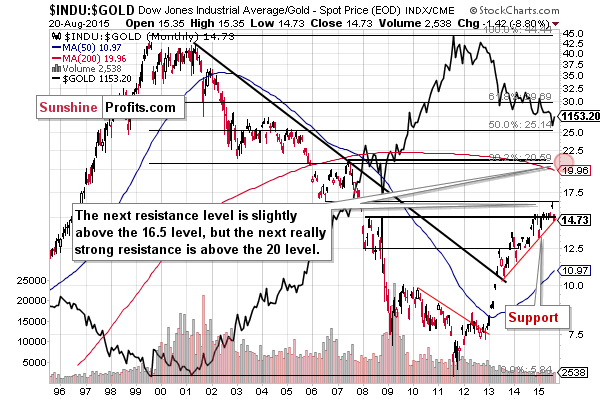
On the above chart we can see that the Dow to gold ratio moved to the rising support line, which tells us that it’s going to rally once again soon or shortly. The opposite can be said about gold – it’s likely to decline, but not necessarily immediately.
Yesterday we wrote the following about silver:
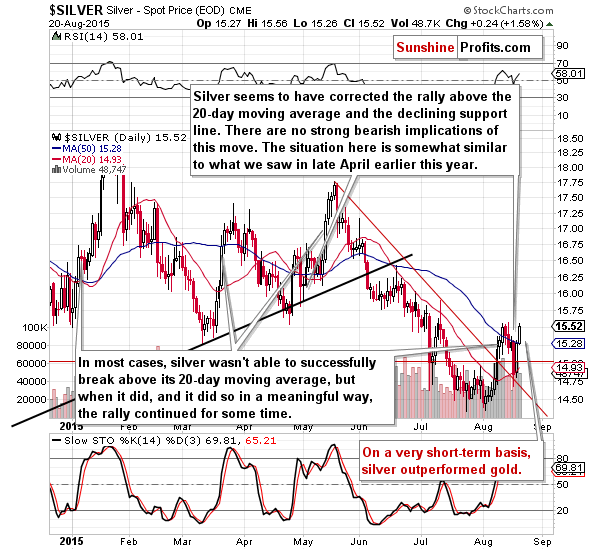
Speaking of sell signals, we would like to see sharp outperformance of silver as a confirmation of the top – just like we’ve seen it so many times before. If it does materialize, the odds are that silver will rally visibly higher than it is today (to $16 or so) and that’s one of the reasons to keep part of the long position opened.
The above remains up-to-date. We haven’t seen a sell signal from silver so far.
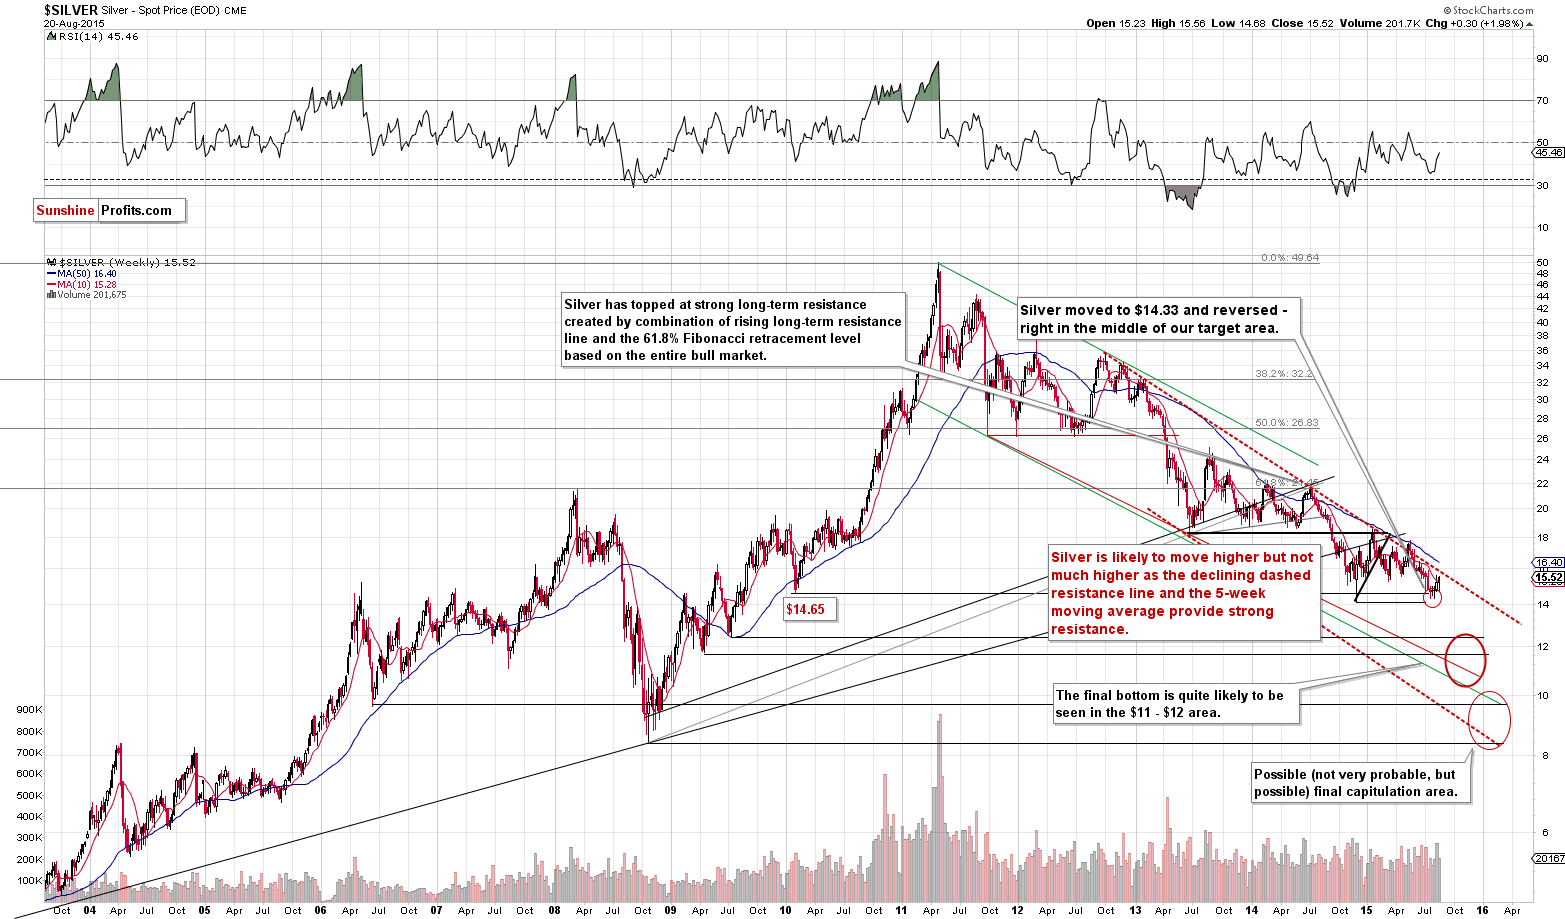
From the long-term perspective we see that silver can go a bit higher without bigger problems, however, it’s not likely to rally much further as the declining resistance line is just ahead.
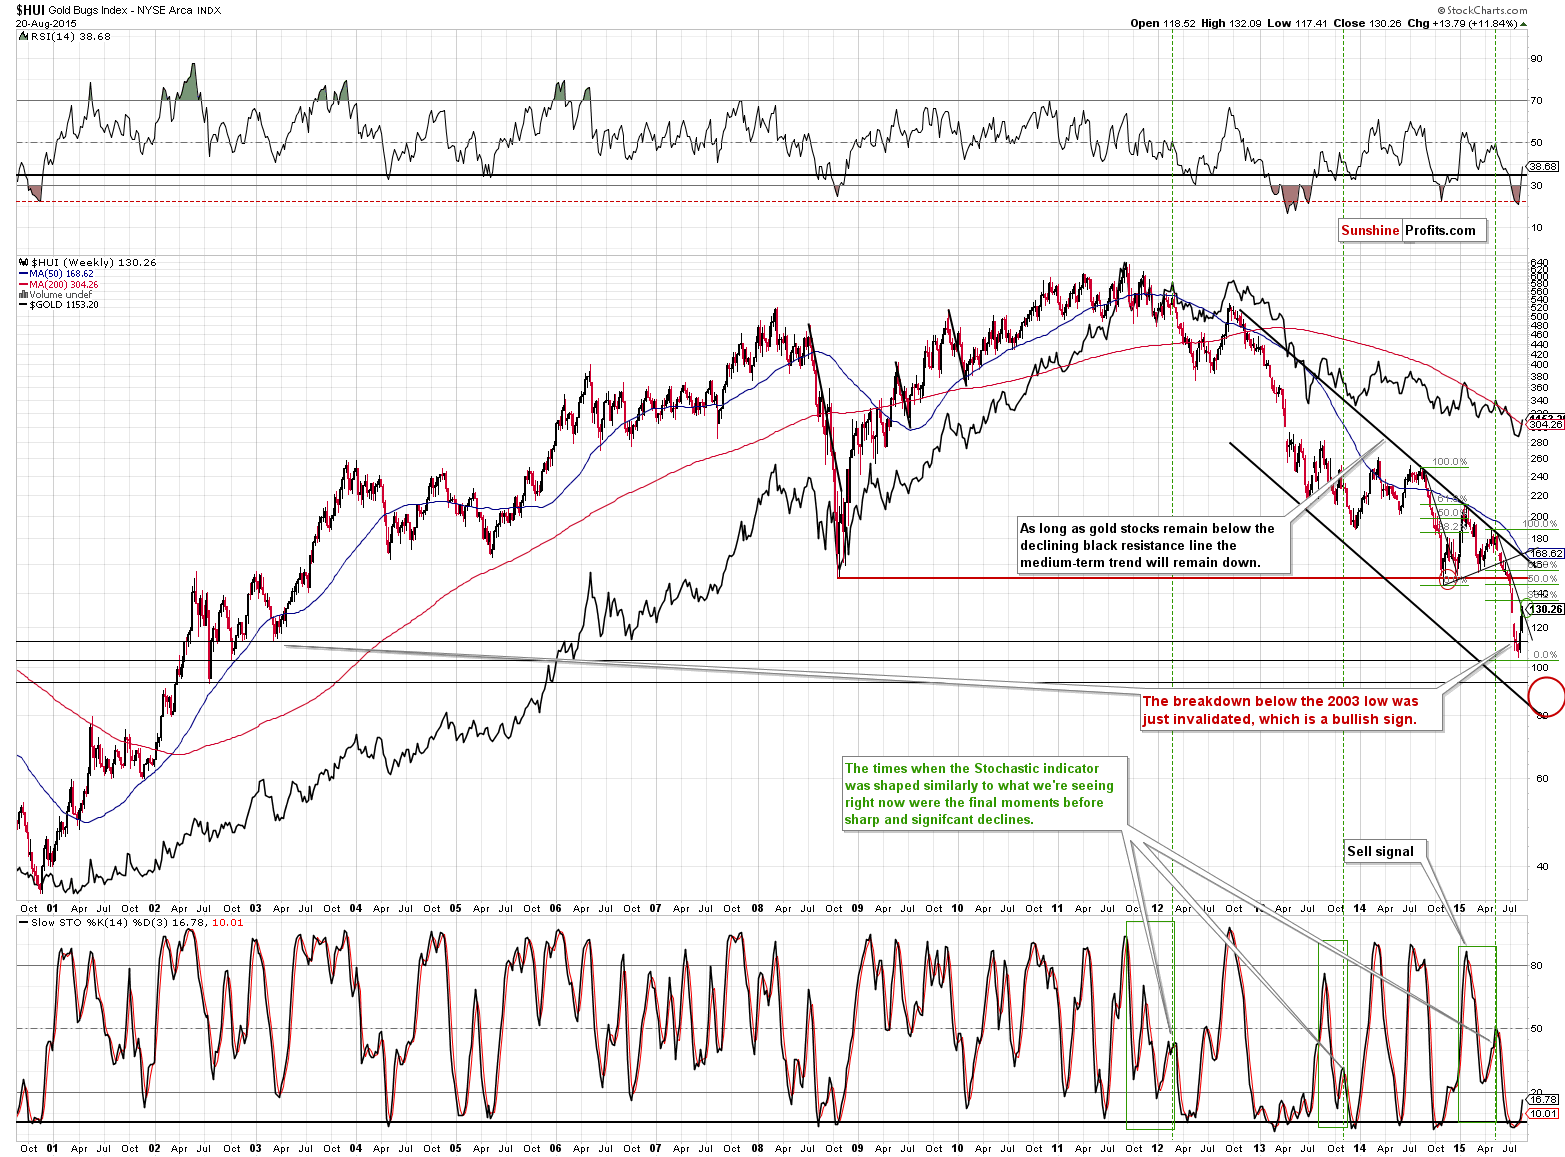
The HUI Index is right in the middle of our target area, so it could run higher, but that’s not imminent.
In the July 27 alert (when we opened the long positions) we wrote the following:
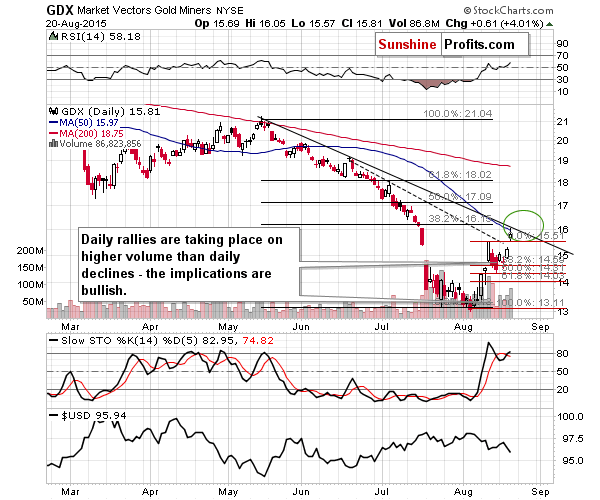
How high will miners rally? Since the recent decline is similar to the previous one in terms of size and sharpness, we might expect the post-decline corrections to be similar as well. In the final part of 2014, gold stocks corrected almost to the 38.2% Fibonacci retracement and moved slightly above the declining short-term resistance line. If we see similar performance also this time, we might expect gold stocks to correct to the target area that we marked green on the above chart.
Again, gold stocks moved higher but not significantly higher and they can rally some more before the move is over.
Yesterday, we wrote the following:
From the short-term point of view, it seems that the rally is close to being over, but not over yet. On a very short-term basis, we have bullish implications from the price-volume link. The volume is higher during the daily upswings than during the daily downswings, so the immediate-term implications are bullish.
The above is quite up-to-date – the price-volume link continues to have bullish implications.
However, the declining resistance line was just hit, which has bearish implications. The 38.2% Fibonacci retracement was almost reached, so we wouldn’t be surprised to see a local top shortly. That’s quite in tune with what other charts were suggesting, though.
All in all, we can summarize the current situation in the same way as we’ve summarized yesterday’s alert:
Summing up, while it doesn’t seem that the medium-term decline is over yet, it also doesn’t seem likely that the counter-trend short-term rally is over. However, there are less factors pointing to higher prices than it was the case yesterday and there are more pointing to lower prices. Consequently, we are taking profits off the table for half of the current long position and leaving the other half intact. We opened this position on July 27 (the alert was posted before the markets opened) and since that time gold has moved higher by (taking the current prices into account - gold is at $1,146 at the moment of writing these words) more than $45, silver by about 90 cents and the GDX ETF rallied by about 13%. However, if you recall, we described what 4 individual stocks our Golden StockPicker and Silver StockPicker had chosen for this trade (GOLD, IAG, SLW and AG) and a trade consisting out of these 4 with equal weights would have gained about 20% since that time.
Depending on how the situation evolves, we will adjust the current trading position accordingly. The most likely outcome in our view is that metals and miners will move a bit higher (which is when we aim to close the remaining half of the current long position) and then continue their decline. How high will gold, silver and miners likely go? The target is unclear in the case of gold (but most likely $1,160 or so), about $16 in the case of silver and about $16 - $16.50 in the case of GDX. It will most likely be bearish confirmations that will make us close the position, not specific price levels being reached, so we are not providing “exit order” levels at this time.
We will keep you – our subscribers – updated.
To summarize:
Trading capital (our opinion): Long position (half) position in gold, silver and mining stocks is justified from the risk/reward perspective with the following stop-loss orders and initial (! – this means that reaching them doesn’t automatically close the position) target prices:
- Gold: initial target price: $1,170; stop-loss: $1,113, initial target price for the UGLD ETN: $10.19; stop loss for the UGLD ETN $8.75
- Silver: initial target price: $16.00; stop-loss: $14.32, initial target price for the USLV ETN: $16.54; stop loss for USLV ETN $11.55
- Mining stocks (price levels for the GDX ETN): initial target price: $16.25; stop-loss: $14.57, initial target price for the NUGT ETN: $5.17; stop loss for the NUGT ETN $3.77
In case one wants to bet on junior mining stocks' prices (we do not suggest doing so – we think senior mining stocks are more predictable in the case of short-term trades – if one wants to do it anyway, we provide the details), here are the stop-loss details and initial target prices:
- GDXJ: initial target price: $24.28; stop-loss: $20.27
- JNUG: initial target price: $15.28; stop-loss: $8.95
Long-term capital (our opinion): No positions
Insurance capital (our opinion): Full position
Please note that a full position doesn’t mean using all of the capital for a given trade. You will find details on our thoughts on gold portfolio structuring in the Key Insights section on our website.
As a reminder – “initial target price” means exactly that – an “initial” one, it’s not a price level at which we suggest closing positions. If this becomes the case (like it did in the previous trade) we will refer to these levels as levels of exit orders (exactly as we’ve done previously). Stop-loss levels, however, are naturally not “initial”, but something that, in our opinion, might be entered as an order.
Since it is impossible to synchronize target prices and stop-loss levels for all the ETFs and ETNs with the main markets that we provide these levels for (gold, silver and mining stocks – the GDX ETF), the stop-loss levels and target prices for other ETNs and ETF (among other: UGLD, DGLD, USLV, DSLV, NUGT, DUST, JNUG, JDST) are provided as supplementary, and not as “final”. This means that if a stop-loss or a target level is reached for any of the “additional instruments” (DGLD for instance), but not for the “main instrument” (gold in this case), we will view positions in both gold and DGLD as still open and the stop-loss for DGLD would have to be moved lower. On the other hand, if gold moves to a stop-loss level but DGLD doesn’t, then we will view both positions (in gold and DGLD) as closed. In other words, since it’s not possible to be 100% certain that each related instrument moves to a given level when the underlying instrument does, we can’t provide levels that would be binding. The levels that we do provide are our best estimate of the levels that will correspond to the levels in the underlying assets, but it will be the underlying assets that one will need to focus on regarding the sings pointing to closing a given position or keeping it open. We might adjust the levels in the “additional instruments” without adjusting the levels in the “main instruments”, which will simply mean that we have improved our estimation of these levels, not that we changed our outlook on the markets. We are already working on a tool that would update these levels on a daily basis for the most popular ETFs, ETNs and individual mining stocks.
Our preferred ways to invest in and to trade gold along with the reasoning can be found in the how to buy gold section. Additionally, our preferred ETFs and ETNs can be found in our Gold & Silver ETF Ranking.
As always, we'll keep you - our subscribers - updated should our views on the market change. We will continue to send out Gold & Silver Trading Alerts on each trading day and we will send additional Alerts whenever appropriate.
The trading position presented above is the netted version of positions based on subjective signals (opinion) from your Editor, and the Tools and Indicators.
As a reminder, Gold & Silver Trading Alerts are posted before or on each trading day (we usually post them before the opening bell, but we don't promise doing that each day). If there's anything urgent, we will send you an additional small alert before posting the main one.
=====
Latest Free Trading Alerts:
We wrote that the devaluation of the yuan had showed how desperate the Chinese government was over the state of the economy. What are the problems China is facing right now? How can they affect the global economy and the gold market?
Is gold a hedge or rather a safe haven? What does it really mean? What is gold supposed to be a safe-haven asset or a hedge in relation to? Does it protect investors from a stock market crash, bond market volatility, inflation, or a systemic crisis? And finally, do the safe-haven properties of gold depend on the country and time horizon?
=====
Hand-picked precious-metals-related links:
GFMS: India gold demand to jump 11% in 2015
=====
In other news:
Tsipras resigns, paving way for snap Greek election
China stocks crash 11% in a week
=====
Thank you.
Sincerely,
Przemyslaw Radomski, CFA
Founder, Editor-in-chief
Gold & Silver Trading Alerts
Forex Trading Alerts
Oil Investment Updates
Oil Trading Alerts

