

Briefly: In our opinion no speculative positions are currently justified from the risk/reward perspective. Being on the long side of the precious metals market with half of the long-term investment capital seems justified from the risk/reward perspective.
Gold rallied much higher yesterday and the move materialized on huge volume. Were 2 days of intra-day corrections enough and is the next big upswing already underway?
It certainly could be the case, but it seems quite likely that we will see a corrective downswing relatively soon (even if we don’t see one today). The reasons are present in gold, silver and mining stock charts, but let’s start today’s analysis with the USD Index (charts courtesy of http://stockcharts.com).
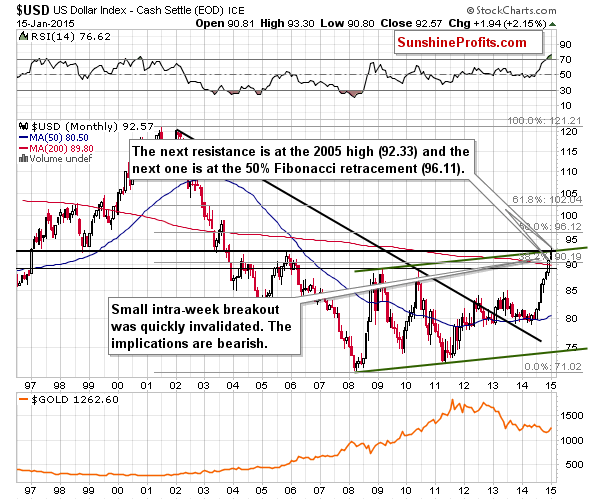
The USD Index moved sharply back and forth yesterday, moving above the declining resistance line. It didn’t end the session above it, so there was no breakout.
The USD Index has been trading below the resistance for some time now and it paused at the cyclical turning point. Perhaps the pause was the effect that the turning point had – the trend might have been too strong for this signal to generate a decline.
Is a breakout about to materialize? The above implies that it’s no longer very unlikely. It’s not very likely either, but we need to take into account that the surprising news from Switzerland caused turbulence in many markets and it might make investors much more willing to purchase U.S. dollars.
Consequently, the positive impact that the USD Index was very likely to have on the gold market in the following weeks, might be delayed and happen after the USD Index reaches the next strong resistance – the 61.8% Fibonacci retracement slightly above the 96 level.
Since we commented on gold’s upswing in yesterday’s alert and gold didn’t do much after we sent it, our previous comments remain up-to-date:
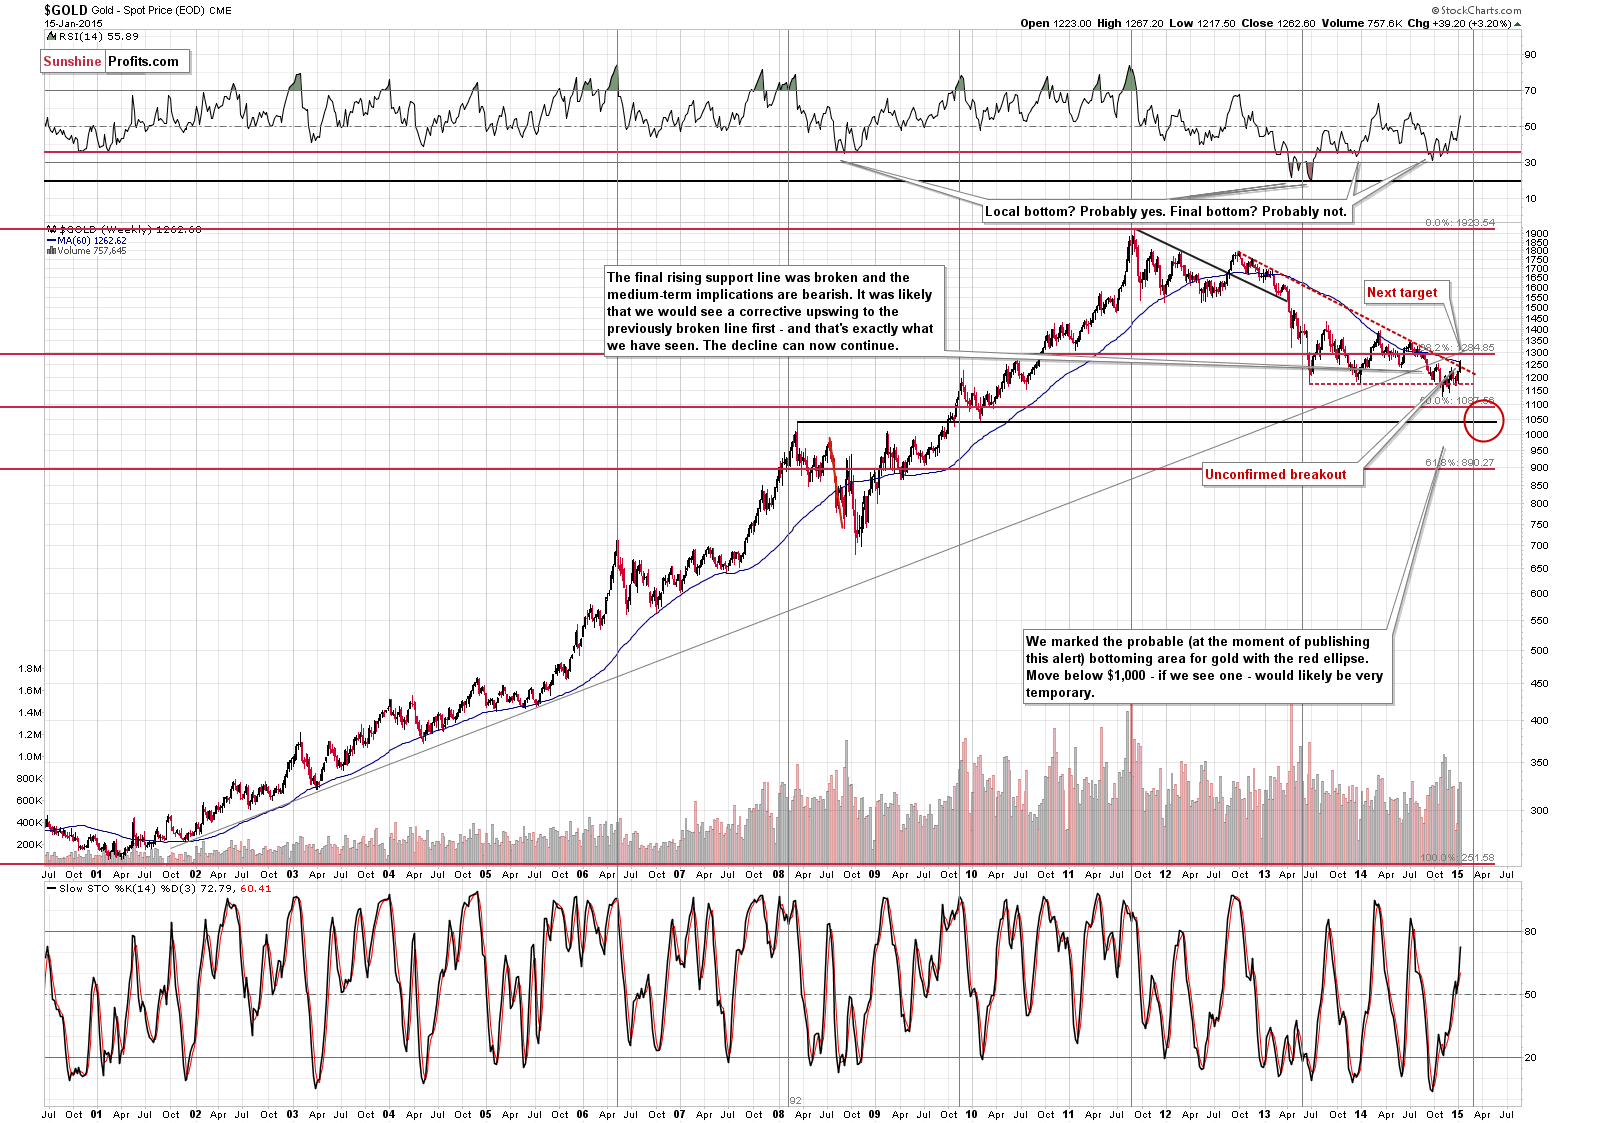
(…) we have just seen a move to a declining medium-term resistance line, which means that a local top could be in. The resistance is relatively strong, so even if gold is to move higher in the coming weeks, we could still see a corrective downswing shortly.
Gold moved above this resistance line, but at this time the breakout is not confirmed – we would have to see 2 additional daily closes above it.
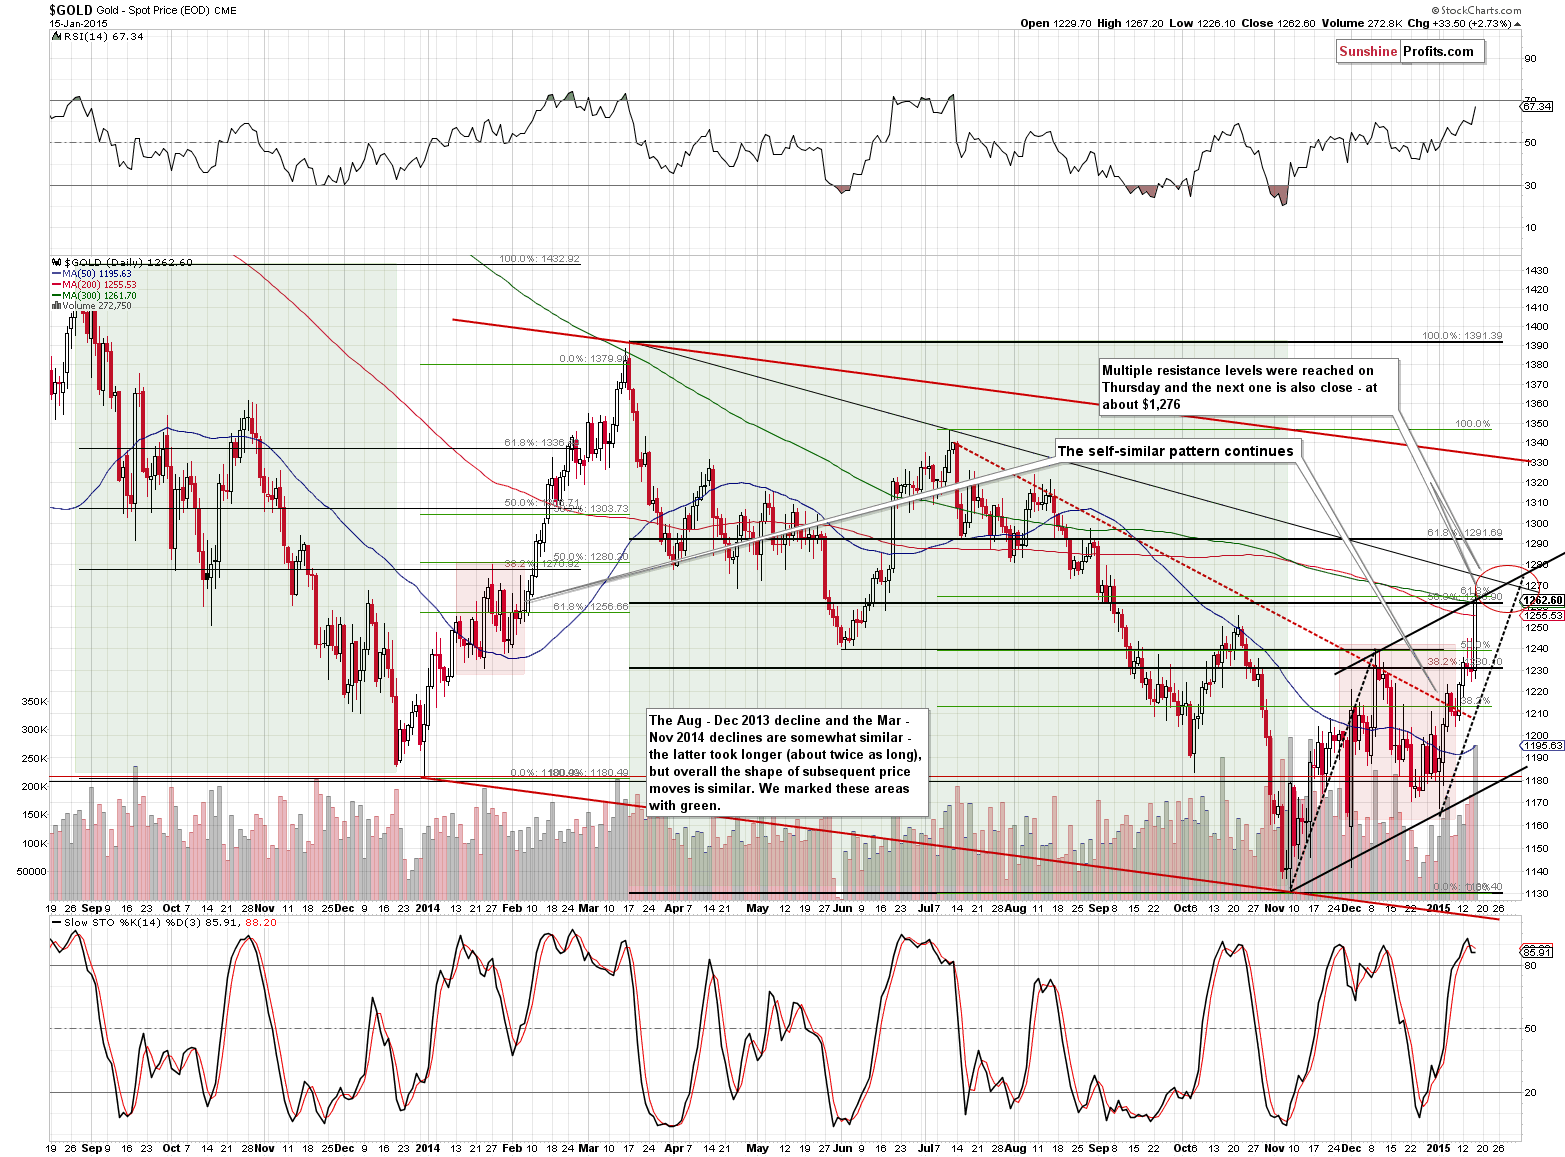
Before yesterday’s Switzerland-based price action it was likely that gold would move lower first and start another rally to $1,260 - $1,280 a little later. However, gold has already moved slightly above the $1,260 level. Is the top in? It seems likely that we are in a situation similar to what happened on Dec. 1, 2014. The outlook seems similar as well – since today’s action is single-event-based, we could see some more strength today as investors and traders react to news from Switzerland, but we could see a correction in the following days. Please note that there has been no visible correction since the beginning of this year and the current rally is much sharper than the previous (Nov. – Dec. 2014) one.
Please note that gold reached several support levels – the 300-day moving average, the 61.8% Fibonacci retracement based on the July – November decline and also the rising resistance line that is parallel to the line based on the Nov. and Jan. lows. Even if the combination of these resistance levels doesn’t stop the rally, the next strong resistance is just a little higher – at about $1,276.
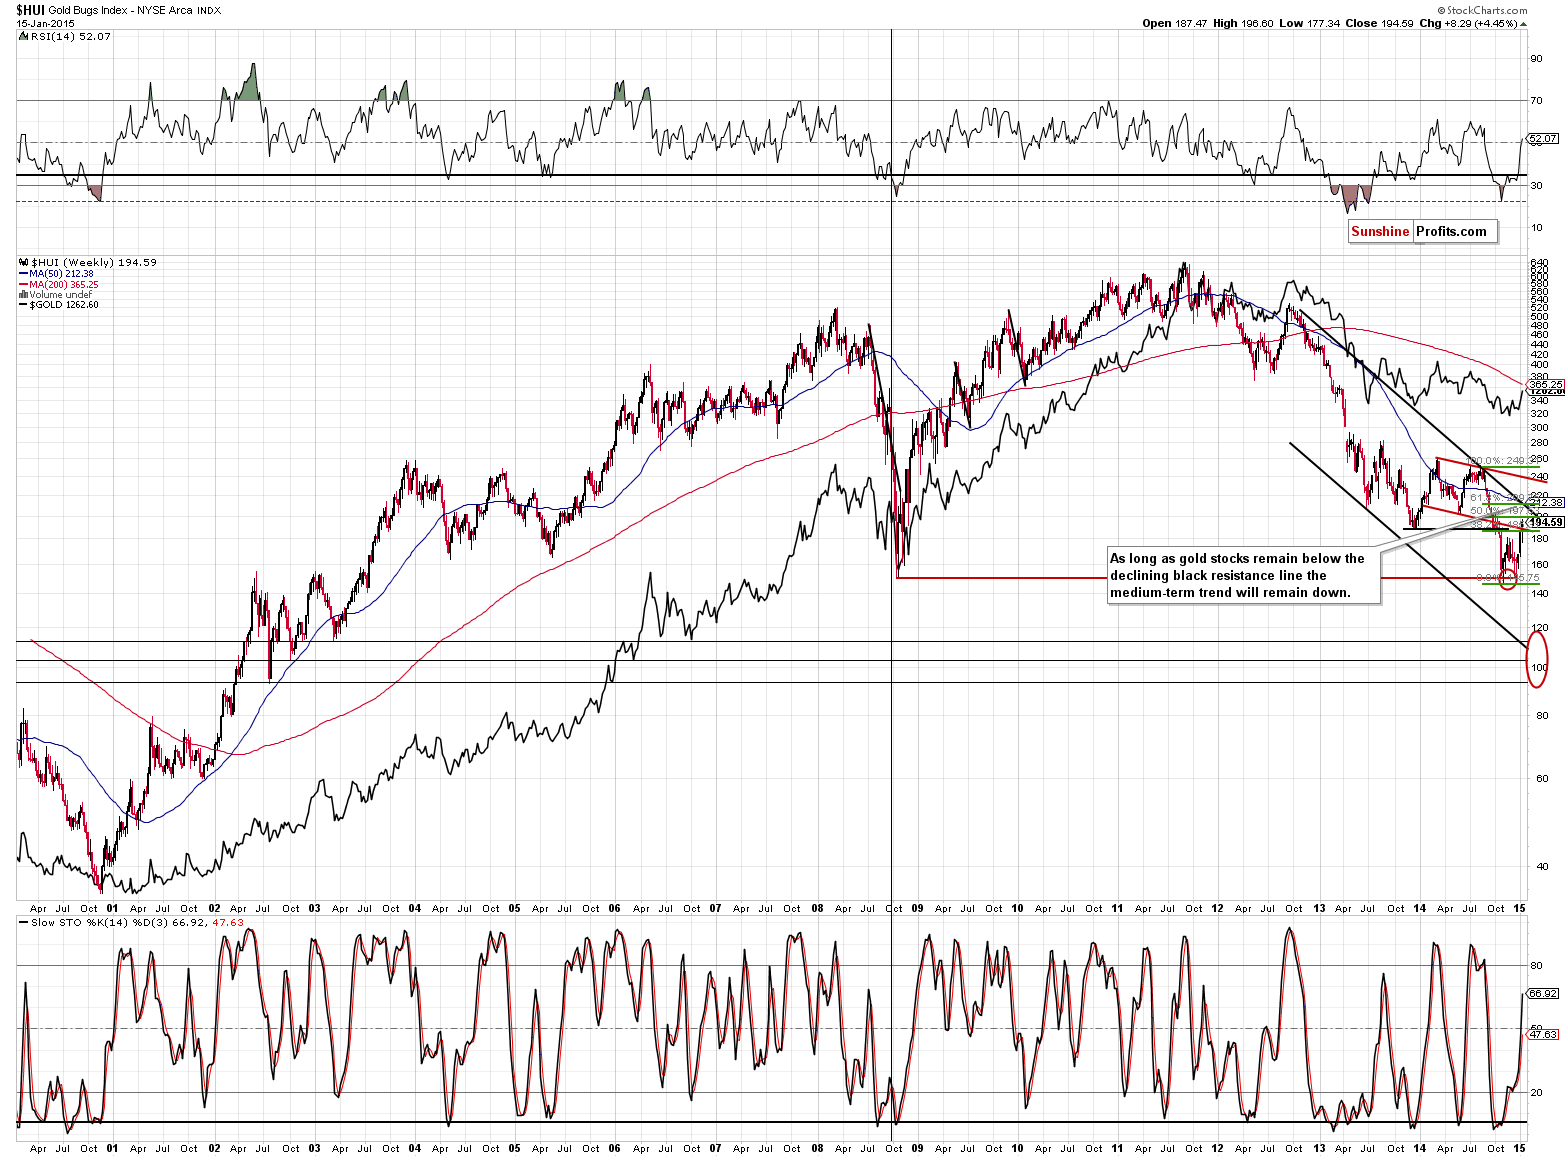
The HUI Index (proxy for gold stocks) moved visibly higher yesterday and is once again above the 2013 lows. However, at the same time we need to keep in mind that while gold moved much above the previous 2015 highs, gold stocks didn’t, which might be viewed as bearish. The situation is rather unclear here.
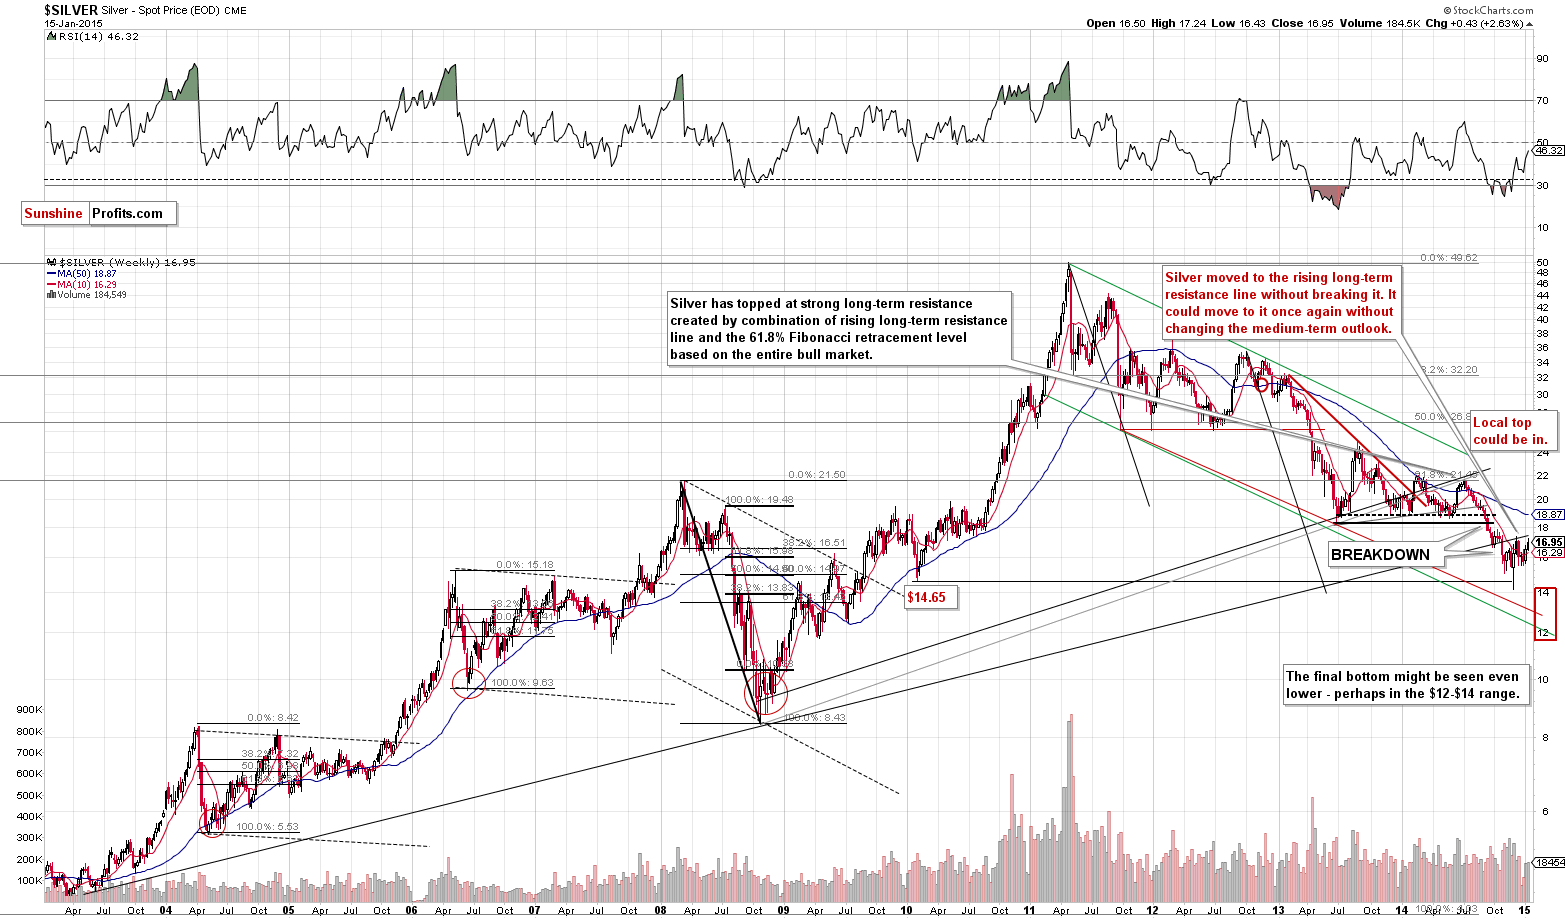
The silver chart tells us that the medium-term trend remains down - there was not even a move back above the rising long-term resistance line. Have we reached a local top? It’s quite likely that we’re close to one (as the long-term resistance is close), but the above chart doesn’t tell us if it’s already behind us.
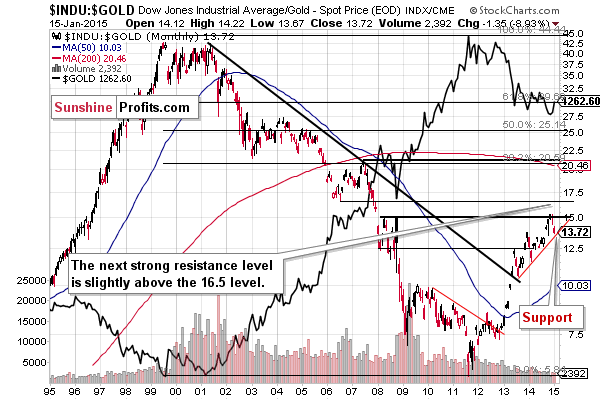
Because of the rising red support line, the Dow to gold ratio chart tells us that this ratio could move lower, but it’s not likely to move much lower before stopping or pausing. This means that gold could move higher but not likely much higher before stopping or pausing.
Summing up, gold moved much higher yesterday, but it could be the case that this single-event-driven rally will be followed by a short-term correction when the situation in the Swiss franc stabilizes. The breakout above the medium-term resistance line in gold is not confirmed, so there are no significant bullish implications. Consequently, it seems that being out of the precious metals market with the speculative capital is justified from the risk/reward perspective – at least for now.
The USD Index is moving higher today and gold is holding up relatively well. Closely monitoring the gold-USD link will be crucial in the following days. If the USD Index breaks out, it will likely provide us with some kind of opportunity. It will depend on gold’s performance what kind of opportunity will that be – gold’s weakness could make us open short positions, while gold’s reluctance to decline could make us prepare for another long trade and perhaps increase the investment position. We’ll keep you – our subscribers – informed.
To summarize:
Trading capital (our opinion): No positions
Long-term capital (our opinion): Half positions in gold, half positions in silver, half position in platinum and half position in mining stocks.
Insurance capital (our opinion): Full position
Please note that a full position doesn’t mean using all of the capital for a given trade. You will find details on our thoughts on gold portfolio structuring in the Key Insights section on our website.
As a reminder – “initial target price” means exactly that – an “initial” one, it’s not a price level at which we suggest closing positions. If this becomes the case (like it did in the previous trade) we will refer to these levels as levels of exit orders (exactly as we’ve done previously). Stop-loss levels, however, are naturally not “initial”, but something that, in our opinion, might be entered as an order.
Since it is impossible to synchronize target prices and stop-loss levels for all the ETFs and ETNs with the main markets that we provide these levels for (gold, silver and mining stocks – the GDX ETF), the stop-loss levels and target prices for other ETNs and ETF (among other: UGLD, DGLD, USLV, DSLV, NUGT, DUST, JNUG, JDST) are provided as supplementary, and not as “final”. This means that if a stop-loss or a target level is reached for any of the “additional instruments” (DGLD for instance), but not for the “main instrument” (gold in this case), we will view positions in both gold and DGLD as still open and the stop-loss for DGLD would have to be moved lower. On the other hand, if gold moves to a stop-loss level but DGLD doesn’t, then we will view both positions (in gold and DGLD) as closed. In other words, since it’s not possible to be 100% certain that each related instrument moves to a given level when the underlying instrument does, we can’t provide levels that would be binding. The levels that we do provide are our best estimate of the levels that will correspond to the levels in the underlying assets, but it will be the underlying assets that one will need to focus on regarding the sings pointing to closing a given position or keeping it open. We might adjust the levels in the “additional instruments” without adjusting the levels in the “main instruments”, which will simply mean that we have improved our estimation of these levels, not that we changed our outlook on the markets. We are already working on a tool that would update these levels on a daily basis for the most popular ETFs, ETNs and individual mining stocks.
Our preferred ways to invest in and to trade gold along with the reasoning can be found in the how to buy gold section. Additionally, our preferred ETFs and ETNs can be found in our Gold & Silver ETF Ranking.
As always, we'll keep you - our subscribers - updated should our views on the market change. We will continue to send out Gold & Silver Trading Alerts on each trading day and we will send additional Alerts whenever appropriate.
The trading position presented above is the netted version of positions based on subjective signals (opinion) from your Editor, and the automated tools (SP Indicators and the upcoming self-similarity-based tool).
As a reminder, Gold & Silver Trading Alerts are posted before or on each trading day (we usually post them before the opening bell, but we don't promise doing that each day). If there's anything urgent, we will send you an additional small alert before posting the main one.
=====
Latest Free Trading Alerts:
The S&P 500 index extended its recent move down slightly. Will this downtrend continue?
Earlier today, Switzerland's central bank decided to scrap its policy of capping the Swiss franc at 1.20 to the euro, which boosted the Swiss franc against other currencies. As a result, EUR/CHF dropped under a very important support level, which triggered a sharp decline that approached the exchange rate to the levels that we saw in 2011. How much more room to decline does the pair have?
Forex Trading Alert: Swiss Franc Shoots Up!
=====
Hand-picked precious-metals-related links:
Swiss shock no 'game changer' for gold?
China Continues To Drain Global Gold Inventory
In 2015 outlook, Goldman growls about gold
Lust for gold eating up the world’s last rainforests: study
=====
In other news:
Casualties From Swiss Shock Spread From New York to New Zealand
Europe on Alert as Police Swoop on Terrorist Suspects
Forex broker Alpari UK enters insolvency after SNB shock
=====
Thank you.
Sincerely,
Przemyslaw Radomski, CFA
Founder, Editor-in-chief
Gold & Silver Trading Alerts
Forex Trading Alerts
Oil Investment Updates
Oil Trading Alerts

