

The third quarter of the year is behind us. How did gold perform in the past three months?
Gold Run Out of Steam
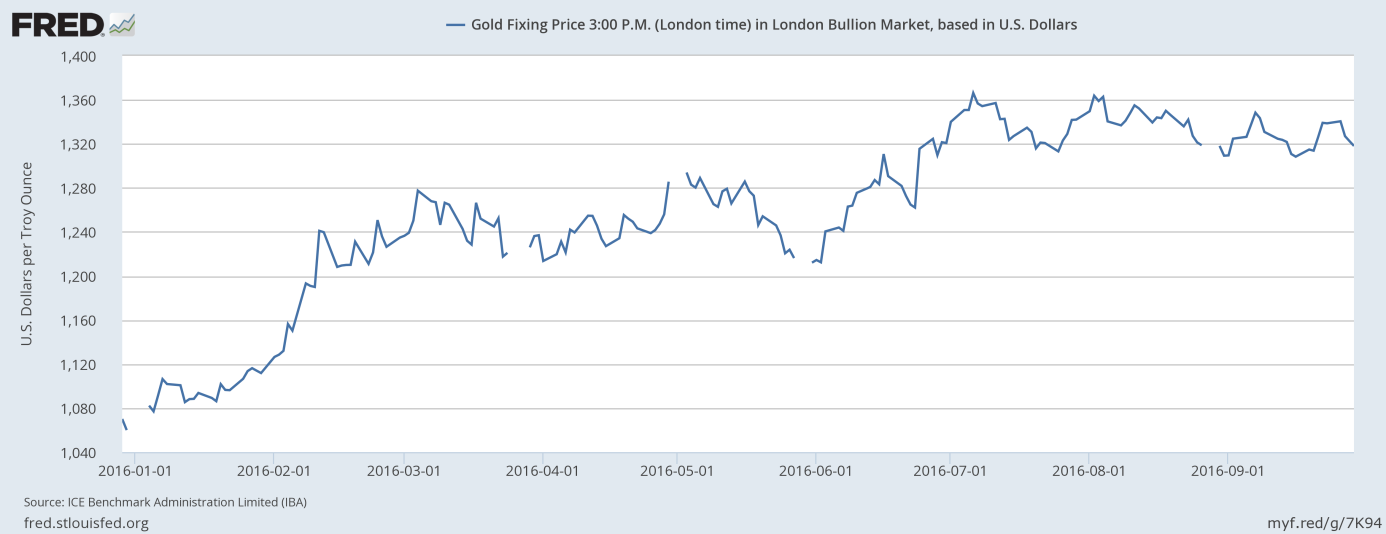
The two first quarters of 2016 were excellent for the shiny metal. Gold gained about 25 percent and was one of the best performing assets at that time. In the third quarter, the yellow metal run out of steam and remained in a trading range between $1,320 and $1,360, as one can see in the chart below. Now, we know that this sideways market was calm before the October storm.
Chart 1: The price of gold (London P.M. Fix, index) over the last three quarters.
Gold and the U.S. Dollar
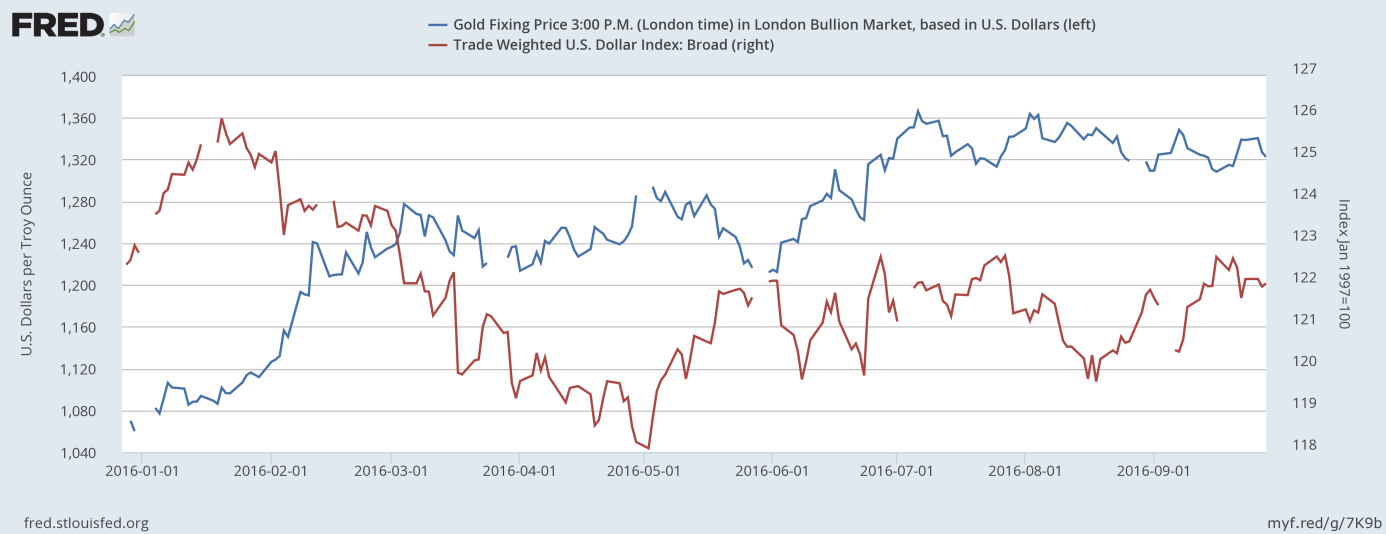
What were the fundamental factors behind gold’s behavior in the third quarter of the year? The next chart shows that the price of gold was negatively correlated with the U.S. dollar. The greenback was also trading sideways in that period.
Chart 2: The price of gold (blue line, left axis, London P.M. fix) and the broad trade-weighted U.S. dollar index (red line, right axis) over the last nine months.
Gold and Real Interest Rates
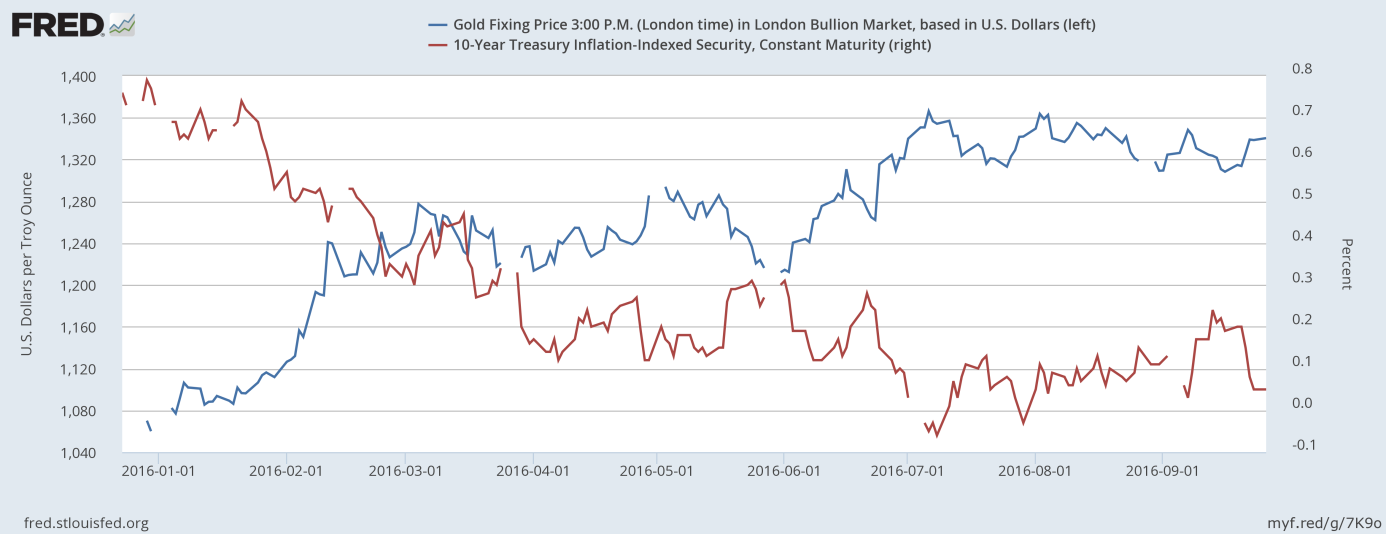
The third chart suggests that changes in real interest rates also contributed significantly to gold’s performance. The mirror-image symmetry between the price of gold and real interest rates confirms that the shiny metal is a monetary asset strongly influenced in the medium and long term by the Fed’s actions and U.S. macroeconomic factors.
Chart 3: The price of gold (blue line, left axis, London P.M. Fix) and real interest rates (red line, right axis, 10-year inflation-indexed Treasuries) over the last nine months.
Other Key Factors in the Gold Market in Q3 2016
As a reminder, gold rallied at the turn of June and July due to the surprising outcome of the Brexit vote. However, the yellow metal did not surge further as the British referendum exerted less drag on economic activity than previously anticipated. Gold was moving sideways as the Fed vacillated between hawkish and dovish messages. On the one hand, inflation remained low, while U.S. economic growth slowed. On the other hand, the near-term risks were reduced and the labor market remained solid. Finally, the Fed chickened out again in September, but it soon started telegraphing high chances of a rate hike in December, which sent gold prices south in October.
Conclusions
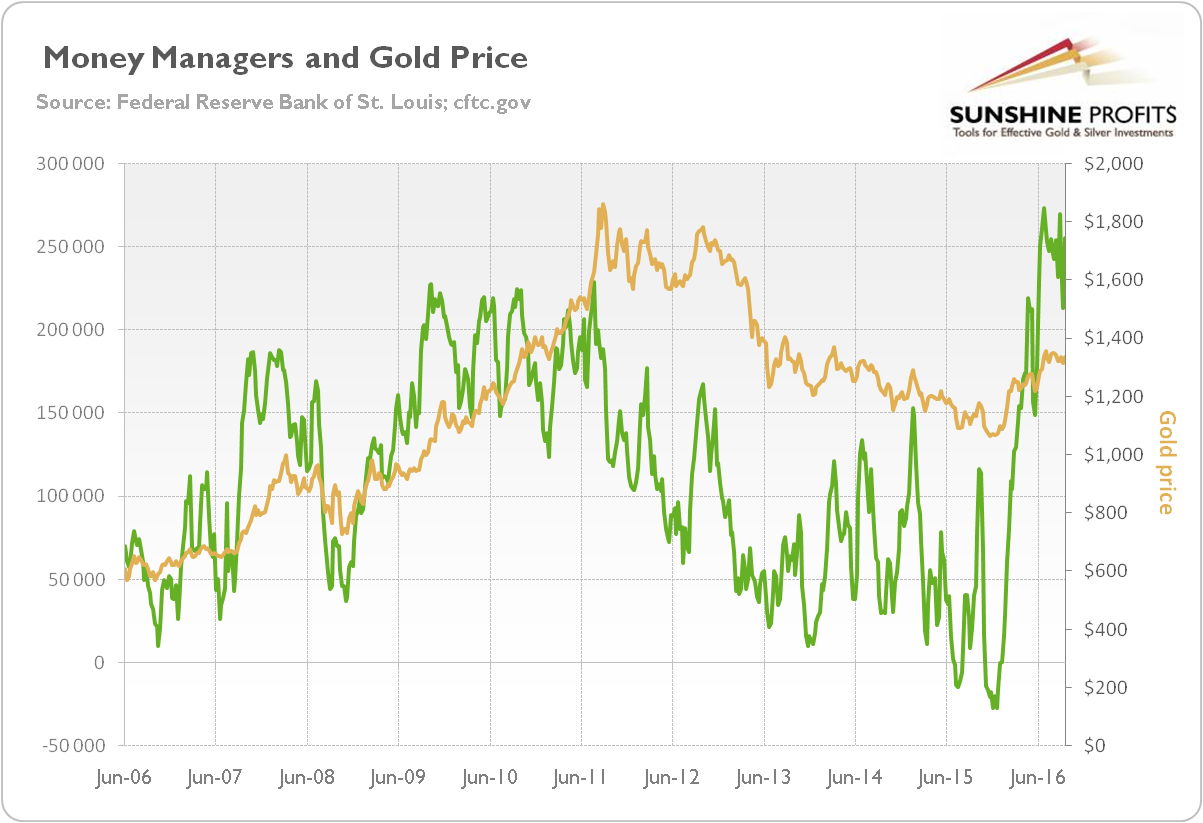
The bottom line is that gold prices fell 1.6 percent in the third quarter of 2016, but the declines came at the end of September. For the most of the period, the shiny metal was trading sideways. The main factors behind such indecisive performance were inconsistent messages from the Fed and no clear trend in the U.S. dollar and real interest rates. Moreover, the uncertainty about global economy eased, while the Bank of Japan did not cut interest rates further into negative territory. Therefore, when the odds of the Fed hike in December rose in October, the price of gold plunged, as there was no support from safe-haven bids. And the gold market was a bit overbought, as one can see in the chart below which presents the net Comex position of money managers.
Chart 4: The price of gold (yellow line, right axis, London P.M. Fix) and the net Comex position of money managers (green line, left axis), from 2006 to September 27, 2016.
Therefore, although fundamental factors are very important, the technical situation also needs to be taken into account while making an investment decision. The outlook for the gold market in the fourth quarter of 2016 is bearish. If history is any guide, the price of gold should be under downward pressure from the hawkish messages from the Fed and expectations of interest rates hike in December.
If you enjoyed the above analysis, we invite you to check out our other services. We focus on fundamental analysis in our monthly Market Overview reports and we provide daily Gold & Silver Trading Alerts with clear buy and sell signals. If you’re not ready to subscribe yet and are not on our mailing list yet, we urge you to join our gold newsletter today. It’s free and if you don’t like it, you can easily unsubscribe.
Disclaimer: Please note that the aim of the above analysis is to discuss the likely long-term impact of the featured phenomenon on the price of gold and this analysis does not indicate (nor does it aim to do so) whether gold is likely to move higher or lower in the short- or medium term. In order to determine the latter, many additional factors need to be considered (i.e. sentiment, chart patterns, cycles, indicators, ratios, self-similar patterns and more) and we are taking them into account (and discussing the short- and medium-term outlook) in our trading alerts.
Thank you.
Arkadiusz Sieron
Sunshine Profits‘ Gold News Monitor and Market Overview Editor
Gold News Monitor
Gold Trading Alerts
Gold Market Overview

