

Forex Trading Alert originally sent to subscribers on April 7, 2016, 11:16 AM.
Earlier today, the yen moved sharply higher against the greenback on safe-haven buying and Bank of Japan Governor Haruhiko Kuroda comments (Kuroda said that easy monetary policies work and Japan is not headed for a recession). As a result, USD/JPY dropped under 109. How low could the pair go in the coming days?
In our opinion the following forex trading positions are justified - summary:
- EUR/USD: short (stop-loss order at 1.1512; initial downside target at 1.0572)
- GBP/USD: none
- USD/JPY: none
- USD/CAD: none
- USD/CHF: none
- AUD/USD: none
EUR/USD
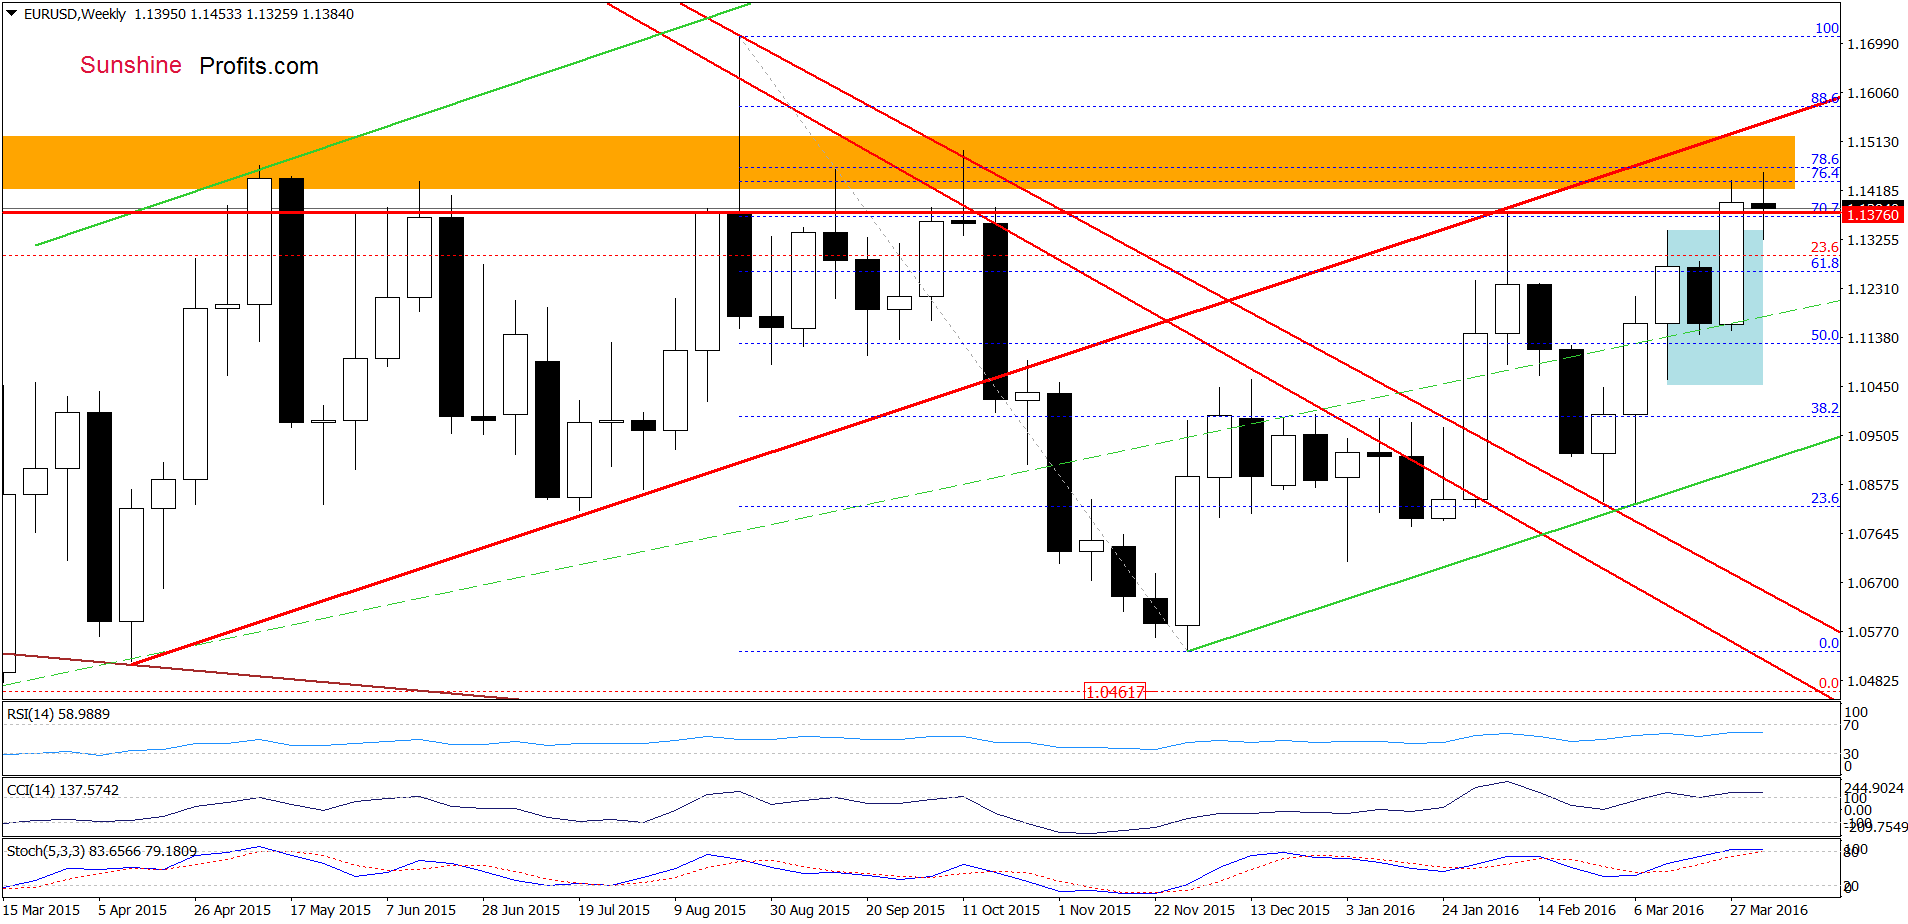
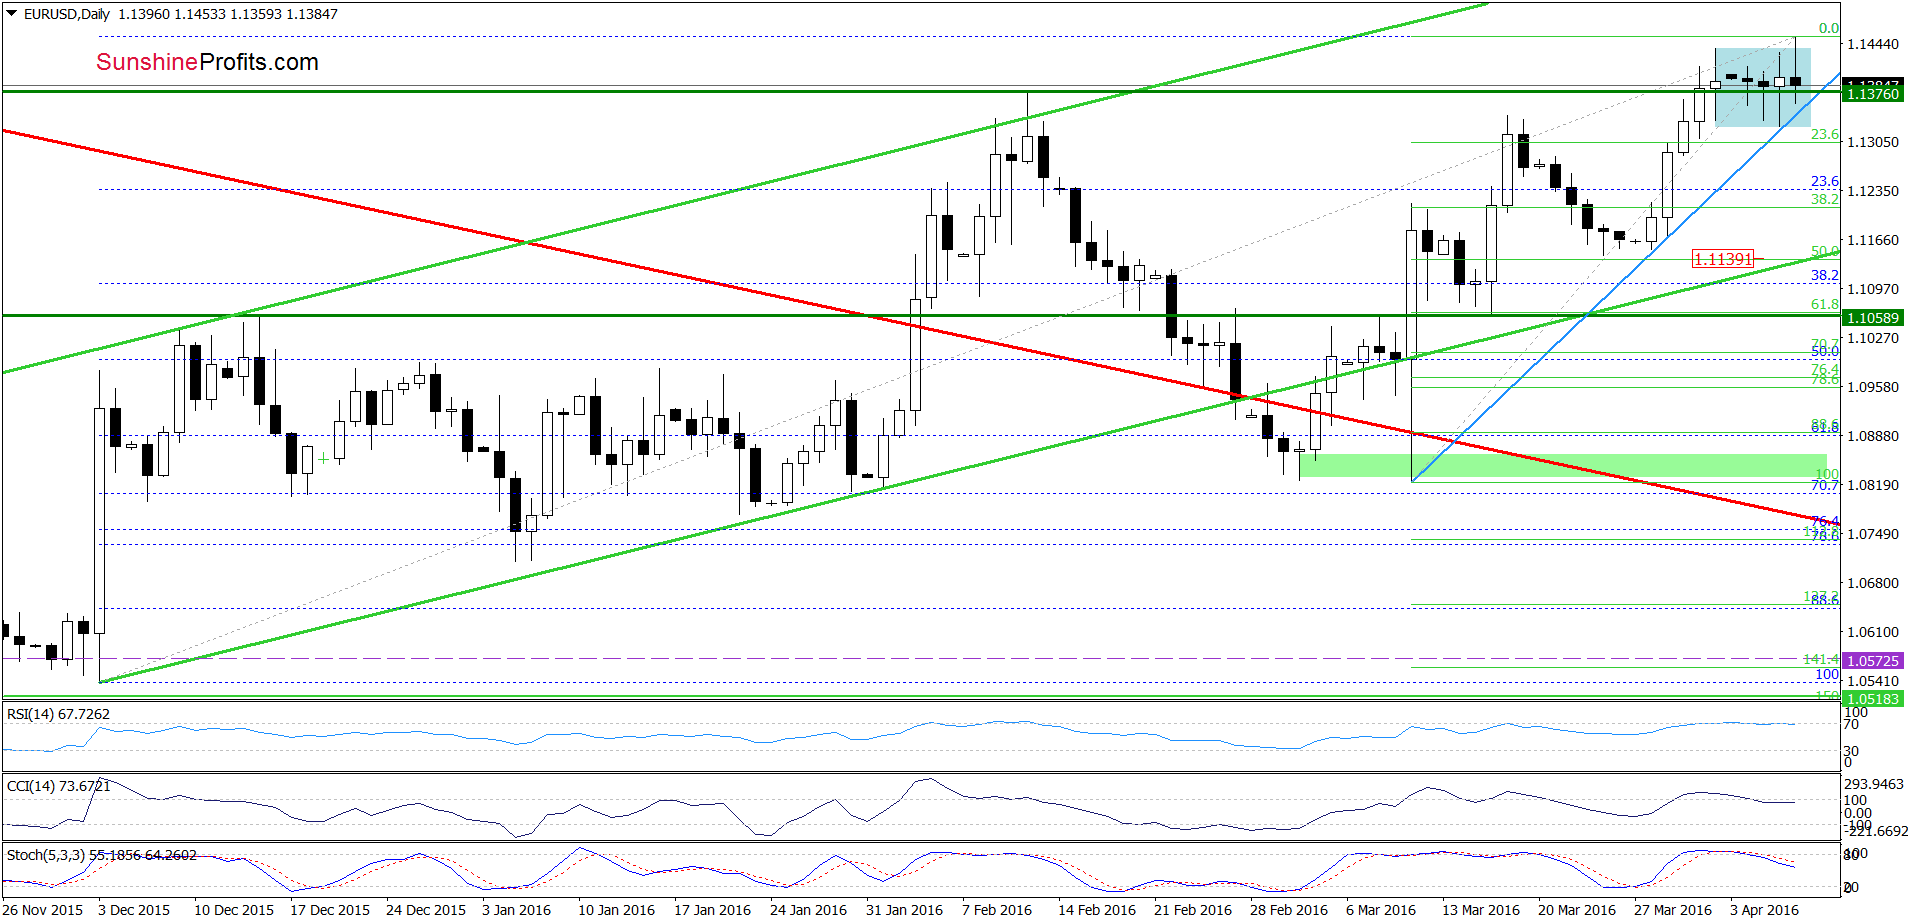
On the above charts, we see that although EUR/USD climbed above previous highs earlier today, this improvement was very temporary and the pair reversed quickly, slipping under the Feb high. Taking this fact into account, and combining it with the current position of the indicators, we believe that what we wrote yesterday is up-to-date also today:
(…) Although this is a negative signal (an invalidation of the breakout), we think that it would be more reliable if we see a daily closure below the orange area. Finishing today’s commentary on this currency pair, it is worth noting that all indicators generated sell signals ,which suggests that further deterioration is just around the corner. Nevertheless, such price action will be more likely if the exchange rate drops under the blue support line based on the previous lows and the lower border of the blue consolidation. In this case, the pair will likely accelerate declines and drop to around 1.1200, where the 38.2% Fibonacci retracement (based on the recent upward move) is.
Yesterday we received an interesting question from one of our readers and we decided to take a closer look at the chart of EUR/USD from different perspective.
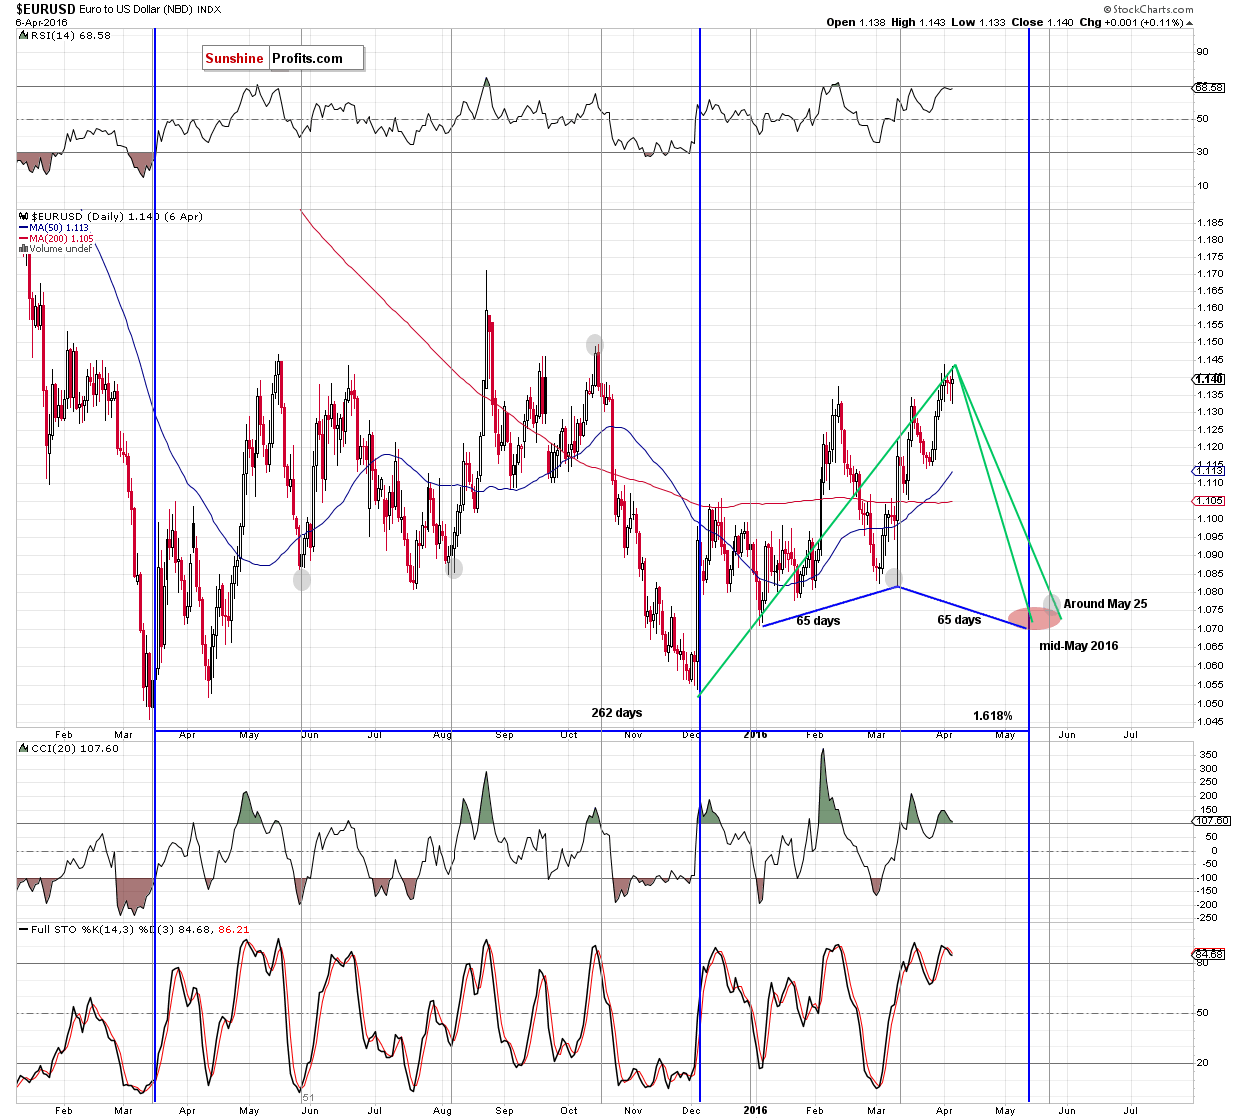
On the above chart, we checked several time measuring techniques to try to estimate where the next (more important) bottom in EUR/USD could be. As the first method we checked direct time cycles based on Fibonacci ratios (marked with green). In this case, we measured the length of the upward move between Dec 3 and today (126 days) and we multiplied the result by 38.2%, which gave us 38 days. If we add these days to today's date, we’ll receive the date May 15, which suggests that in mid-May the probability of reversal would increase. The next date, which could bring the reversal, would be around May 27 (126 days * 50%). The next method is based on low-to-low cycles (marked with blue). As you see on the chart, we measured the number of days between the Mar 16 and Dec 3 lows and multiplied the result by 161.8%. Thanks to this method we received the date May 14, which is next to our previous result. Additionally, if we add 65 days (the difference between the Jan 5 and Mar 10 lows) to the Mar 10 low, we’ll also receive May 14 (low-to-low). On the above chart, we also marked cyclical turning points (with grey), which indicate another reversal around May 25. Connecting the dots, we could see further deterioration in EUR/USD to mid- or even late-May. Nevertheless, please keep in mind that the above dates are only approximate and we’ll focus mainly on the technical picture of this currency pair.
Very short-term outlook: bearish
Short-term outlook: bearish
MT outlook: mixed with bearish bias
LT outlook: mixed
Trading position (short-term; our opinion): Short positions (with a stop-loss order at 1.1512 and the initial downside target at 1.0572) are justified from the risk/reward perspective. We will keep you informed should anything change, or should we see a confirmation/invalidation of the above.
GBP/USD
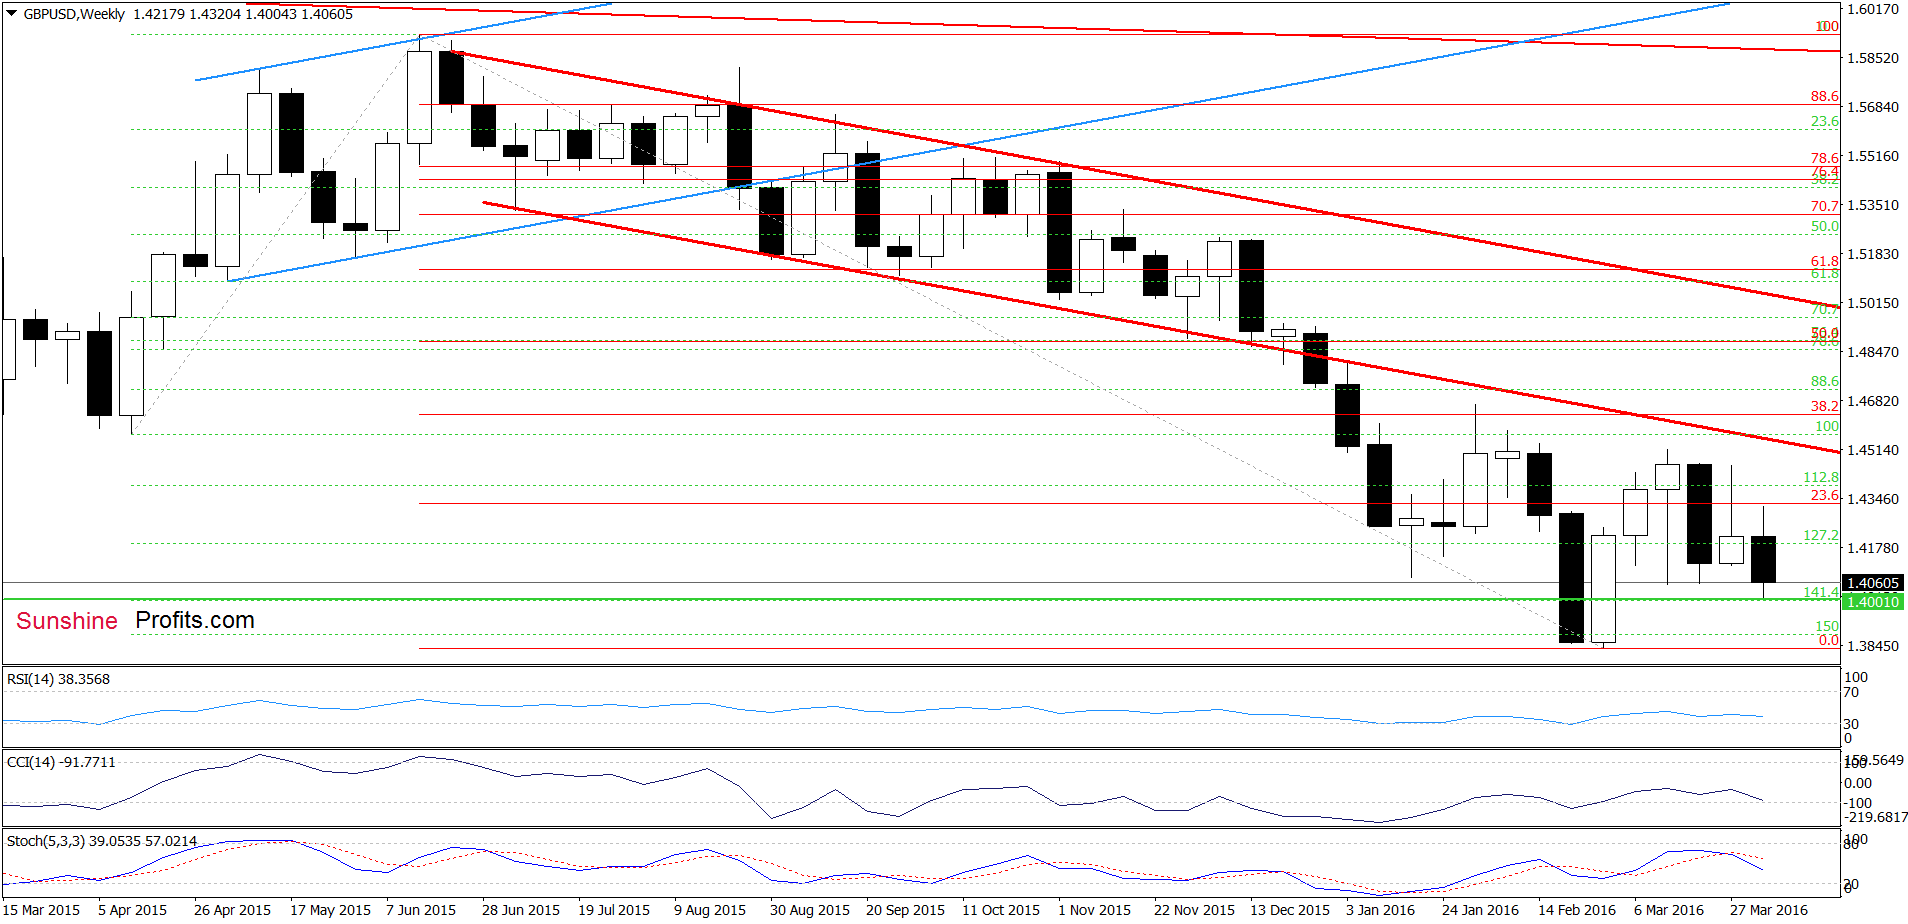
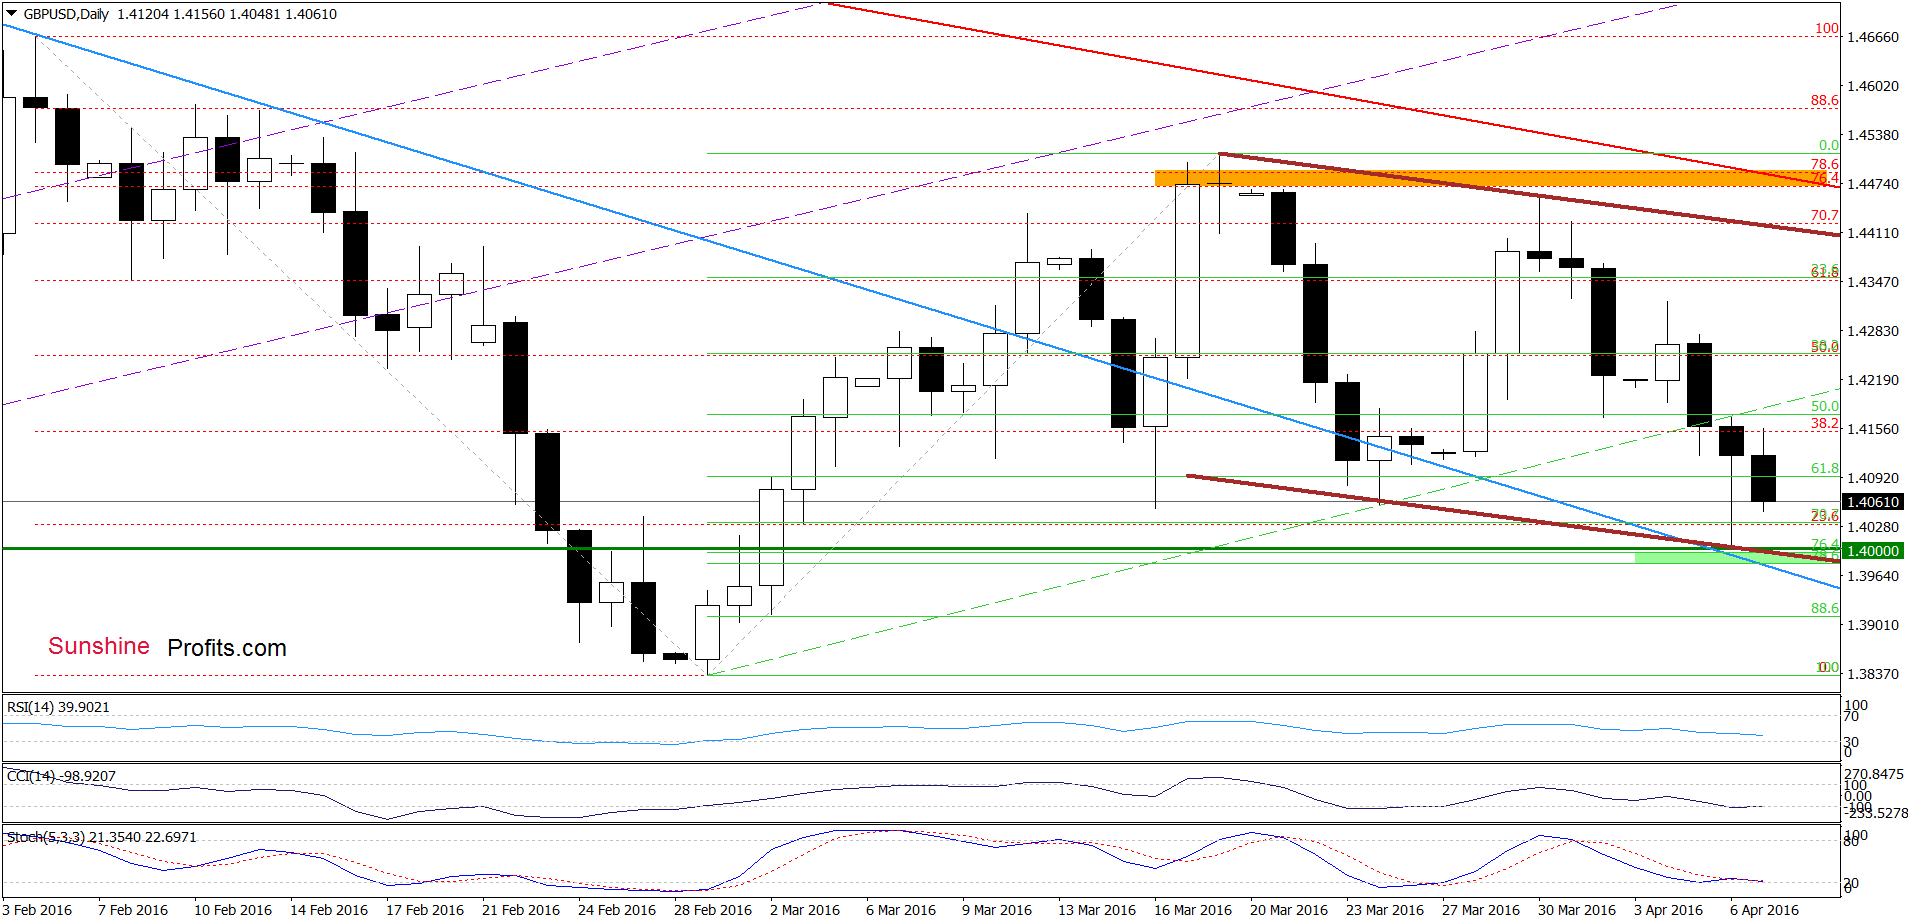
Looking at the above charts, we see that sell signals generated by the indicators encouraged currency bears to act, which resulted in another decline under the green support dashed line based on the previous lows. This negative signal triggered further deterioration and a drop to the lower border of the brown declining trend channel. In this way, GBP/USD tested the strength of the barrier of 1.4000, which resulted in a rebound yesterday. Despite this move, the exchange rate reversed earlier today, which suggests that we’ll see another test of the green support zone (created by the 76.4% and 78.6% Fibonacci retracements, the barrier of 1.4000 and the lower line of the trend channel) in the coming day(s). Nevertheless, we should keep in mind that the CCI and Stochastic Oscillator are oversold and very close to generating buy signals, which in combination with this solid support area will likely encourage currency bulls to act and we’ll see a reversal in near future.
Very short-term outlook: mixed
Short-term outlook: mixed
MT outlook: mixed
LT outlook: mixed
Trading position (short-term; our opinion): No positions are justified from the risk/reward perspective at the moment. We will keep you informed should anything change, or should we see a confirmation/invalidation of the above.
USD/JPY
On Monday, we wrote the following:
(…) it seems to us that the exchange rate will re-test the strength of the green support zone in the coming week.
On Tuesday, we added:
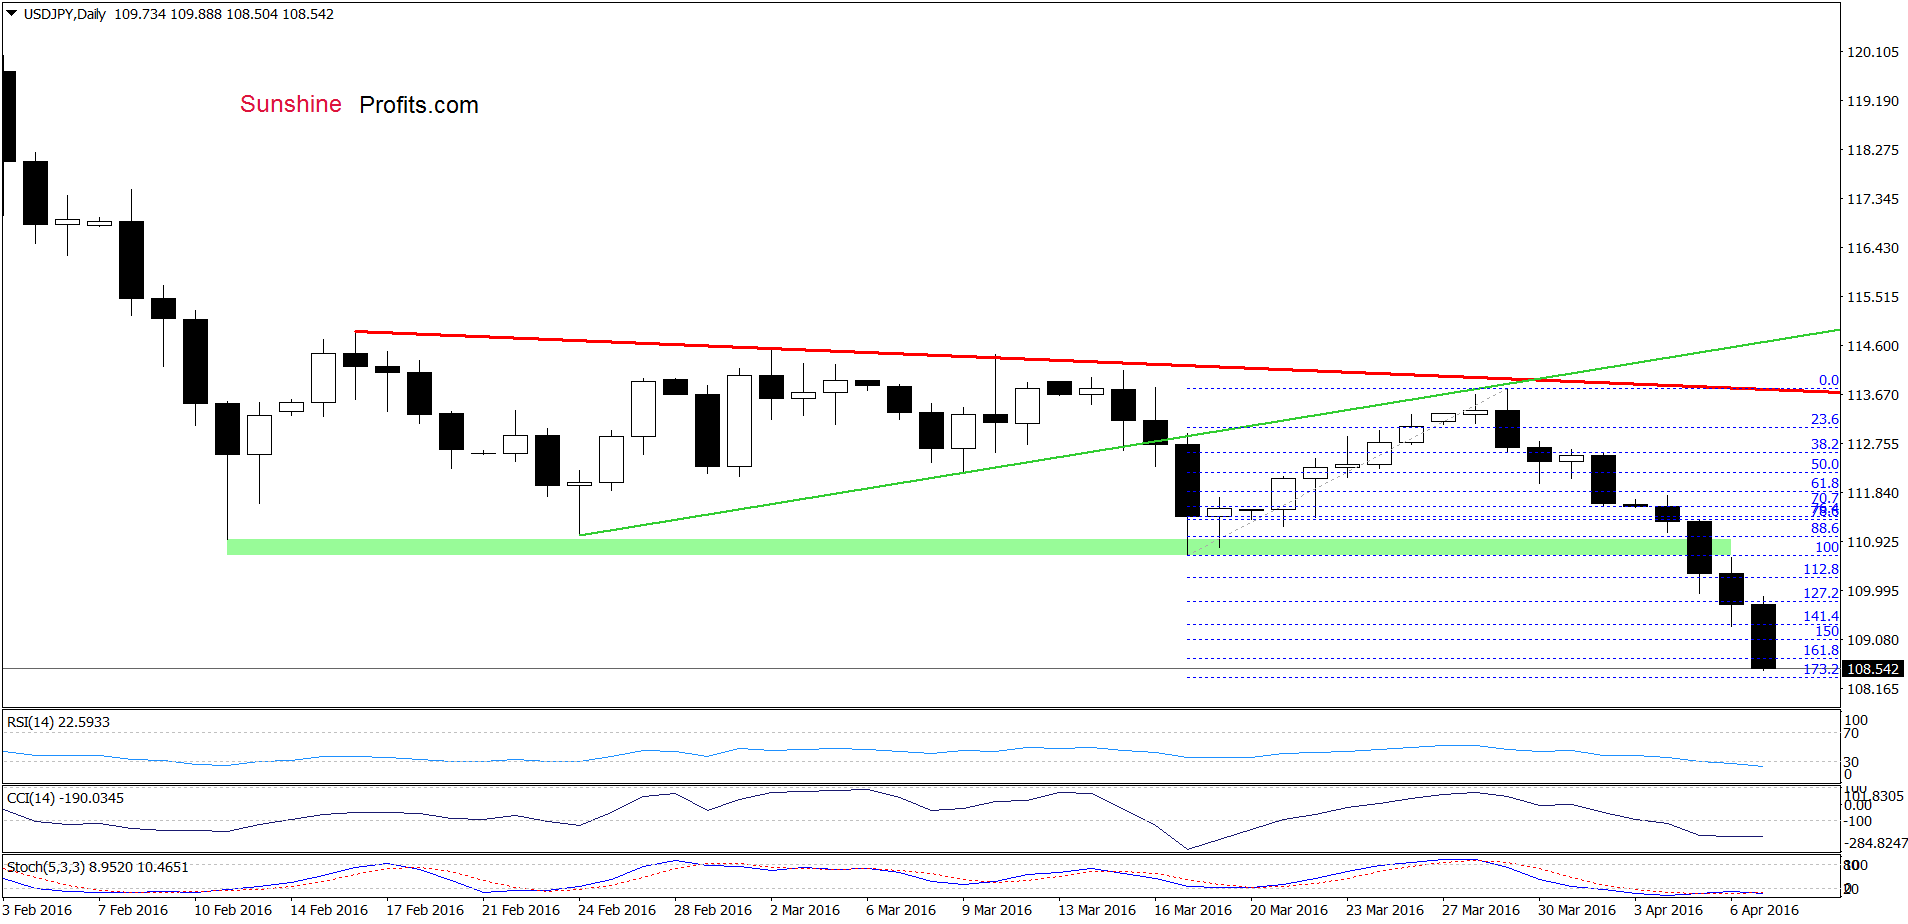
(…) With today’s downswing, the pair not reached our next downside target, but also declined below it. This is a negative signal which suggests further deterioration and a drop to around 109.81, where the 127.2% Fibonacci extension is. Are there any factors that could encourage currency bulls to act?
(…) USD/JPY dropped to the 61.8% Fibonacci retracement, which could trigger a rebound (…). However, if this support area is broken, the exchange rate could extend declines even to around 108.14, where the 70.7% Fibonacci retracement is.
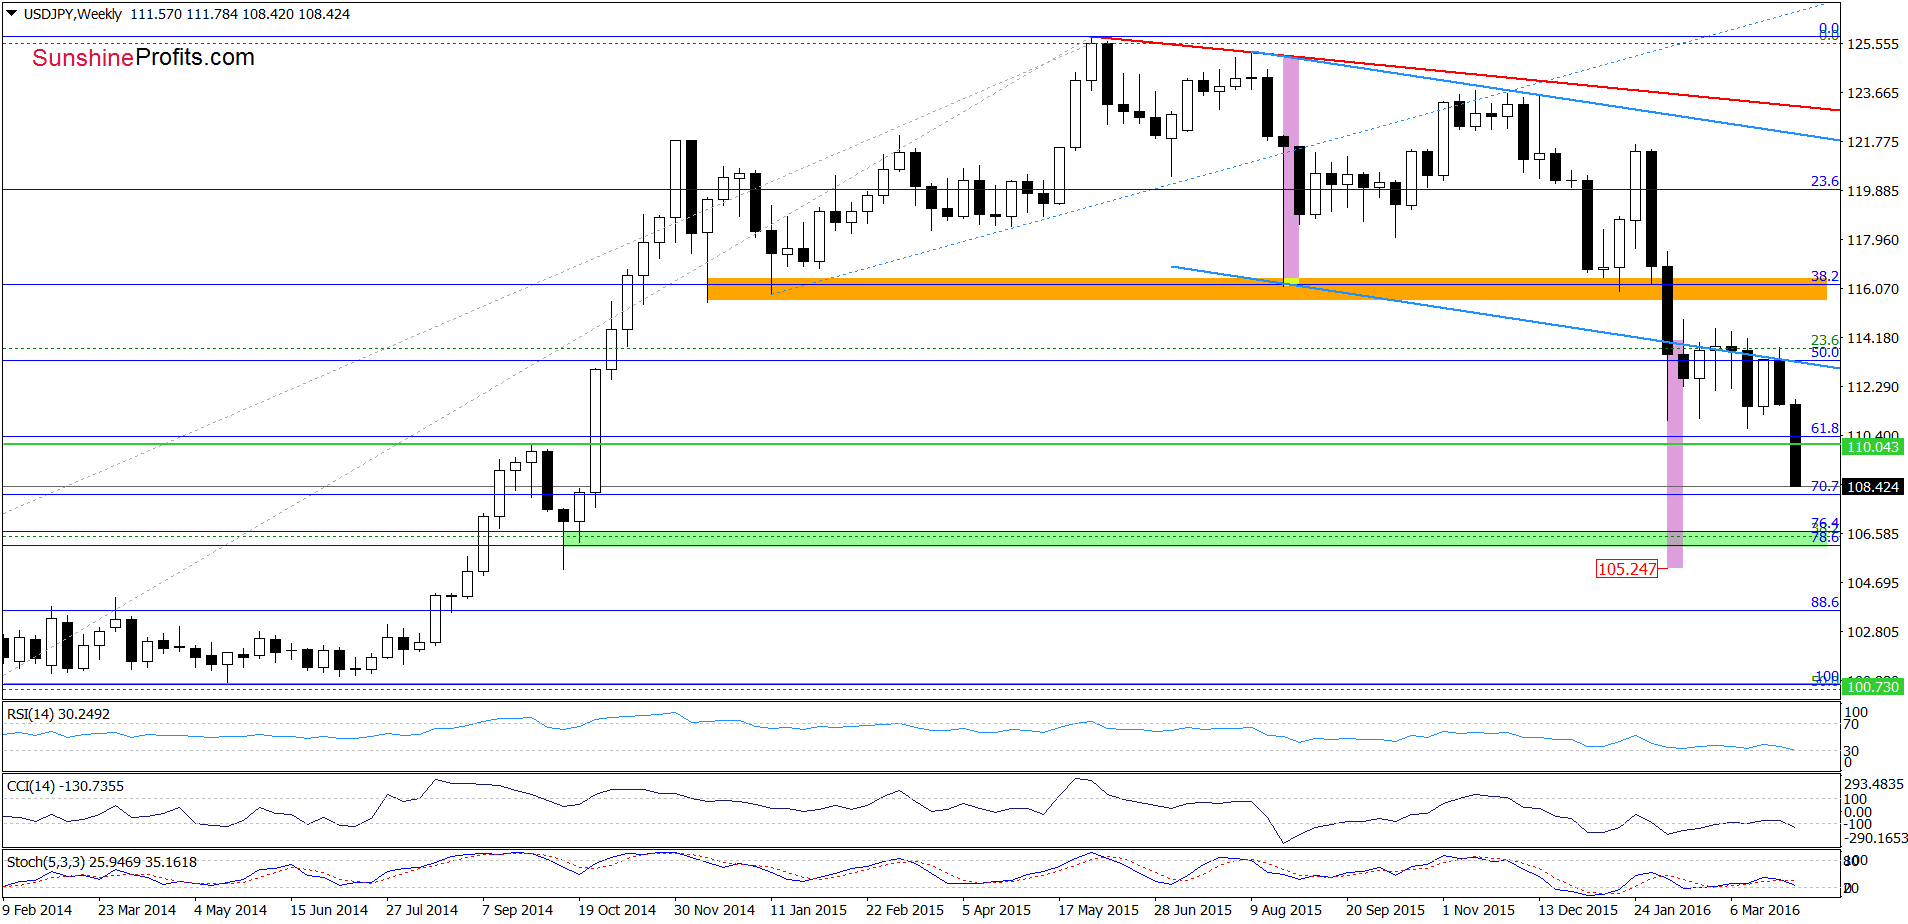
From today’s point of view, we see that the situation developed in line with the above scenario and USD/JPY declined sharply, approaching our next downside target (the 70.7% Fibonacci retracement). What’s next? The current position of the daily and weekly indicators suggests that the space for declines may be limited. However, when we take into account breakdown under the lower border of the blue declining trend channel (marked on the weekly chart), it seems that the exchange rate could drop to the green support zone (created by the 76.4% and 78.6% Fibonacci retracements around 106.05-106.62) or even to 105.25, where the size of the downward move will correspond to the height of the trend channel.
Very short-term outlook: bearish
Short-term outlook: mixed
MT outlook: mixed
LT outlook: mixed
Trading position (short-term; our opinion): No positions are justified from the risk/reward perspective at the moment. We will keep you informed should anything change, or should we see a confirmation/invalidation of the above.
Thank you.
Nadia Simmons
Forex & Oil Trading Strategist
Przemyslaw Radomski, CFA
Founder, Editor-in-chief
Gold & Silver Trading Alerts
Forex Trading Alerts
Oil Investment Updates
Oil Trading Alerts
