

There is a grain of truth in the theory that public debt is a driver of the price of gold. As can be seen in the chart below, in the 2000s’ bull market, gold went hand in hand with the U.S. debt.
Chart 1: Gold price (green line, left scale, PM fixing) and U.S. public debt to GDP (red line, right scale, in %) from 1999 to 2001
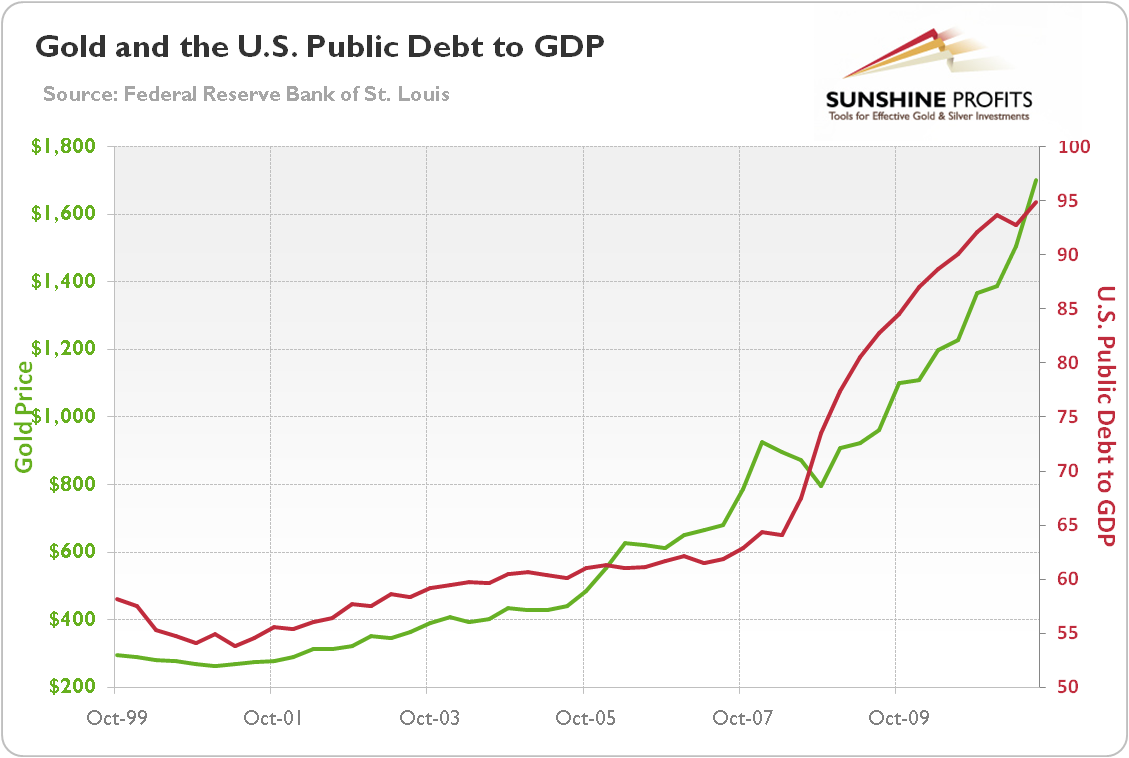
There is, however, one problem with this chart. We have cherry-picked the time horizon, to stress the importance of using a proper perspective when looking at charts, especially these provided by permabulls (those saying that gold can only go up) wanting to confirm their bias. How does the whole picture look?
Chart 2: Gold price (green line, left scale, PM fixing) and the U.S. public debt to GDP (red line, right scale, in %) from 1968 to 2015
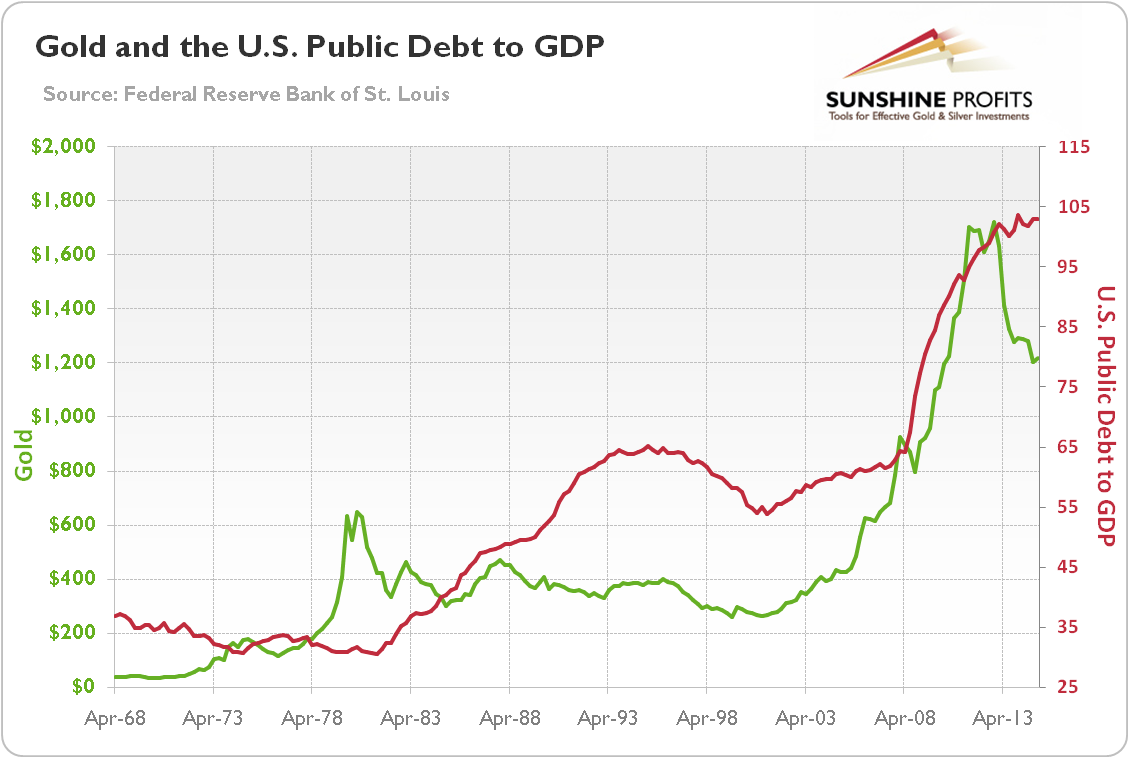
As the long-term chart above shows, there is no one-to-one positive correlation between the price of gold and the U.S. public debt. The price of gold was rising from 1971 to 1980, while the relation of U.S. public debt to GDP was declining. And the ratio increased significantly during the 20-year bear market in gold. Last but not least, the positive correlation broke in 2013, when the price of gold plunged, despite rising indebtedness. So, although there was a period where the price of gold and public debt moved in tandem, there were longer periods where they did not. Changing the charts’ time frame and cherry-picking historical data to fit the narrative are perhaps the most common manipulation practices among gold analysts, so it is important to always analyze the bigger picture.
But let’s return to the relationship between the price of gold and the U.S. public debt. Why did these two variables move together during the 2000s bull market? According to the standard story, when public debt rises beyond a certain point, the country monetizes the debt, i.e. prints money to pay off the obligations. The rise in the money supply leads to price inflation and depreciation of the U.S. dollar, which boost the price of gold as an inflation-hedge. However, as we have shown in the first section, the money supply growth does not drive the price of gold itself.
In the alternative version: when public debt rises beyond a certain point, the country increases taxes and cuts spending. This has a negative impact on the economic growth, which causes bond prices’ fall and yields soar, as well as the price of gold. Although the impact of higher taxes is negative for the economy, the spending cuts could actually foster genuine economic growth. When the public debt becomes unsustainable is also the subject of controversy. Japan smoothly manages public debt higher than 220 percent of its GDP (so far), while Greece fell into crisis with public debt worth more than 100 percent of its GDP.
In any case, the public debt is not the driver of gold prices by itself. Its impact on the price of gold is indirect, through the lower faith in U.S. growth prospects and the greenback’s strength. The 2000s was the period of diminished trust in the dollar due to expansionary monetary policy after the burst of a dot-com bubble, and higher government expenditures, partly due to wars in Afghanistan and Iraq. The establishment of the euro additionally undermined the position of the U.S. dollar. The dynamic development of the emerging markets, such as China and India, also threatened the dominance of the greenback. Although the outbreak of the crisis was initially positive for the greenback’s value, the trust in the U.S. economy was further shaken due to unprecedented monetary and fiscal stimuli (such as TARP). This is why during the 2000s the gold price moved in tandem with the U.S. public debt; however it was not the driving factor – it was rather one of many components that constituted a broad negative picture of the U.S. economy and its currency.
Summing up, there is no one-to-one positive correlation between the price of gold and the U.S. public debt. The narrative about the strong relationship between these two variables comes from the experience of the 2000s – times of diminished faith in the U.S. dollar. Rising indebtedness was one of the factors behind this limited trust, but not the only one. Investors feared that public debt would be unsustainable – especially after the Lehman Brothers’ bankruptcy and federal bailout programs – and would have to be monetized by printing money, which would lead to massive inflation. In a sense, gold served as an excessive public debt hedge, but it was only a variation of being an inflation hedge, or actually a safe-haven – the concerns of the U.S. indebtedness were closely tied to fears about the current state of the U.S. economy and the greenback. With the improving situation in 2013, the price of gold plunged, despite the fact that the public debt was still growing.
If you enjoyed the above analysis and would you like to know more about the most important factors influencing the price of gold, we invite you to read the September Market Overview report. If you’re interested in the detailed price analysis and price projections with targets, we invite you to sign up for our Gold & Silver Trading Alerts. If you’re not ready to subscribe at this time, we invite you to sign up for our gold newsletter and stay up-to-date with our latest free articles. It's free and you can unsubscribe anytime.
Thank you.
Arkadiusz Sieron
Sunshine Profits‘ Gold News Monitor and Market Overview Editor
Gold News Monitor
Gold Trading Alerts
Gold Market Overview
