

More and more analysts are pointing out the tight correlation between the Japanese yen and the price of gold. Let’s thus investigate the link between these two assets. The chart below shows the long-term relationship between the yellow metal and the USD/JPY exchange rate. At first glance, there is no strong, clear pattern. Surely, gold prices rose in the 1970s and the 2000s, when the U.S. dollar weakened against the yen. But the Japanese currency also strengthened from the mid-1980 to mid-1990, when gold remained in a bear market.
Chart 1: The USD/JPY exchange rate (red line, left axis) and the price of gold (yellow line, right axis, London P.M. Fix) from January 1971 to September 2016.

However, the relationship between these two assets became much more interesting in recent years. Let’s look at the next chart, which plots the price of gold and the USD/JPY exchange rate since 2012.
Chart 2: The USD/JPY exchange rate (red line, left axis) and the price of gold (yellow line, right axis, London P.M. Fix) from January 2012 to September 2016.
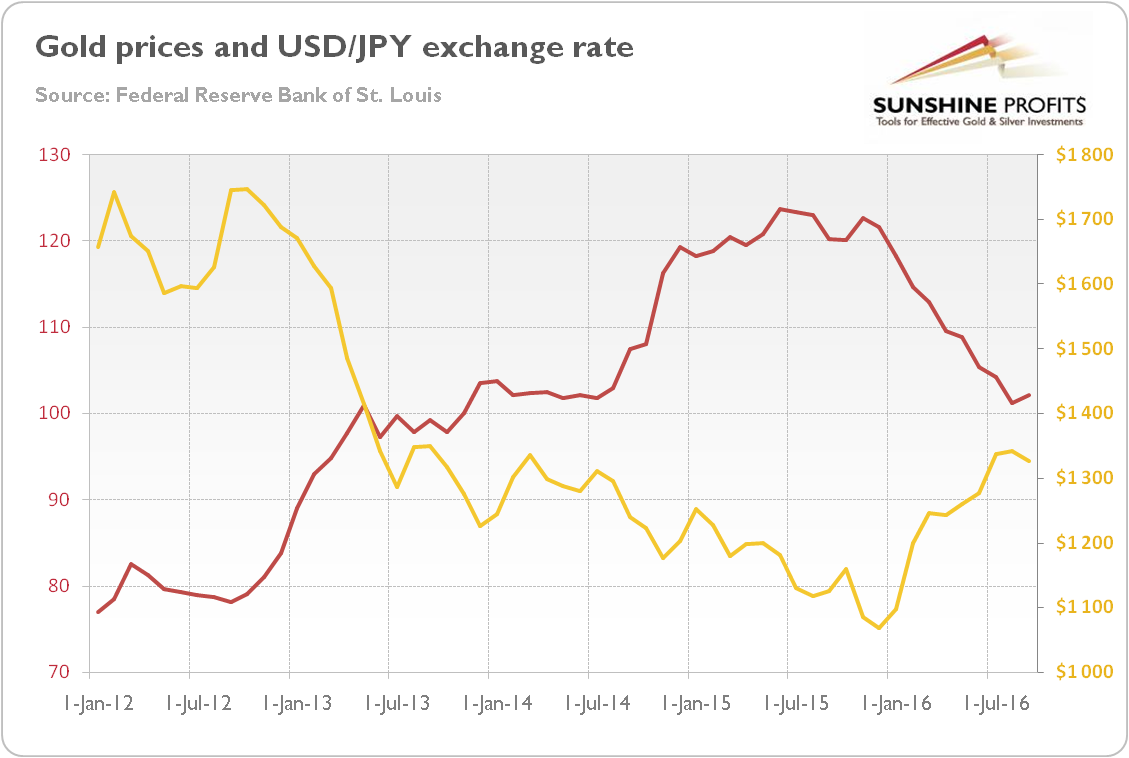
As you can see, there is almost perfect negative correlation between the USD/JPY exchange rate and gold. Indeed, in the whole range of data since 1971, the correlation coefficient is -0.57, which is definitely not bad, but far from a totally negative link. However, for the period of 2012-2016 the correlation coefficient stands at -0.94, which signals a very strong negative relationship. Why did the correlation become so tight? Well, in a sense it is very simple: when the yen weakens, the U.S. dollar strengthens. Investors should remember that the USD/JPY is one of the world’s major currency pairs, just like the EUR/USD. And because gold trades like a bet against the greenback, a strong U.S. dollar implies weak gold prices.
However, this answer does not solve the whole riddle, as gold now has a stronger relationship with the yen than with any other currency, e.g., the negative correlation between gold and the broad U.S. dollar index in 2012-2016 amounts to only -0.7. It probably results from the yen carry trade (borrowing yen at a low-interest rate and investing it in higher-yielding assets abroad), which makes the Japanese currency behave like a safe haven, despite the country’s economic problems (like sluggish growth and high public debt). This is because carry trade usually intensifies when the risk appetite rises and weaken during periods of falling confidence (however, another reason may be Japan’s current account surpluses).
The next chart presents the strong negative correlation between the Japanese stock market (represented by the Nikkei 225 Index) and gold.
Chart 3: The Nikkei225 Index (red line, left axis) and the price of gold (yellow line, right axis, London P.M. Fix) from January 2012 to September 2016.
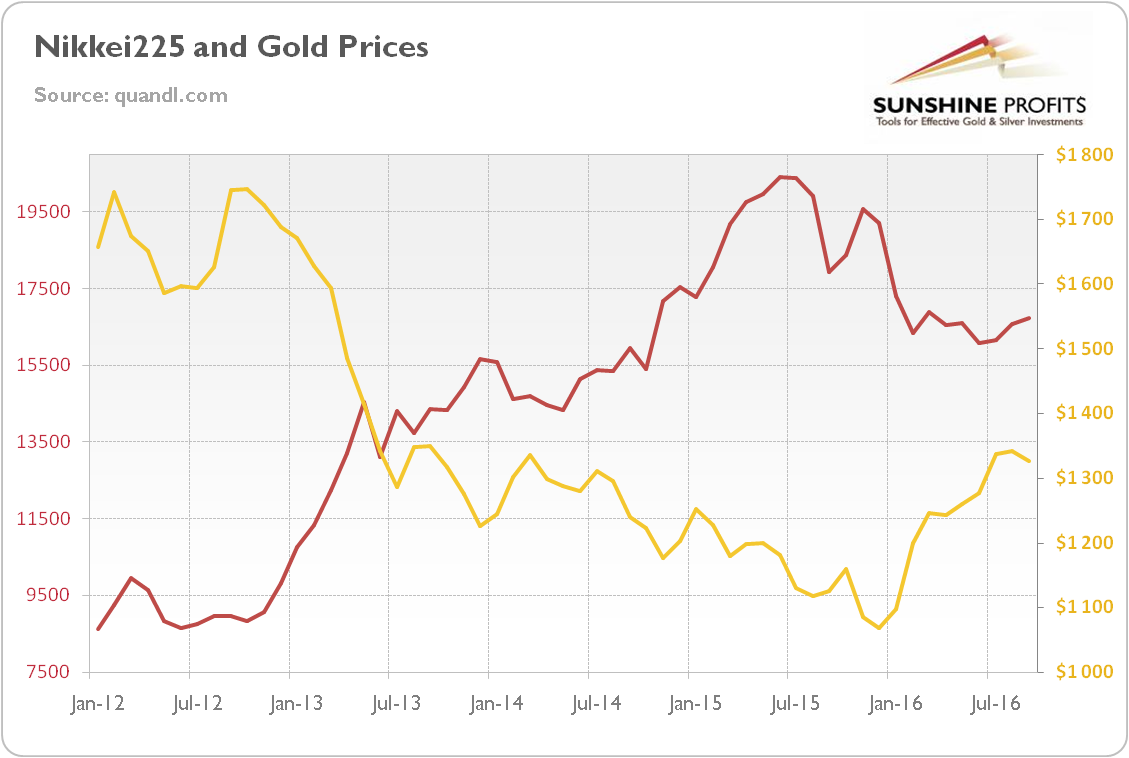
The high negative correlation is striking (-0.94, the same as between gold and the USD/JPY exchange rate). It clearly shows that the relationship between the Japanese currency and the shiny metal is more complex than a simple story about the U.S. dollar and gold.
Why have the Japanese stock market and the yen’s strength been so tightly correlated with gold since 2012? The answer is: the Bank of Japan. In September 2012, Japan’s central bank announced the expansion of its asset purchase program by about ¥10 trillion to about ¥80 trillion, which was preceded by Draghi’s famous July speech in which he promised to do “whatever it takes” to preserve the euro. Initially the gold prices reacted positively. This reaction turned out to be short-lived because of the BoJ’s more aggressive monetary policy in support of Abenomics. As a reminder, in December 2012, Shinzo Abe’s government took office, and four months later the BoJ announced its radical quantitative and qualitative monetary easing. The new Governor Haruhiko Kuroda committed the bank to purchase assets at an annual rate of ¥60 to ¥70 trillion to double the monetary base by the end of 2014. It was an unprecedented monetary policy, unmatched in scope by the Fed’s quantitative easing. Hence, the Abenomics and the BoJ’s stimuli led to the Nikkei surge and the depreciation of the yen, which strengthened the U.S. dollar and sent gold prices south. The carry trade was also crucial here. Investors borrowed the newly created yens at very low interest rates, converted them to the U.S. dollars and invested in American bonds, which was negative for the gold market. Therefore, the BoJ’s massive money creation and zero interest rates policy led to declines in gold prices. Hence, the gold investors should closely watch Japan’s central bank – its monetary policy significantly affects the precious metals market. Indeed, the highly negative correlation between the USD/JPY and the yellow metal signals that the price of gold is now largely determined by fluctuations in the yen, which is often overlooked by precious metals analysts and investors.
If you enjoyed the above analysis and would you like to know more about the relationship between the Japanese yen and gold, we invite you to read the November Market Overview report. If you’re interested in the detailed price analysis and price projections with targets, we invite you to sign up for our Gold & Silver Trading Alerts. If you’re not ready to subscribe at this time, we invite you to sign up for our gold newsletter and stay up-to-date with our latest free articles. It's free and you can unsubscribe anytime.
Thank you.
Arkadiusz Sieron
Sunshine Profits‘ Gold News Monitor and Market Overview Editor
Gold News Monitor
Gold Trading Alerts
Gold Market Overview
