

U.S. construction spending tumbled in April. What does it imply for the gold market?
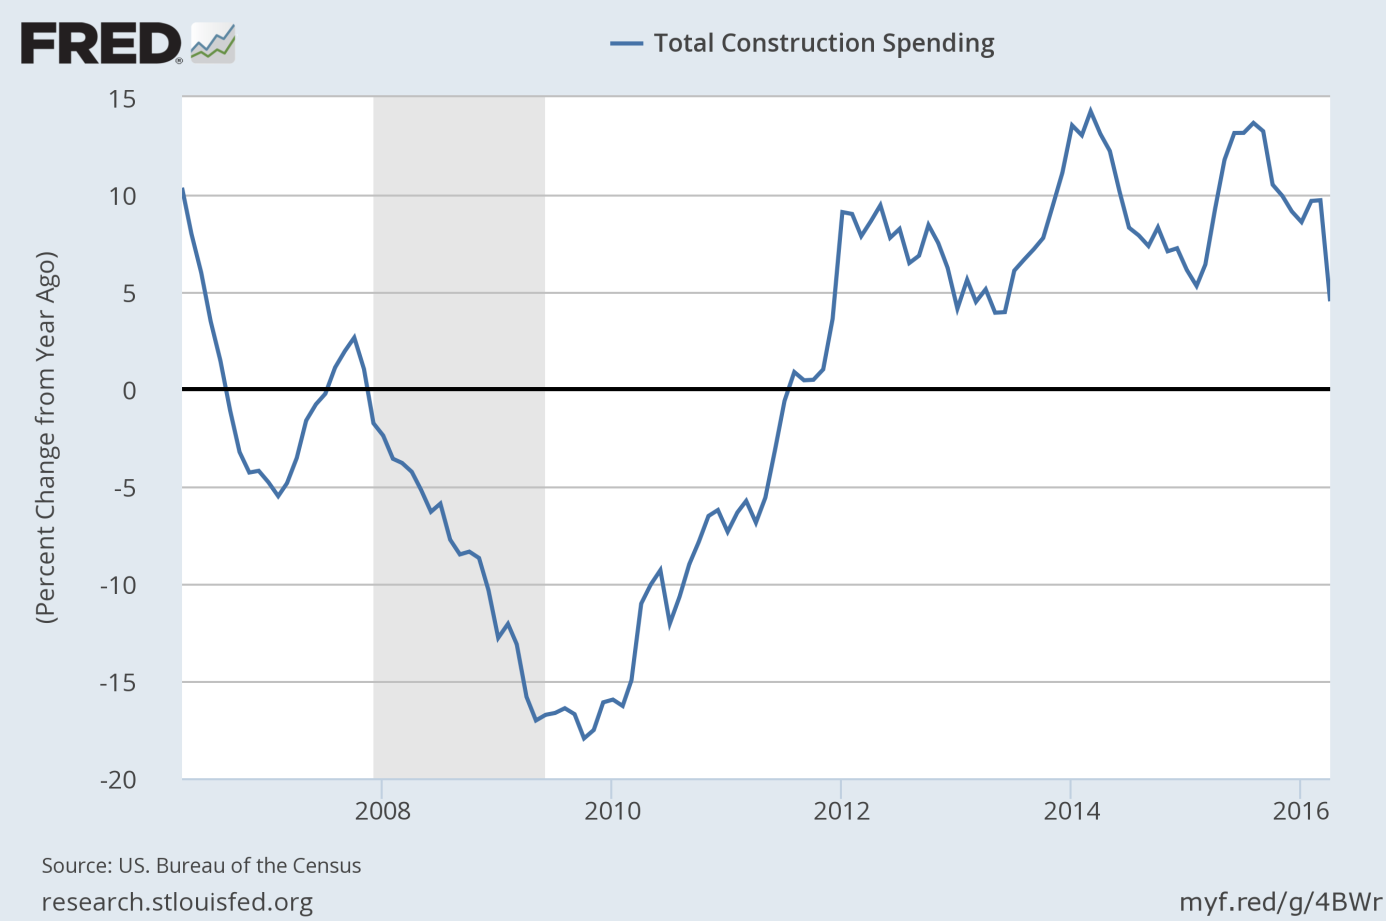
Construction spending plunged 1.8 percent in April, according to the U.S. Department of Commerce. The decline followed a 1.5 percent gain in March (after revision) and was well below forecasts of a 0.6 percent increase. The weakness was widespread: both private residential construction and private non-residential construction declined 1.5 percent. On the other hand, the change in total construction spending for February and March was revised up by 1.6 percentage points. On an annual basis, construction spending rose 4.5 percent, which is down from 9.7 percent in March. As one can see in the chart below, there has been a slowdown in construction spending since August 2015. Annually, private manufacturing and communication construction were the weakest parts of the report, declining by 10 and 16.3 percent, respectively.
Chart 1: Total construction spending (as a percent change from year ago) from 2006 to 2016.
The weak construction spending may cast some doubts about U.S. economic growth in the second quarter. The GDPNow model forecast declined from 2.9 percent to 2.5 percent after the release of the data. The CME Fedwatch rate hike odds for June decreased from 22.5 percent to 20.6 percent. Therefore, the report is positive for the gold market (however, it would not change the current downward correction alone).
Other recently released data has been mixed. Motor vehicle sales were essentially flat on a monthly basis. The ISM manufacturing index rose to 51.3 percent last month from 50.8 percent in April, however, conditions in the sectors are still sluggish. On the other hand, the recent Beige Book painted a subdued picture of the U.S. economy. Although consumer spending, wages and employment all grew modestly, the report does not offer strong support for the Fed hike in June.
To sum up, construction spending was weak in April, while other reports were mixed. The data does not offer a strong case for raising interest rates, however, it may be enough for the Fed to move. Gold should remain under downward pressure until the FOMC meeting, unless tomorrow’s nonfarm payrolls are a total disaster.
If you enjoyed the above analysis, we invite you to check out our other services. We focus on fundamental analysis in our monthly Market Overview reports and we provide daily Gold & Silver Trading Alerts with clear buy and sell signals. If you’re not ready to subscribe yet and are not on our mailing list yet, we urge you to join our gold newsletter today. It’s free and if you don’t like it, you can easily unsubscribe.
Disclaimer: Please note that the aim of the above analysis is to discuss the likely long-term impact of the featured phenomenon on the price of gold and this analysis does not indicate (nor does it aim to do so) whether gold is likely to move higher or lower in the short- or medium term. In order to determine the latter, many additional factors need to be considered (i.e. sentiment, chart patterns, cycles, indicators, ratios, self-similar patterns and more) and we are taking them into account (and discussing the short- and medium-term outlook) in our trading alerts.
Thank you.
Arkadiusz Sieron
Sunshine Profits‘ Gold News Monitor and Market Overview Editor
Gold News Monitor
Gold Trading Alerts
Gold Market Overview
