

Earlier today, the yen moved sharply higher against the greenback supported by increased safe haven demand. As a result, USD/JPY declined after a climb to the resistance zone and invalidated earlier breakout. Will we see the exchange rate below 124 in the coming days?
In our opinion the following forex trading positions are justified - summary:
EUR/USD
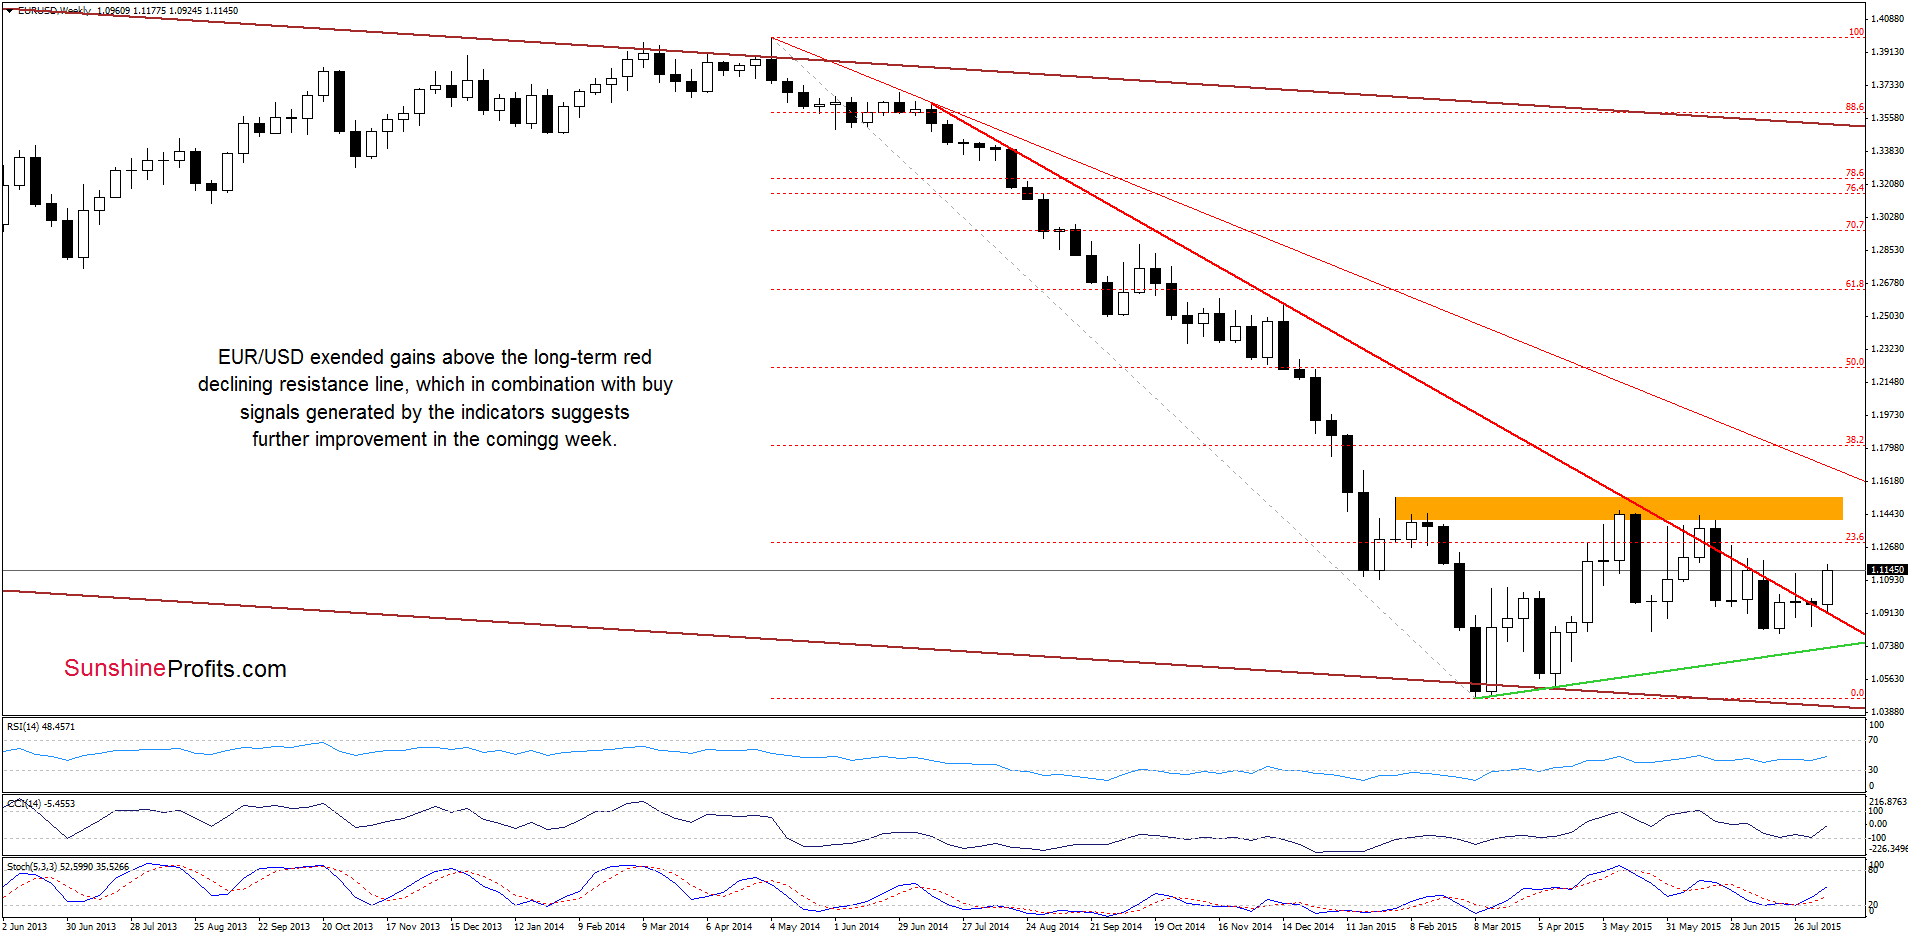
Looking at the weekly chart, we see that EUR/USD extended gains above the previously-broken long-term red declining resistance line, which is a positive signal that suggests further improvement – especially when we factor in buy signals generated by the indicators.
What can we infer from the very short-term picture? Let’s take a closer look at the daily chart and find out.
On Monday, we wrote:
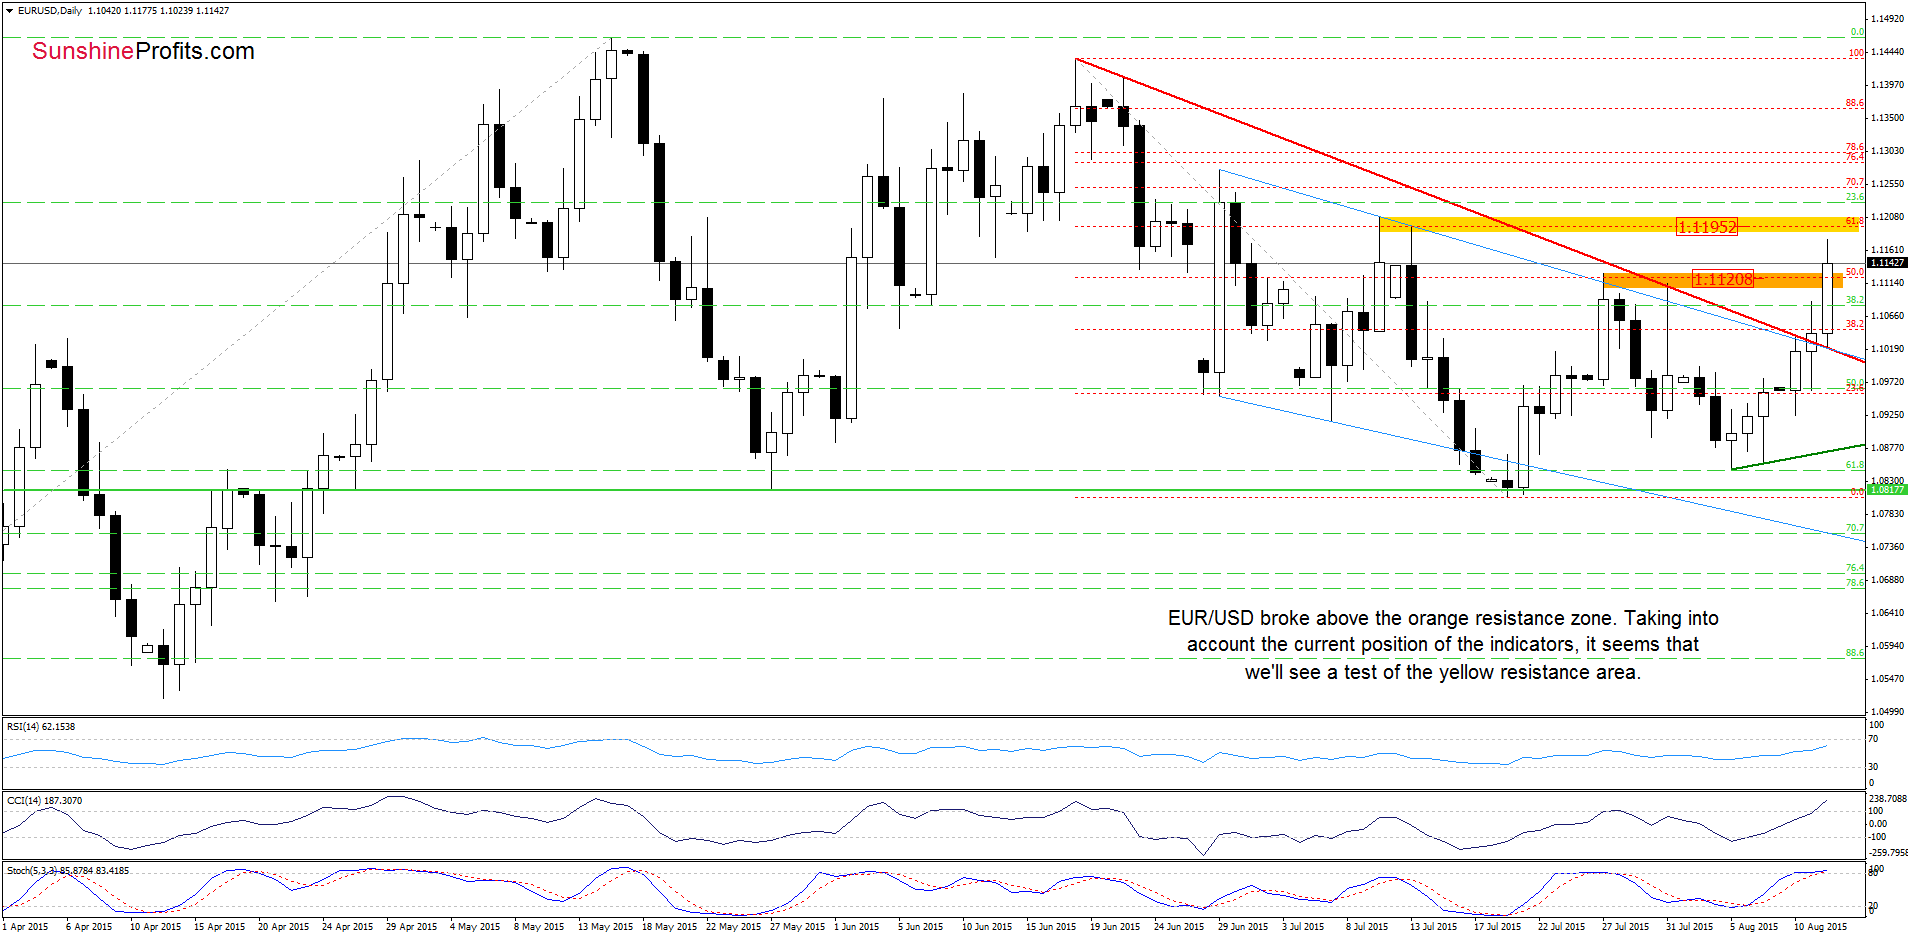
(…) the CCI and Stochastic Oscillator generated buy signals, which suggests that currency bulls will likely try to push the exchange rate above this resistance in the coming days. If this is the case, and they succeed, the next upside target would be around 1.1113-1.1128, where the Jul 27, Jul 31 highs and the 50% Fibonacci retracement (based on the Jun-Jul decline) are.
As you see on the daily chart the situation developed in line with the above scenario and EUR/USD not only reached, but also broke above our upside target - the orange resistance zone earlier today. Taking this factor into account, and combining it with buy signals generated by the indicators, it seems that we’ll see a test of the yellow resistance area in the coming day(s). If it is broken, the next target for currency bulls would be around 1.1277-1.1300, where the Jun 29 high, the 76.4% and 78.6% Fibonacci retracement levels are.
Very short-term outlook: bullish
Short-term outlook: mixed
MT outlook: mixed
LT outlook: mixed
Trading position (short-term; our opinion): No positions are justified from the risk/reward perspective at the moment. We will keep you informed should anything change, or should we see a confirmation/invalidation of the above.
USD/JPY
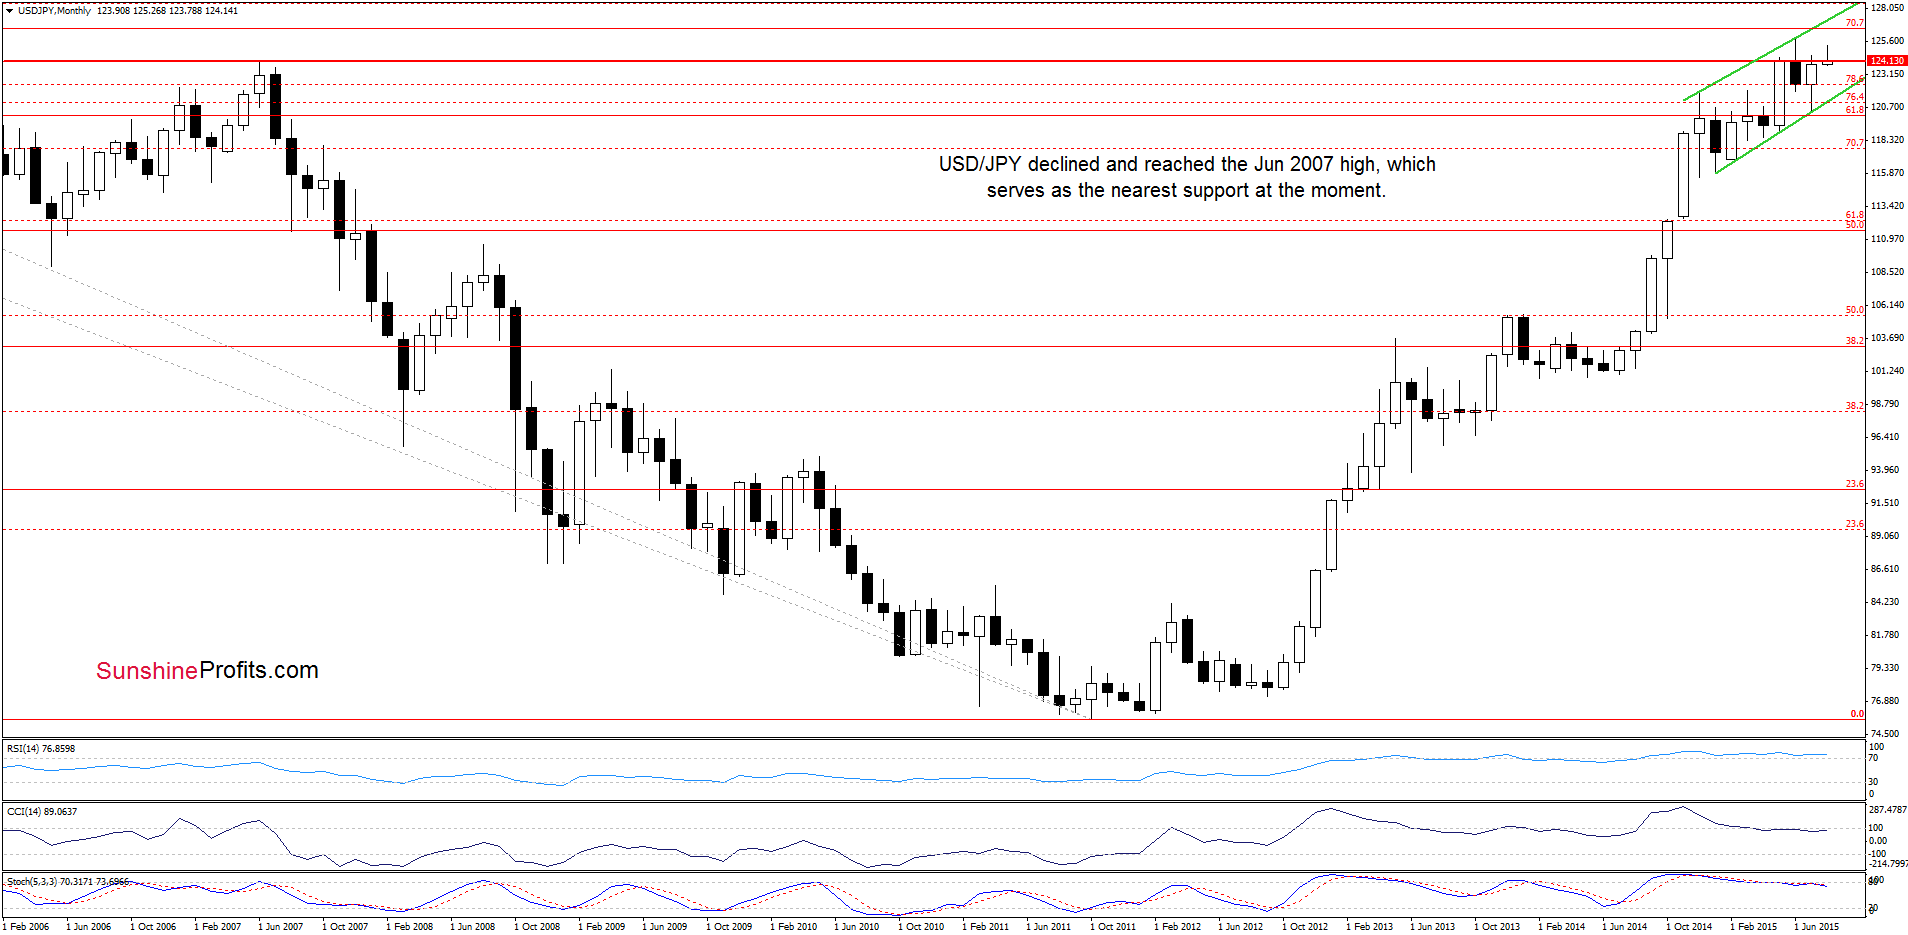
Although USD/JPY moved lower, the pair remains slightly above the June 2007, which serves as the nearest support.
Having said that, let’s take a closer look at the daily chart.
Quoting our previous commentary:
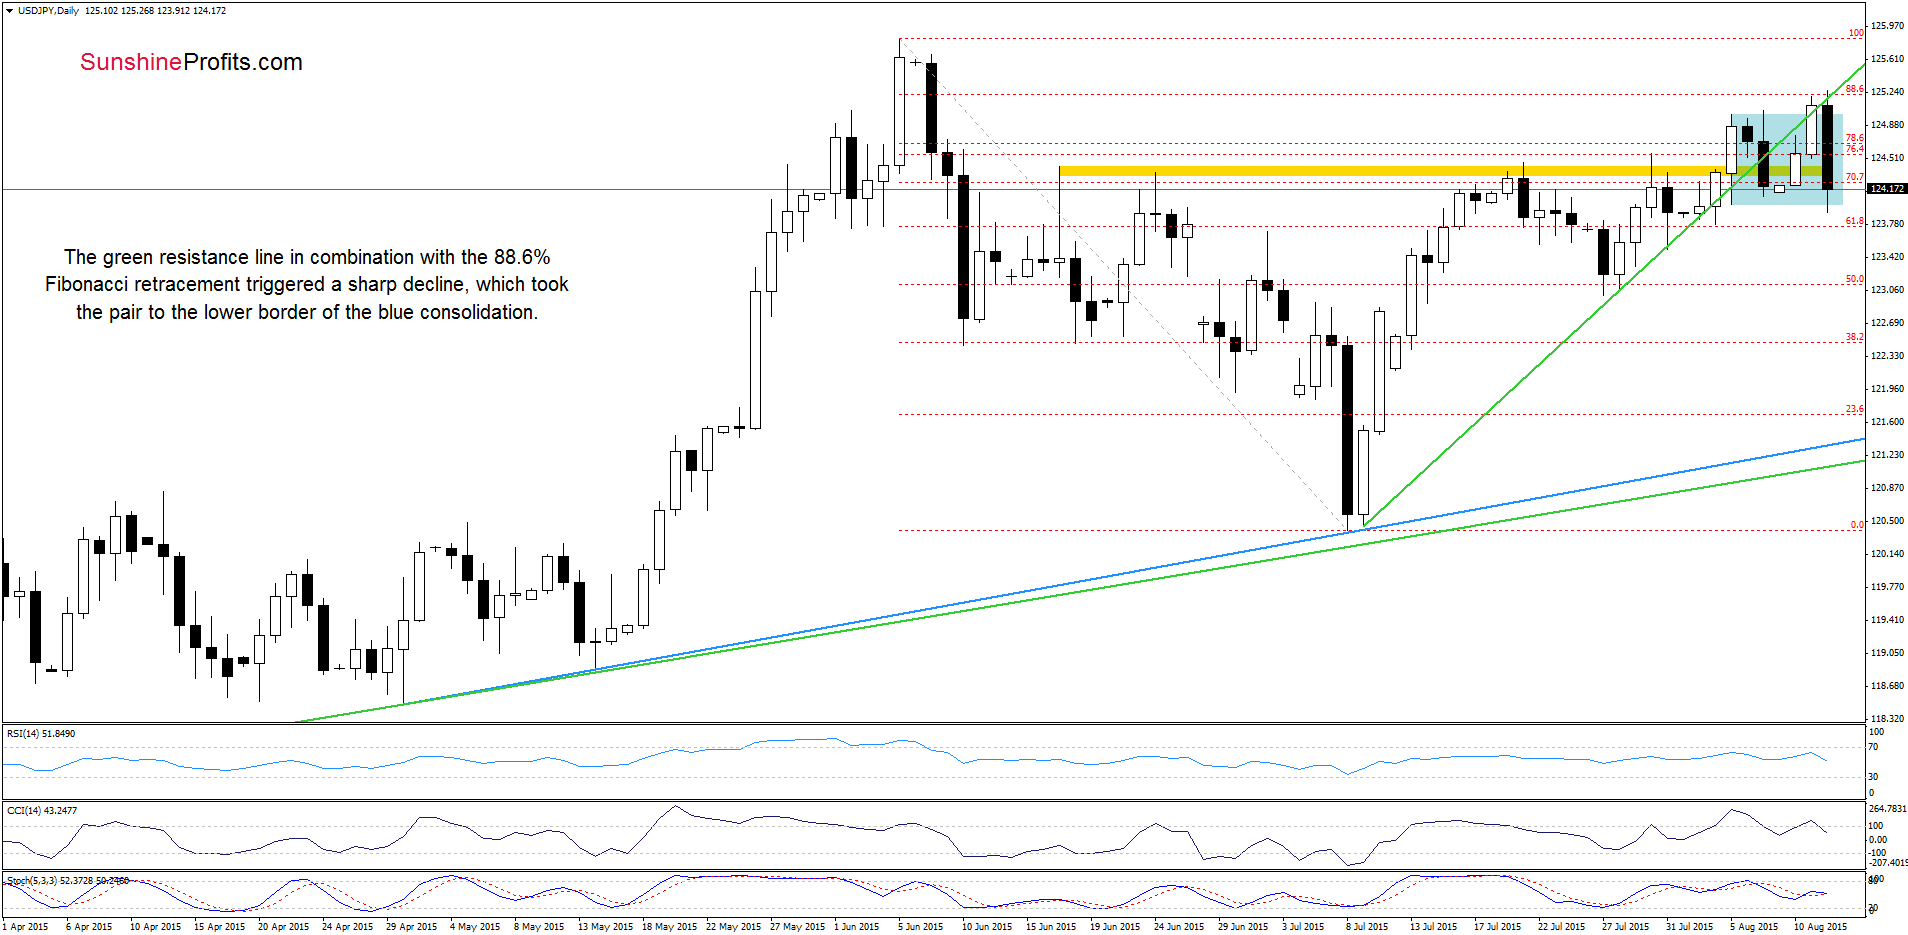
(…) USD/JPY came back to the previously-broken green rising resistance line, which could be a verification of earlier breakdown. At this point, it is also worth noting that today’s increase took the exchange rate to the upper line of the blue consolidation, which suggests that if (…) they fail, we’ll see a test of the lower border of the formation.
On the daily chart, we see that the previously-broken green rising resistance line in combination with the 88.6% Fibonacci retracement triggered a sharp decline, which took the exchange rate to our downside target. Taking this fact into account, and combining it with sell signals generated by the indicators, it seems that USD/JPY will extend losses in the coming day(s). Nevertheless, another sharp downswing will be more likely if we see a daily close below the lower border of the consolidation and the June 2007 high (124-124.13).
Very short-term outlook: mixed with bearish bias
Short-term outlook: mixed with bearish bias
MT outlook: mixed
LT outlook: mixed
Trading position (short-term; our opinion): No positions are justified from the risk/reward perspective at the moment. We will keep you informed should anything change, or should we see a confirmation/invalidation of the above.
USD/CHF
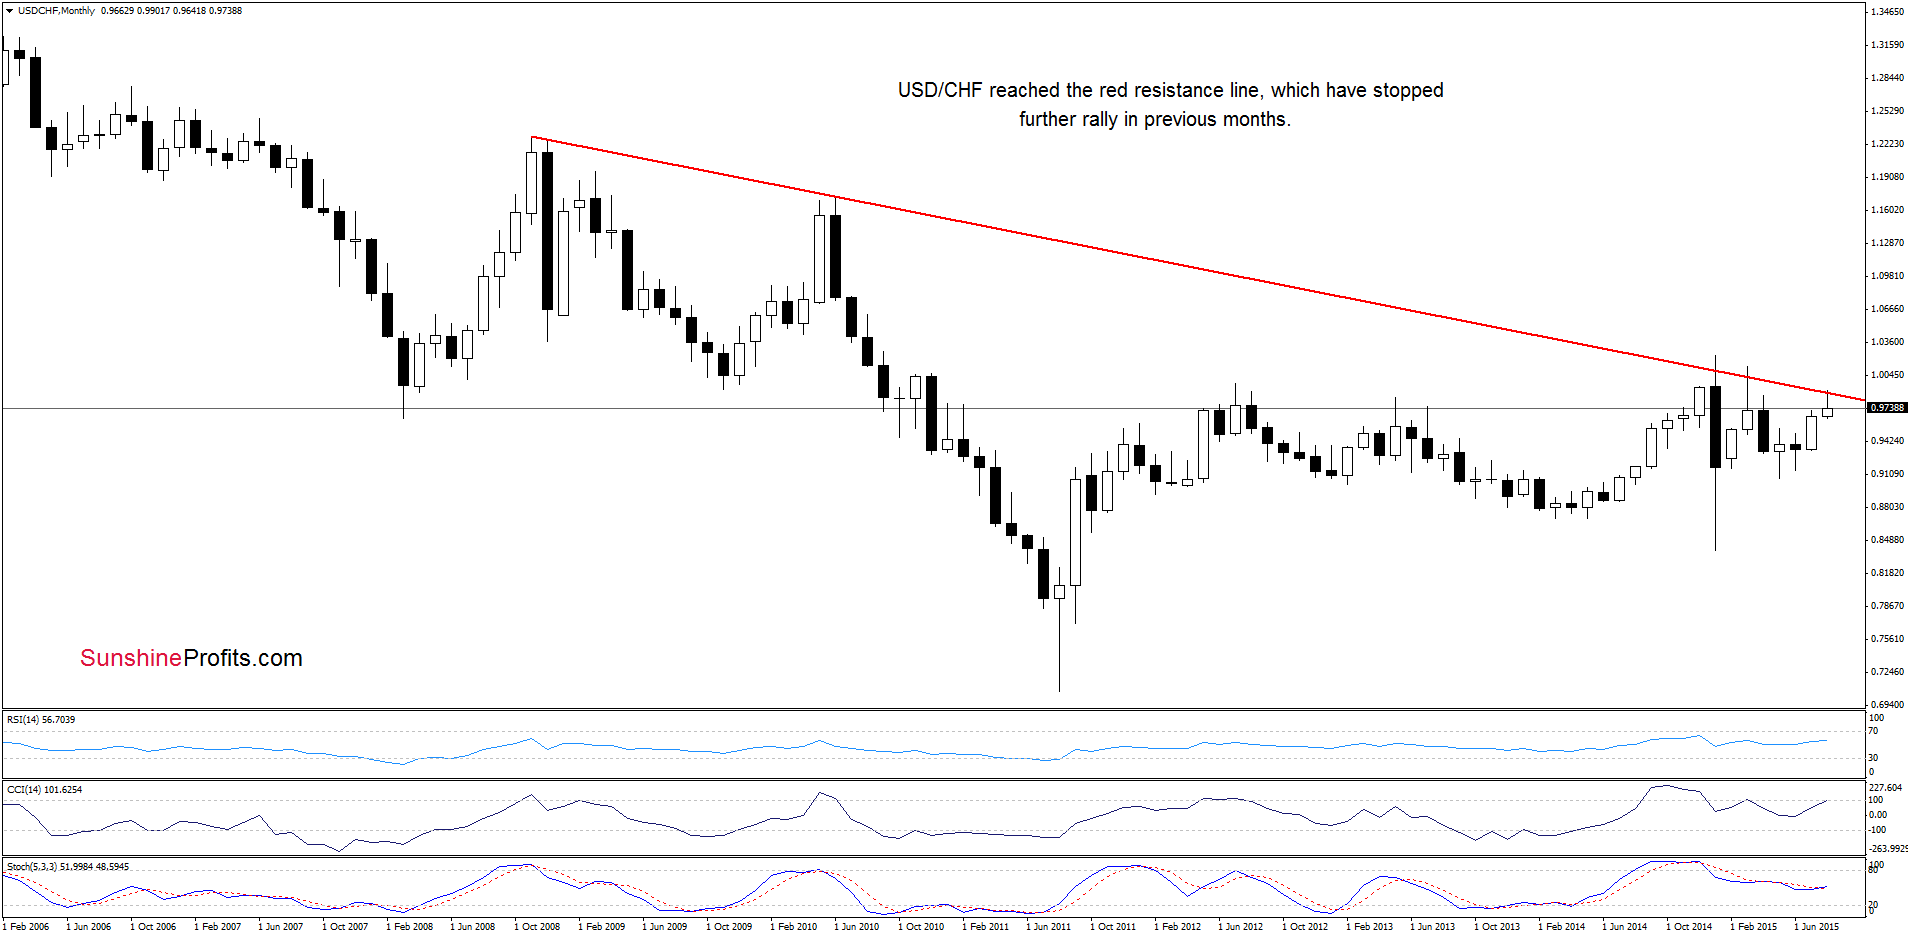
Yesterday, we wrote:
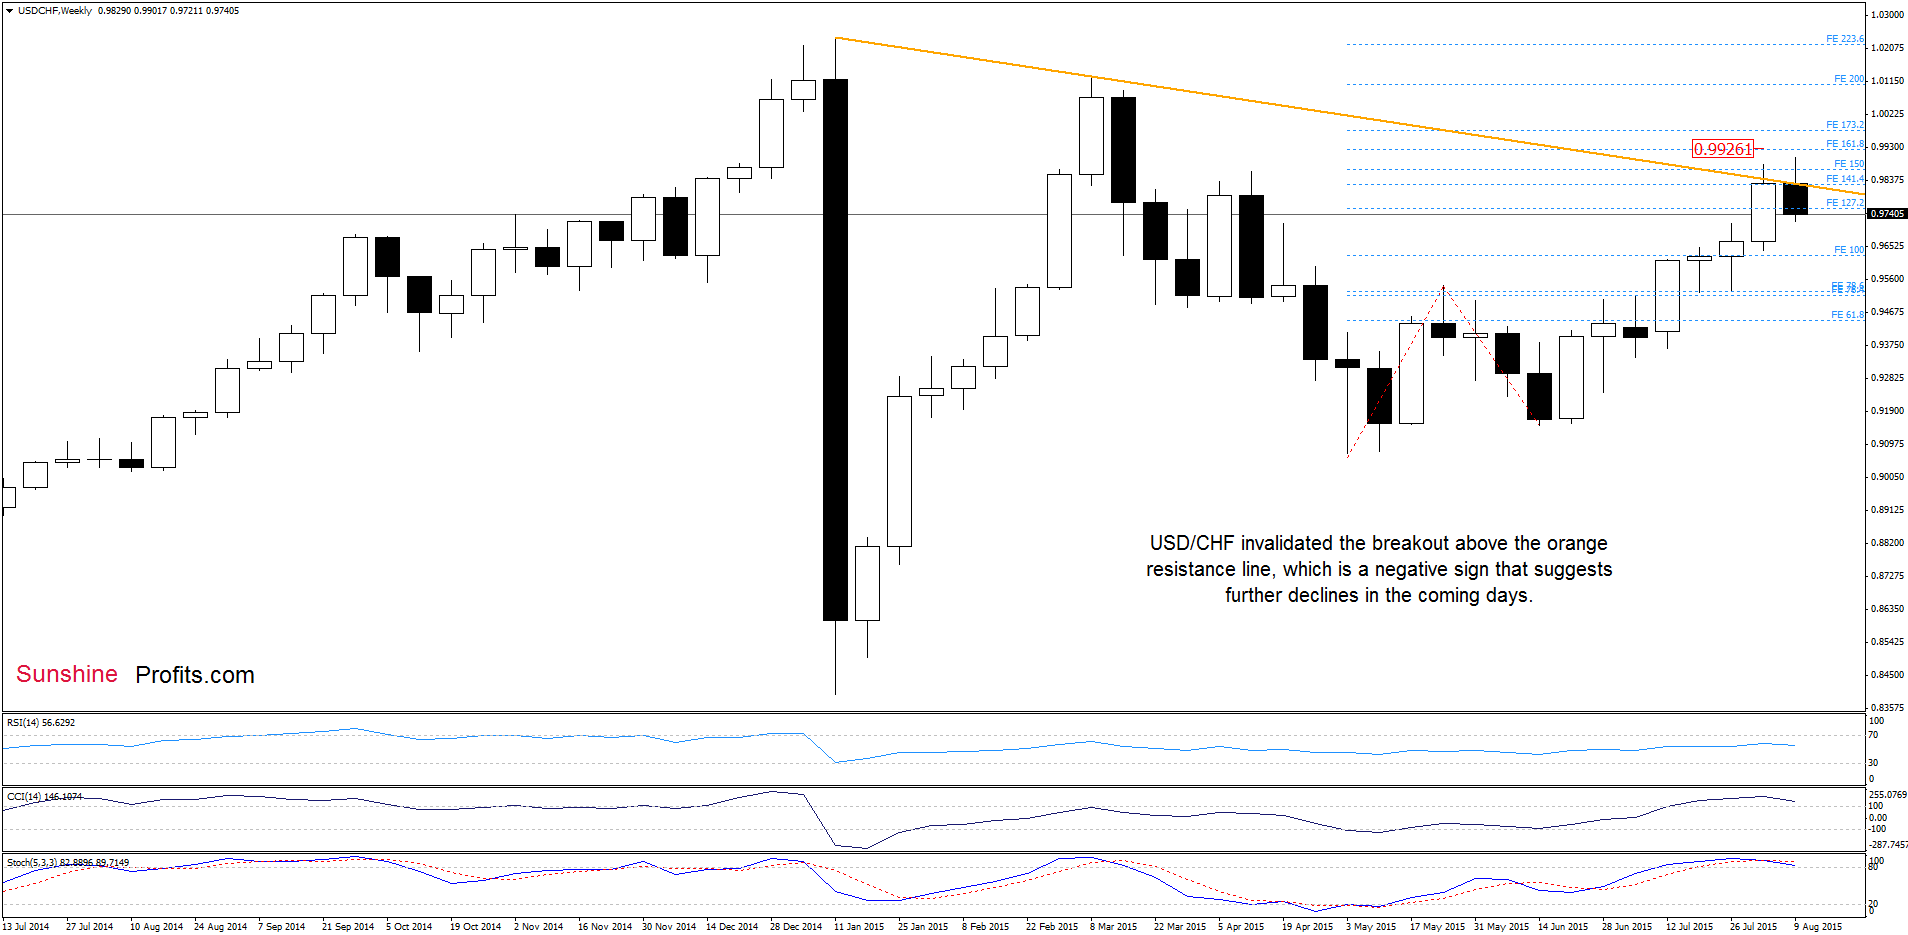
(…) the long-term red declining line(…) triggered a pullback earlier today. With this move, USD/CHF slipped under the previously-broken orange support line, which is a negative sign (however, it will turn to bearish if we see a weekly close below this line).
Looking at the above charts, we see that USD/CHF extended declines below the red and orange resistance lines, which suggests further deterioration in the coming week.
How low could the pair go?
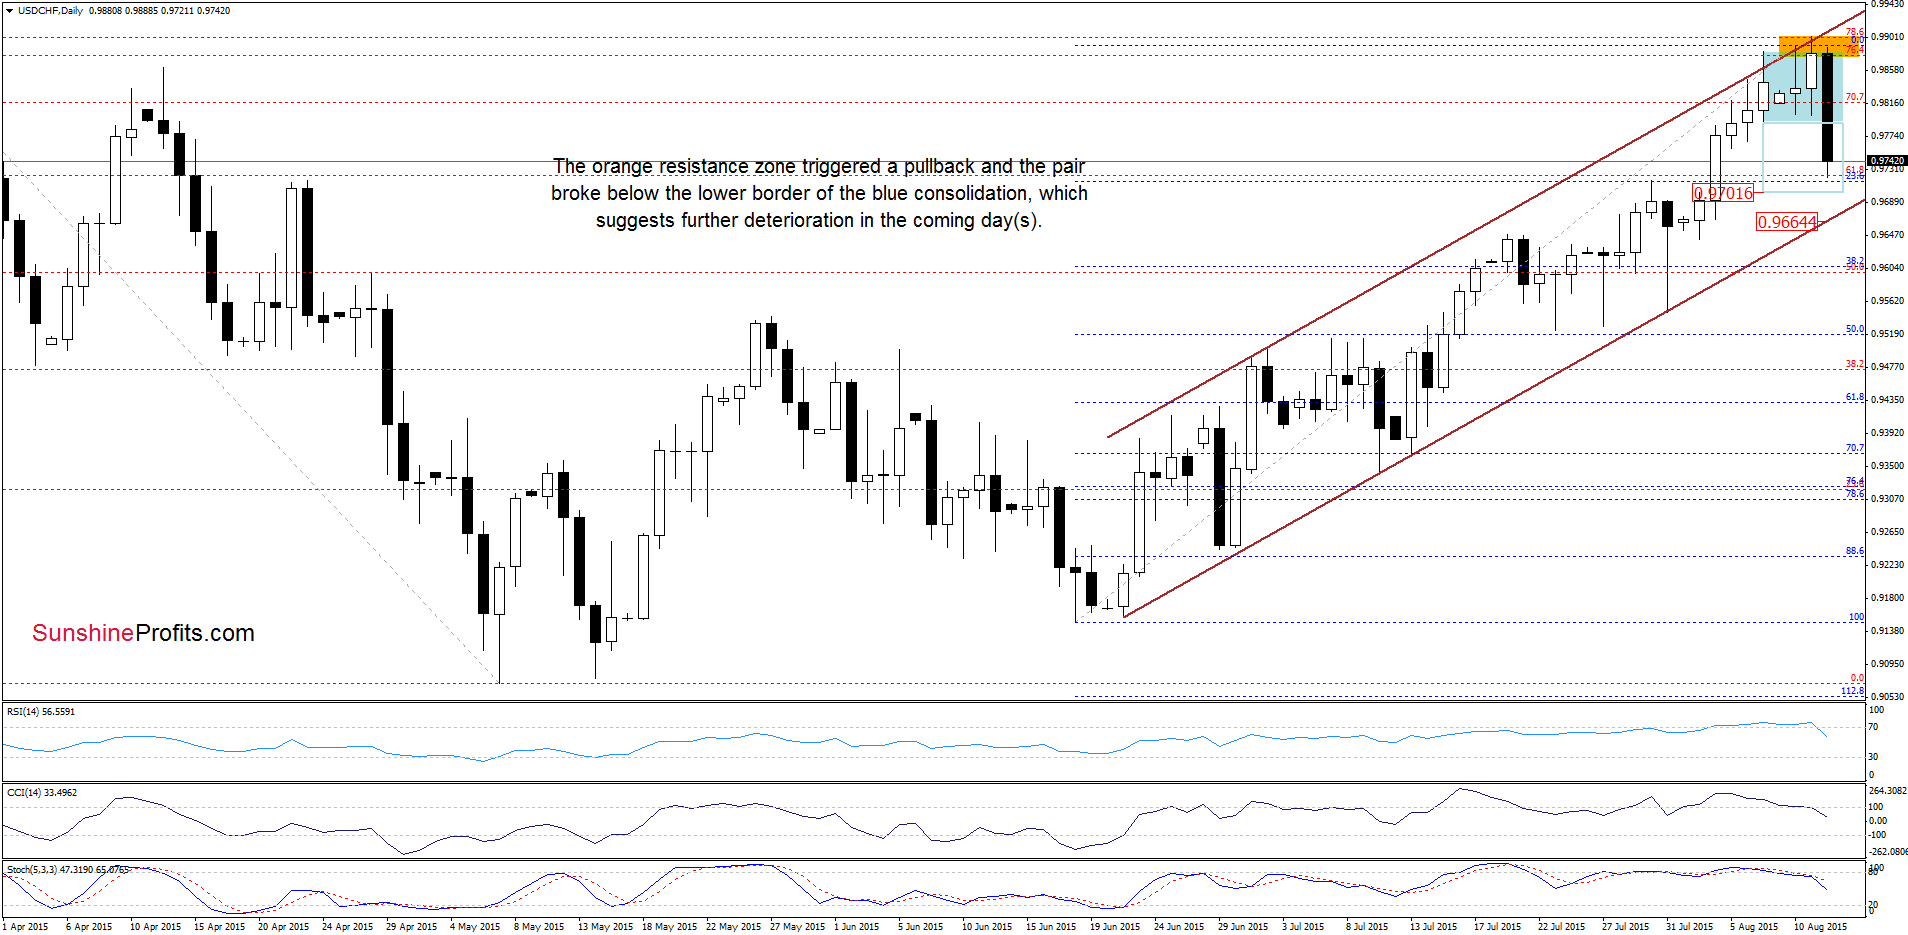
In our last Forex Trading Alert, we wrote:
(…) sell signals generated by the indicators suggest that another attempt to move lower is just around the corner. If this is the case, and the exchange rate drops below 0.9790, we may see a decline to around 0.9717, where the 23.6% Fibonacci retracement (based on the entire Jun-Aug rally) is.
From today’s point of view, we see that currency bears pushed the pair lower as we had expected. With this downswing USD/CHF reached our downside target and then rebounded slightly. Despite this move, the exchange rate remains below the lower border of the consolidation, which suggests that we may see a drop to 0.9701, where the size of the downward move will correspond to the height of the formation. If this area is broken, the next downside target would be around 0.9664, where the lower border of the brown rising trend channel is.
Very short-term outlook: bearish
Short-term outlook: mixed with bearish bias
MT outlook: mixed
LT outlook: mixed
Trading position (short-term; our opinion): No positions are justified from the risk/reward perspective at the moment. We will keep you informed should anything change, or should we see a confirmation/invalidation of the above.
Thank you.
Nadia Simmons
Forex & Oil Trading Strategist
Przemyslaw Radomski, CFA
Founder, Editor-in-chief
Gold & Silver Trading Alerts
Forex Trading Alerts
Oil Investment Updates
Oil Trading Alerts

