

Earlier today, the National Australia Bank showed that its business confidence index climbed to 10 in June, which pushed AUD/USD above 0.7400. But did this increase change anything in the short-term picture?
In our opinion the following forex trading positions are justified - summary:
EUR/USD
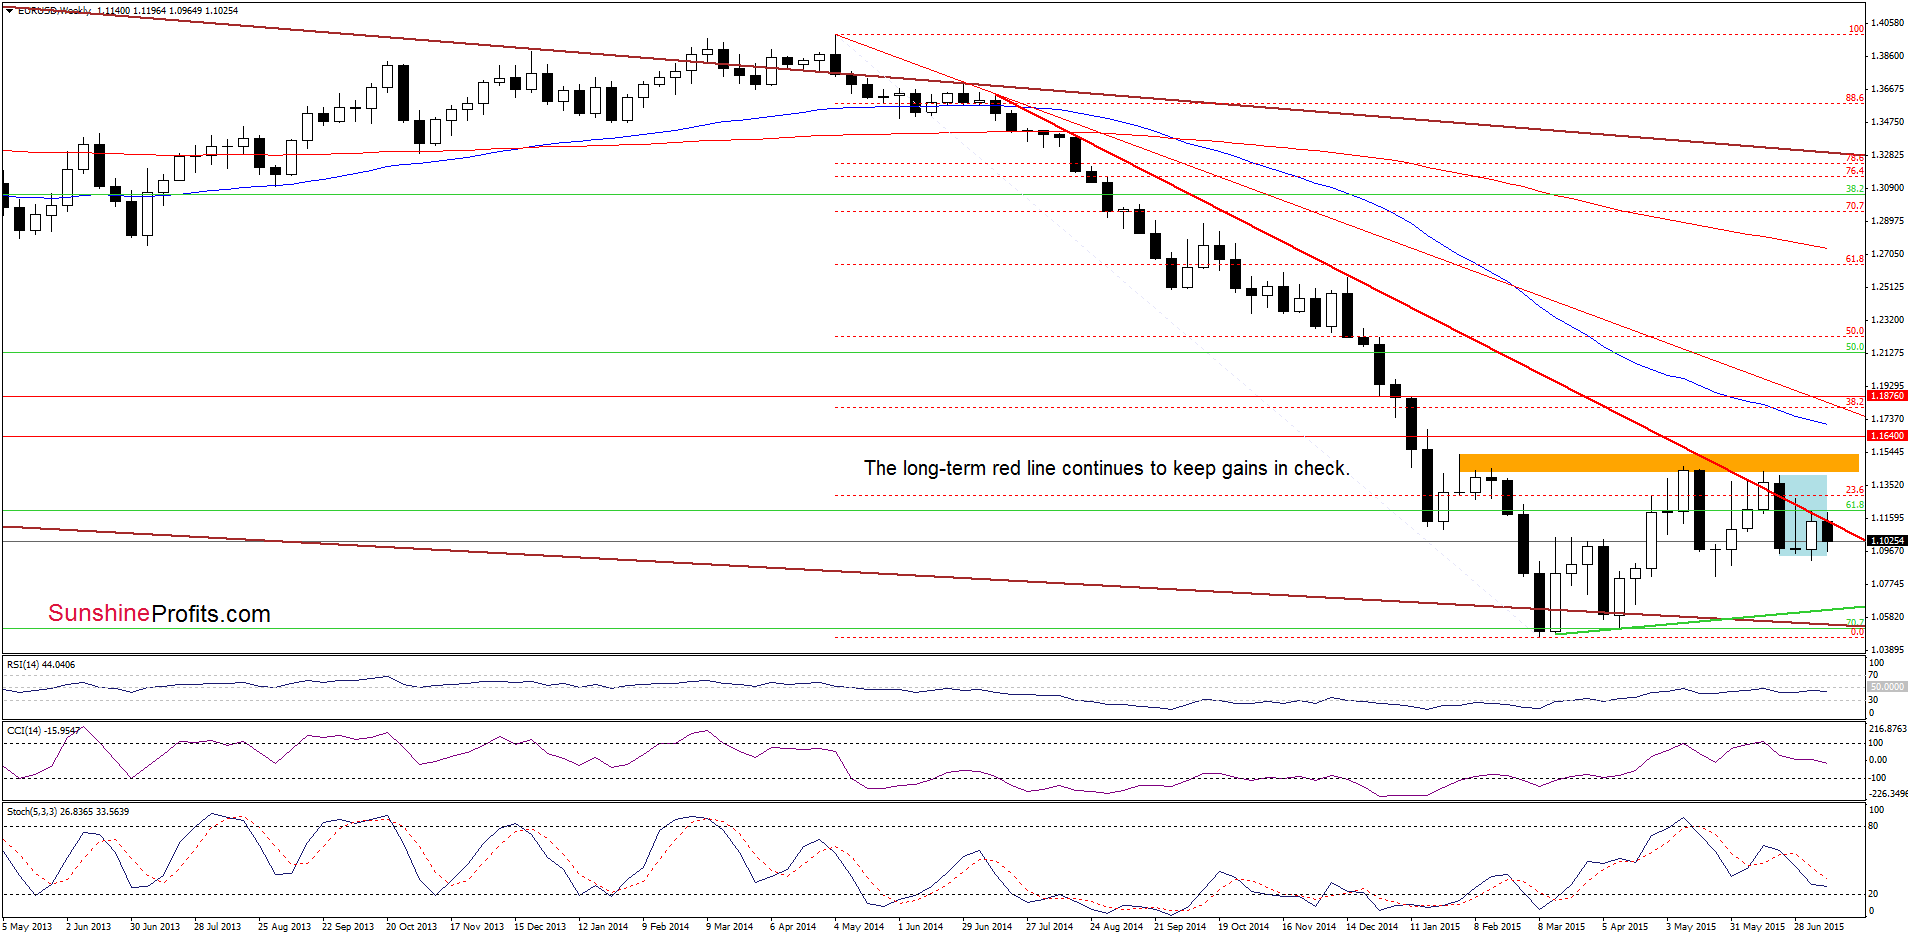
Looking at the weekly chart we see that although currency bulls tried to push EUR/USD above the previously-broken long-term red declining line, they failed once gain, which resulted in a decline. In this way, the exchange rate invalidated earlier small breakout above this major resistance line, which is a bearish signal (especially when we factor in the current position of the indicators – sell signals remain in place).
What impact did this move have on the very short-term picture? Let’s check.
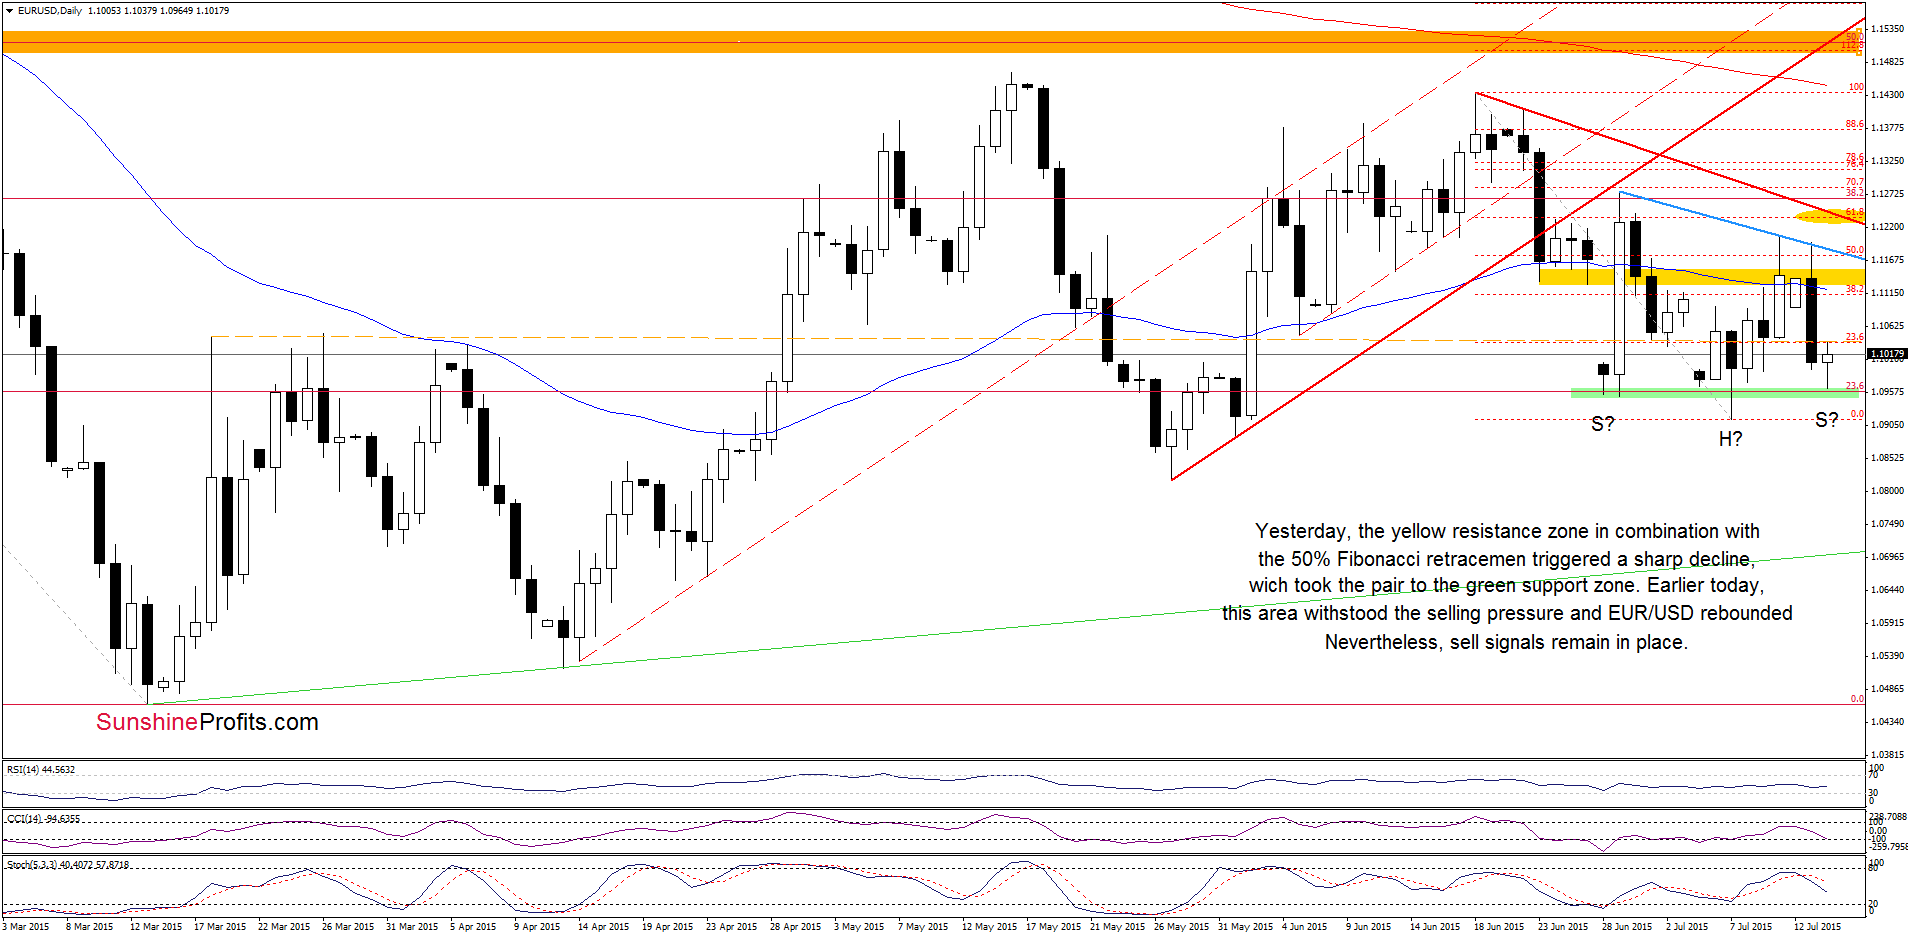
From this perspective we see that although EUR/USD moved sharply higher on Friday, the yellow resistance zone in combination the 50% Fibonacci retracement level (based on the Jun-Jul decline) stopped further rally. As a result, the exchange rate reversed and invalidated earlier breakout. This negative signal encouraged currency bears to act, which took the pair to the green support zone. Earlier today, this area triggered a small rebound, which may be the beginning of the right shoulder of the reverse head and shoulders formation. Nevertheless, this assumption will bring a bigger upward move, only if we see a breakout above the blue line (the neck line of the formation) and the key resistance line marked on the weekly chart.
Very short-term outlook: mixed
Short-term outlook: mixed
MT outlook: mixed
LT outlook: mixed
Trading position (short-term; our opinion): No positions are justified from the risk/reward perspective at the moment. We will keep you informed should anything change, or should we see a confirmation/invalidation of the above.
USD/CHF
On Thursday, we wrote the following:
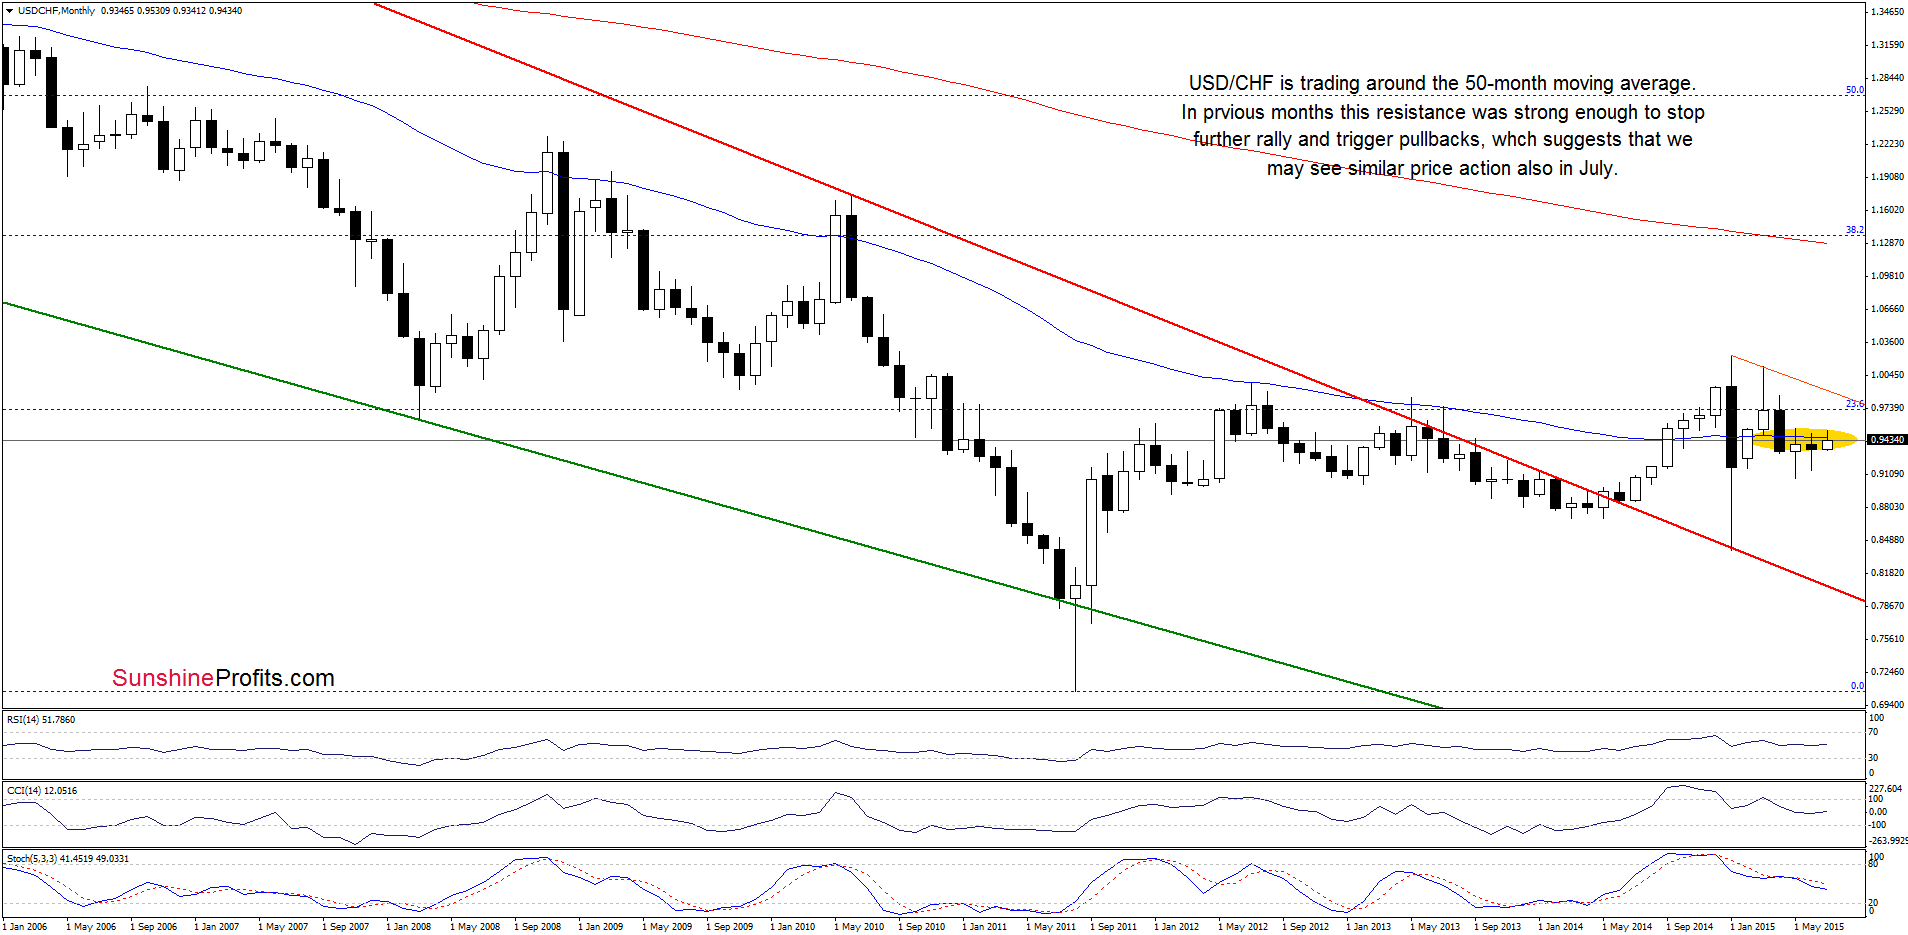
(…) USD/CHF is trading around the 50-month moving average, which was strong enough to stop further rally and trigger pullbacks in the previous months. Therefore, it seems to us that even if the exchange rate extends gains further rally will be more likely if we see a monthly close above this solid resistance.
Having said that, let’s zoom in our picture and examine the medium- and short-term charts.
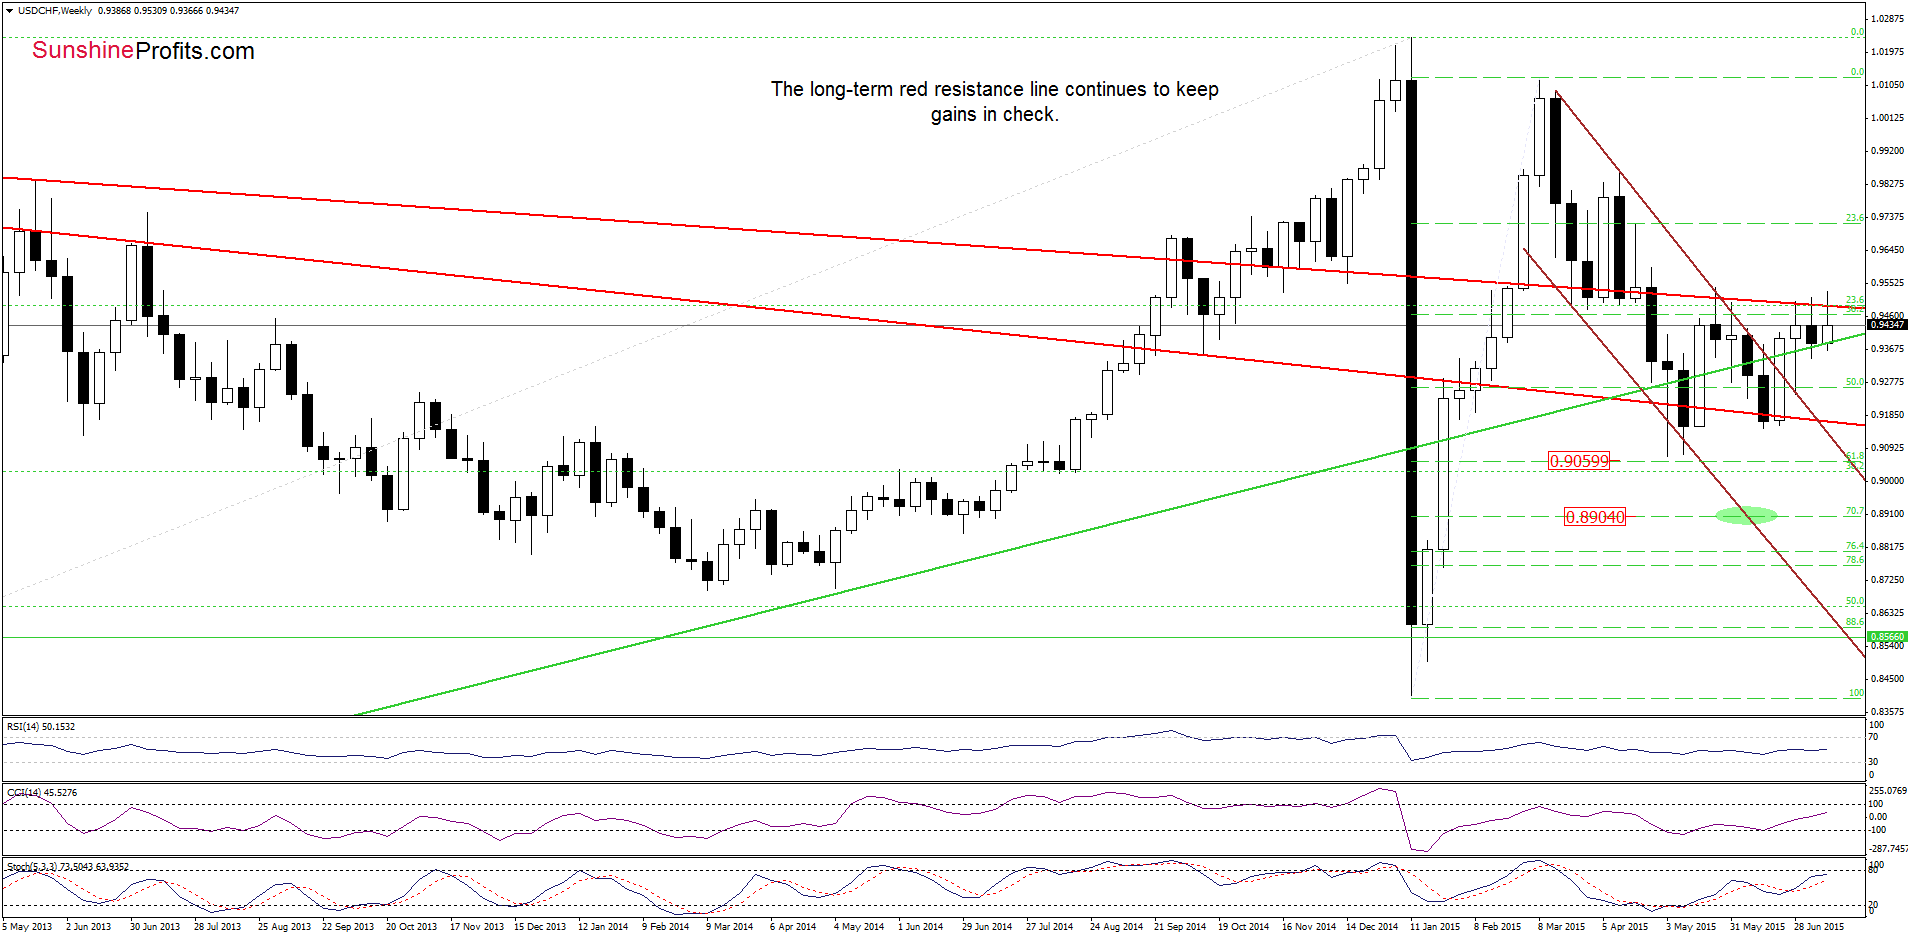
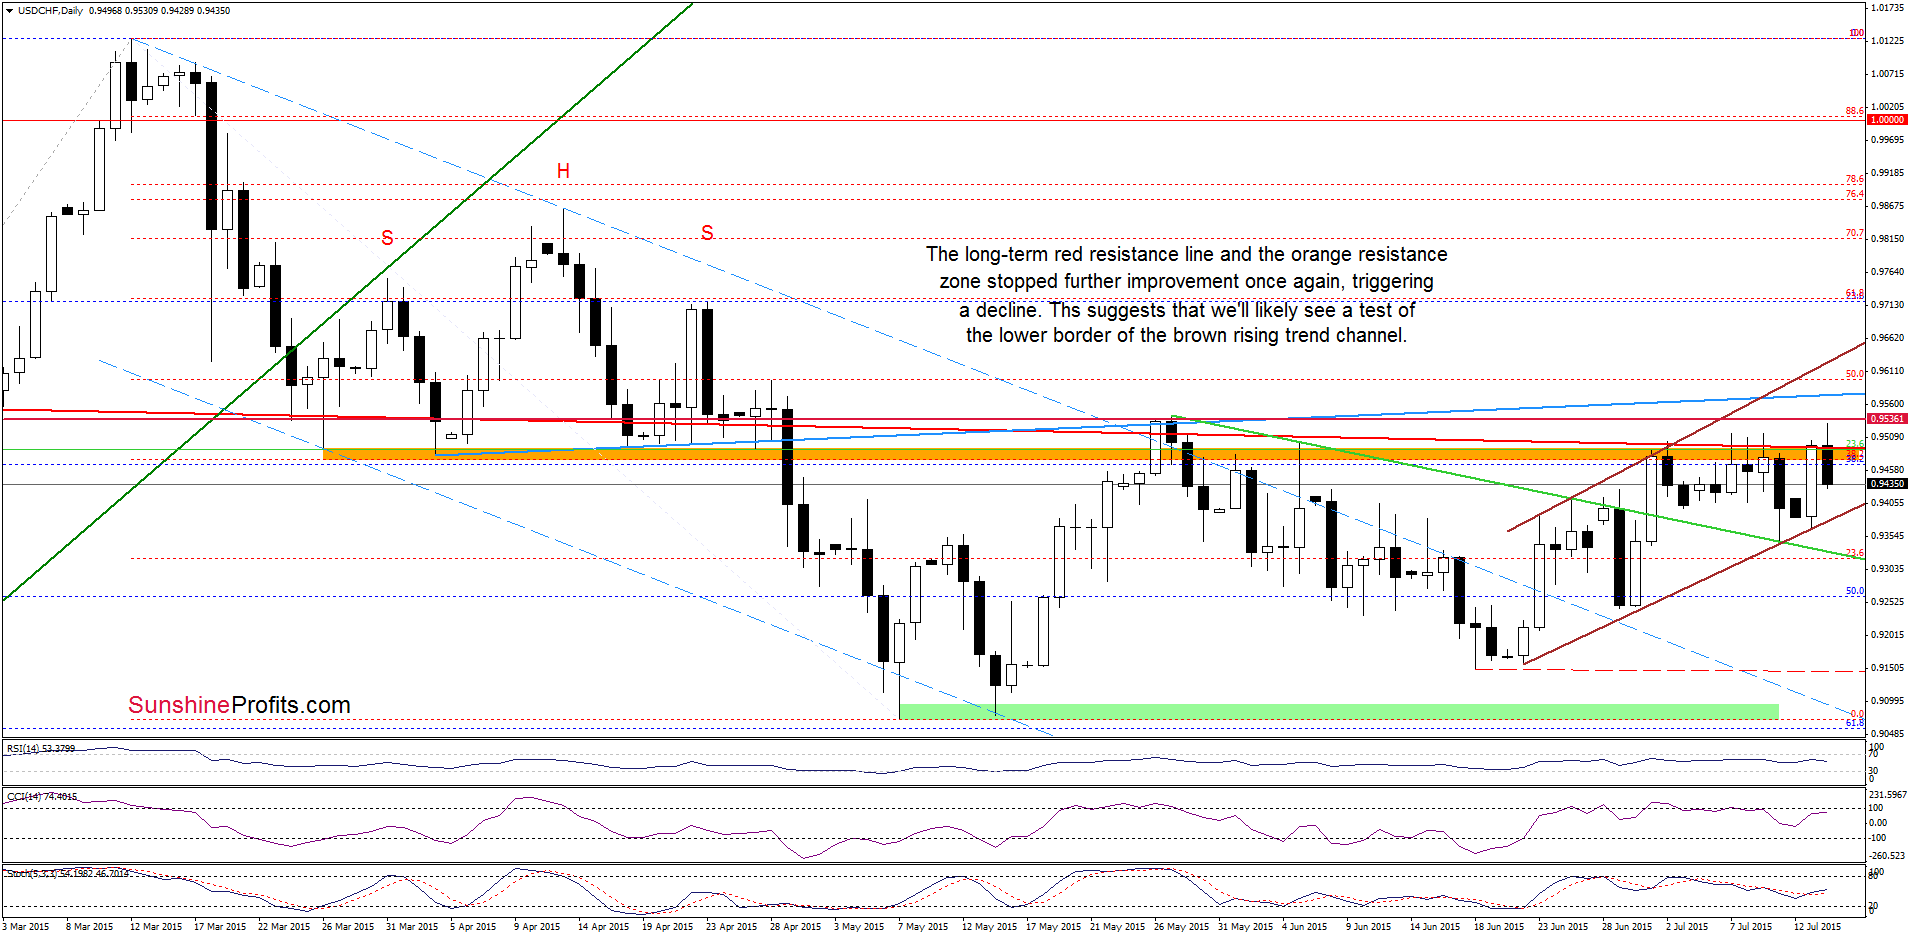
Yesterday, the lower border of the rising trend channel and the long-term green support line (marked on the weekly chart) stopped further declines, triggering a sharp rebound, which resulted in a rally to the long-term red line and the orange resistance zone. Although USD/CHF moved higher earlier today, currency bulls didn’t manage to hold gained levels (similarly to what we saw in the previous week). As a result, the exchange rate reversed and declined sharply, invalidating earlier breakout, which suggests that we’ll likely see another test of the brown support line in the coming day(s).
Finishing today’s commentary on this currency pair, please note that if the pair drops under the lower border of the trend channel, we may see a decline to 0.9243 (the Jun 29 low) or even to 0.9149-0.9156, where the Jun lows are.
Very short-term outlook: bearish
Short-term outlook: mixed
MT outlook: mixed
LT outlook: mixed
Trading position (short-term; our opinion): No positions are justified from the risk/reward perspective at the moment. We will keep you informed should anything change, or should we see a confirmation/invalidation of the above.
AUD/USD
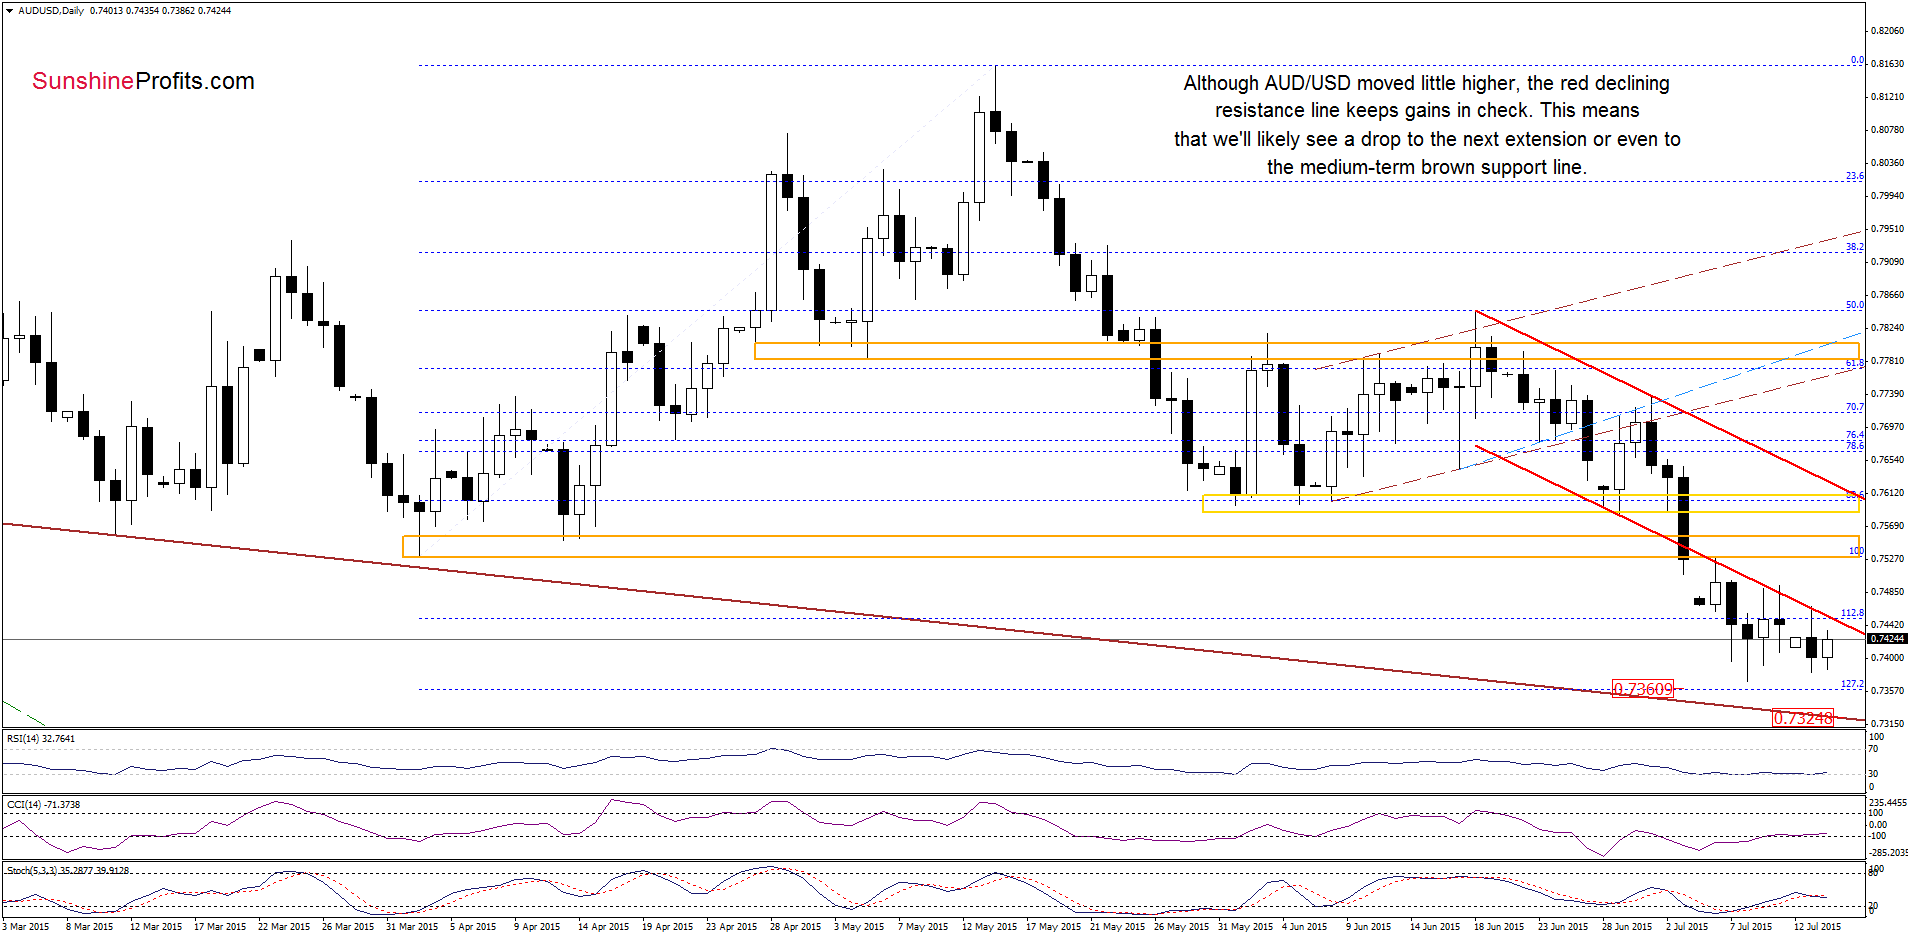
Earlier today, AUD/USD moved little higher and approached the previously-broken 112.8% Fibonacci extension. Despite this upswing, the pair remains under the red declining resistance line (the lower border of the declining trend channel), which suggests that as long as there is no invalidation of the breakdown another pullback is likely. If this is the case, and the pair moves lower from here, it would be a bearish signal, which will likely result in a test of the recent low or even trigger a decline to the 127.2% extension in the coming day(s).
What could happen if these levels are broken? We think that the best answer to this question will be the quote from our Wednesday’s alert.
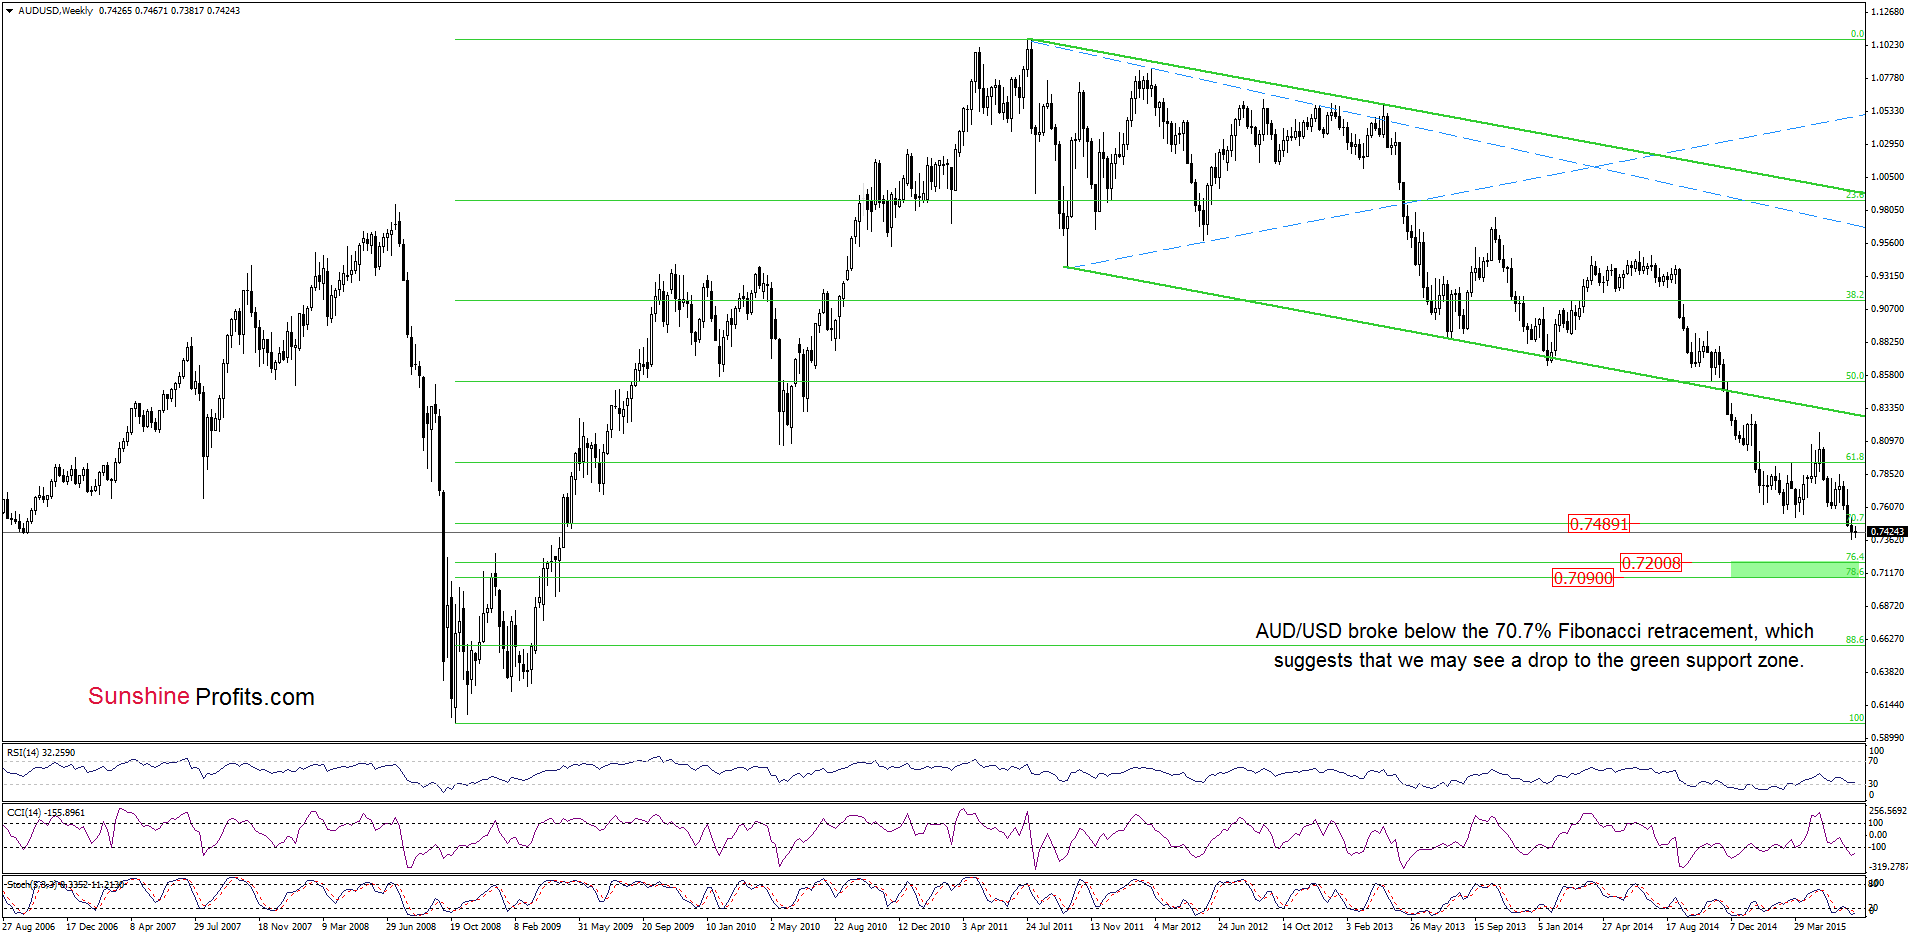
(…) AUD/USD broke below the 70.7% Fibonacci retracement, which suggests that if currency bulls fail around 0.7336-0.7360, we may see a decline even to the green support zone based on the 76.4% and 78.6% Fibonacci retracement levels (around 0.7097-0.7200) in the coming week(s).
Very short-term outlook: mixed with bearish bias
Short-term outlook: mixed
MT outlook: mixed
LT outlook: mixed
Trading position (short-term; our opinion): No positions are justified from the risk/reward perspective at the moment. We will keep you informed should anything change, or should we see a confirmation/invalidation of the above.
Thank you.
Nadia Simmons
Forex & Oil Trading Strategist
Przemyslaw Radomski, CFA
Founder, Editor-in-chief
Gold & Silver Trading Alerts
Forex Trading Alerts
Oil Investment Updates
Oil Trading Alerts

