
On Friday, the common currency rebounded sharply after disappointing U.S. employment data, which showed that the U.S. economy added 209,000 jobs in July, missing expectations for an increase of 233,000. As a result, EUR/USD erased over 20% of recent declines and came back above 1.3400. Will currency bulls manage to push the pair higher?
In our opinion the following forex trading positions are justified - summary:
EUR/USD
In our Forex Trading Alert posted on July 23, we wrote the following:
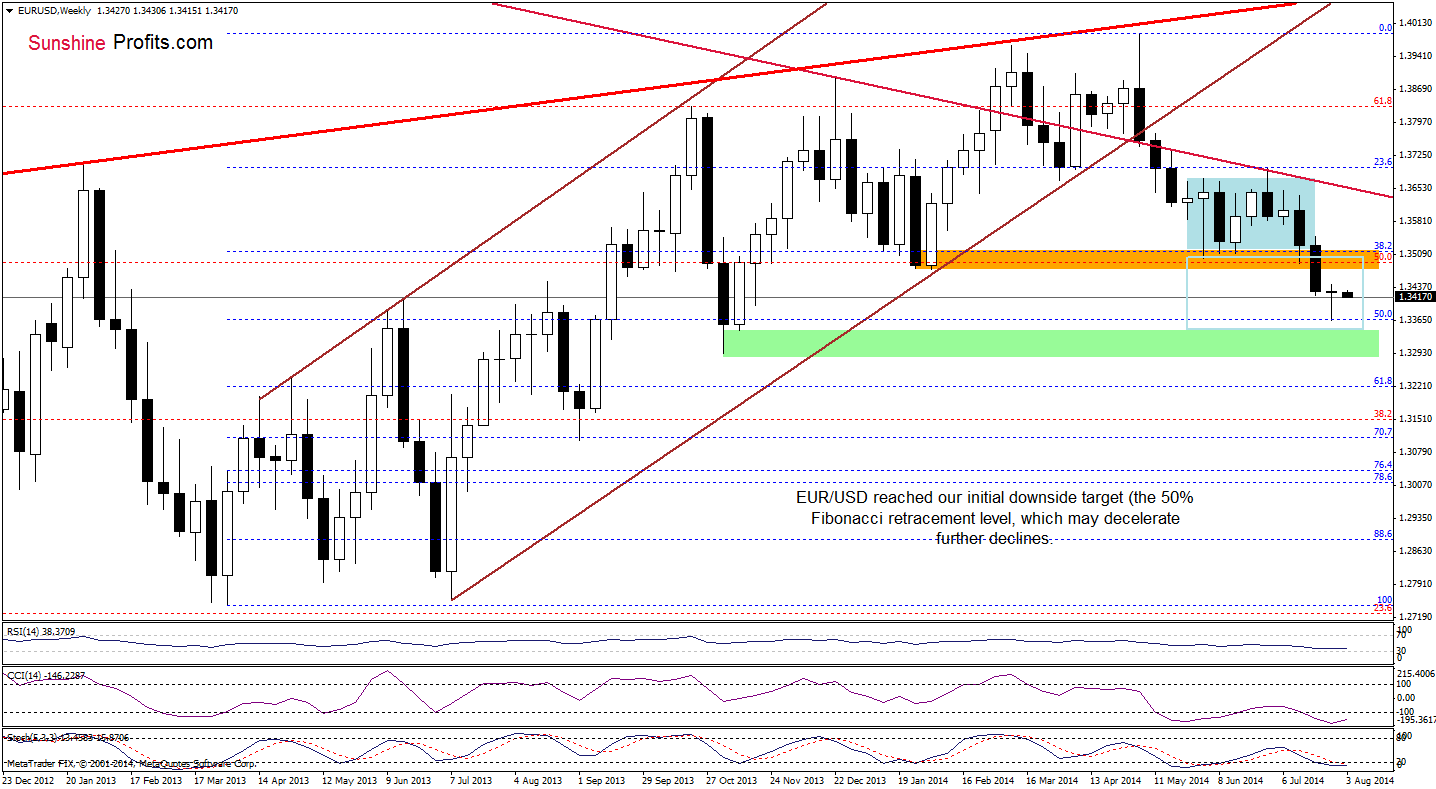
(…) we may see a drop even to around 1.3320, where the size of the downswing will correspond to the height of the consolidation.
Please keep in mind that before currency bears will be able to realize the above-mentioned scenario, they will have to break below the 50% Fibonacci retracement level (around 1.3367), which serves as the nearest medium-term support at the moment.
Looking at the above chart, we see that the situation in the medium term has deteriorated in the previous week as EUR/USD extended losses and reached our initial downside target. As you see, this support level triggered a corrective upswing, but the size of the move is too small at the moment to say that the medium-term outlook has improved. Therefore, as long as the exchange rate remains below the last week’s high another test of the strength of the 50% Fibonacci retracement and attempt to reach the next downside target can’t be ruled out.
Having say that, let’s check where the very short-term changes.
Quoting our Forex Trading Alert posted on Tuesday:
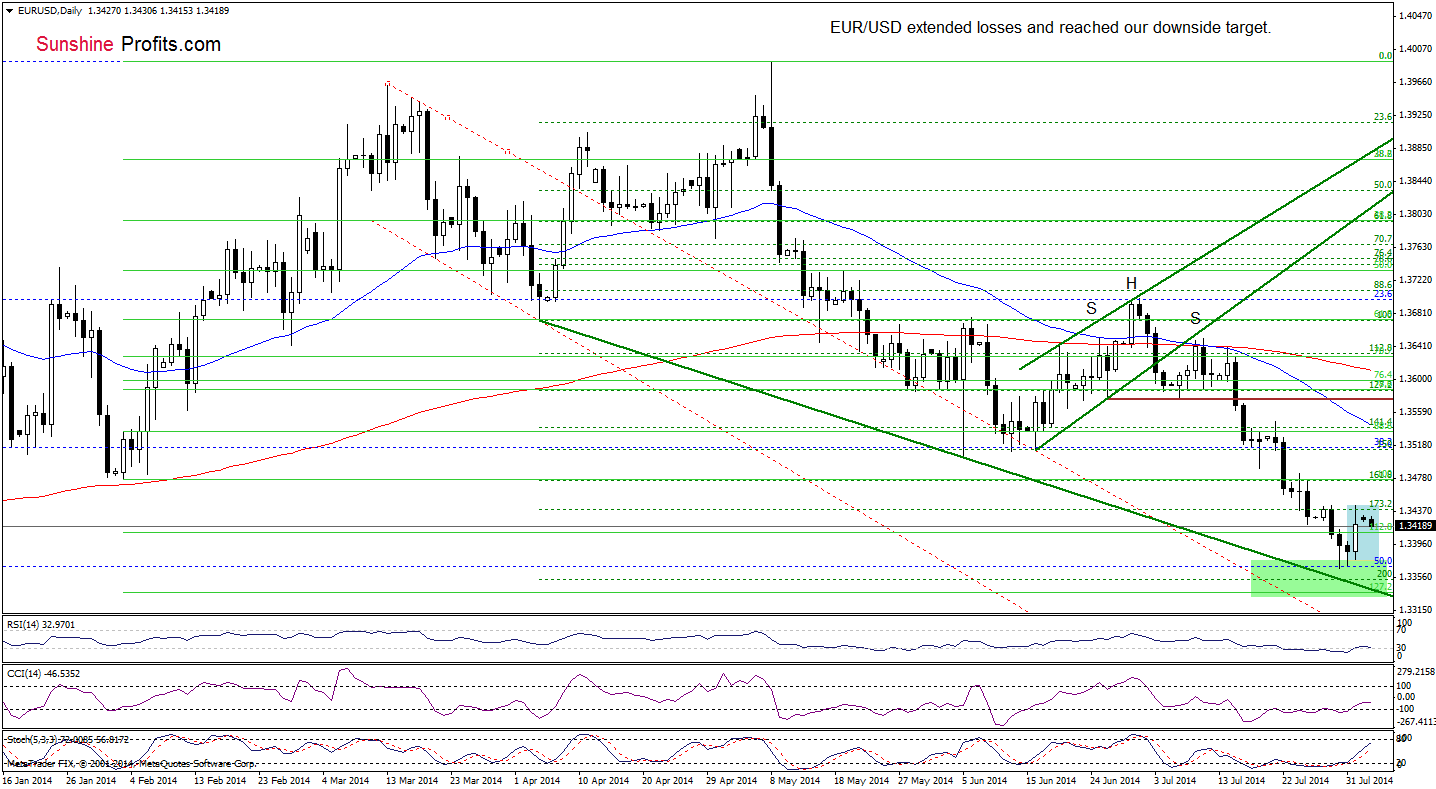
(…) the pair will drop to around 1.3335-1.3368, where the very strong support zone (created by the 50% Fibonacci retracement, the 200% Fibonacci extension based on the Apr-May increase, the 127.2% Fibonacci extension based on the entire Feb-Ma rally and the medium-term green support line) is. (...) we should keep an eye on the current EUR/USD moves as the position of the indicators suggests that a pause or corrective upswing is just around the corner (on the short-term basis).
It turned out that our projections were correct. On the above chart, we see that although the green support zone encouraged forex traders to push the buy button and triggered a sharp corrective upswing on Friday, this move erased only 23,6% of the entire decline that we saw in July. Therefore, we think that it’s too early to say that the very short-term outlook has improvement. As you see on the above chart, recent days have formed a consolidation. If the pair breaks above the upper border of the formation, we’ll see further improvement and an increase to at least February lows (around 1.3476-1.3483). On the other hand, if the exchange rate moves below Friday’s low, EUR/USD will test the strength of the green support zone.
Very short-term outlook: bearish
Short-term outlook: bearish
MT outlook: bearish
LT outlook: bearish
Trading position (short-term): So far, we noticed only one-day rally and a small consolidation, which didn’t change the short-term picture. Nevertheless, it’s quite likely that a local bottom is materializing right now as EUR/USD reached an important support zone (and also our downside price target), which may translate to a bigger corrective upswing. Therefore, we think that cashing out of the short positions (opened on July 16 at 1.3523) and taking profits off the table seems to be appropriate. We will keep you informed should anything change, or should we see a confirmation/invalidation of the above.
GBP/USD
In our Forex Trading Alert, posted on July 24, we wrote:
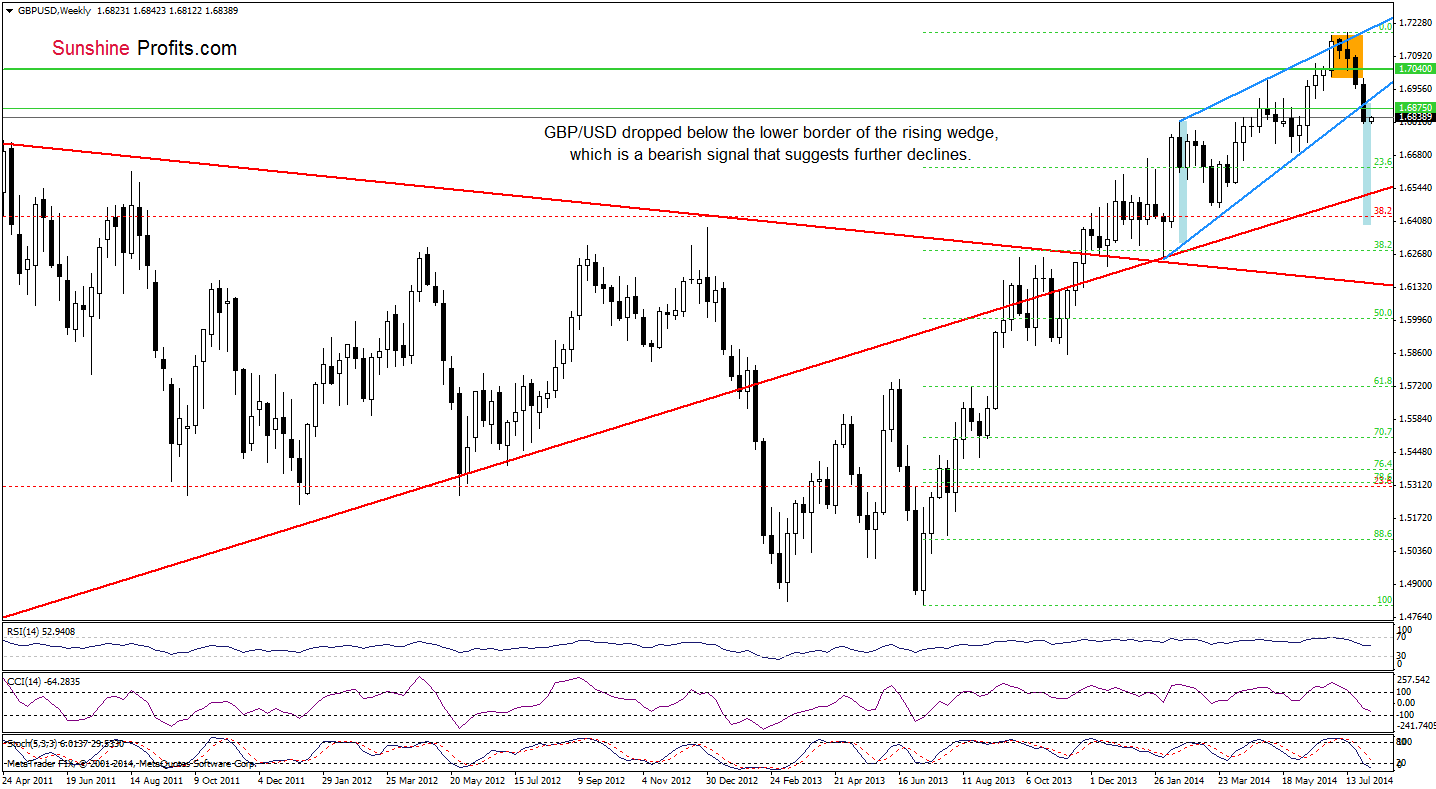
(…) the exchange rate also dropped below the key support line created by the 2009 high, which is a bearish signal that suggests further deterioration. If the pair doesn’t invalidate the breakdown, we’ll see a drop to at least 1.6875, where the next horizontal support line (based on the Nov 2009 high) is.
As you see on the above chart, the situation developed in line with the above-mentioned scenario as GBP/USD declined below its initial target in the previous week. With this downswing, the exchange rate also dropped under the lower border of the rising wedge, which is an additional bearish signal that suggests further deterioration. If this is the case, the next downside target will be the support zone created by the May and June lows (around 1.6692-1.6766).
Are there any short-term support levels that could stop currency bears? Let’s check.
In our commentary posted on July 18, we wrote:
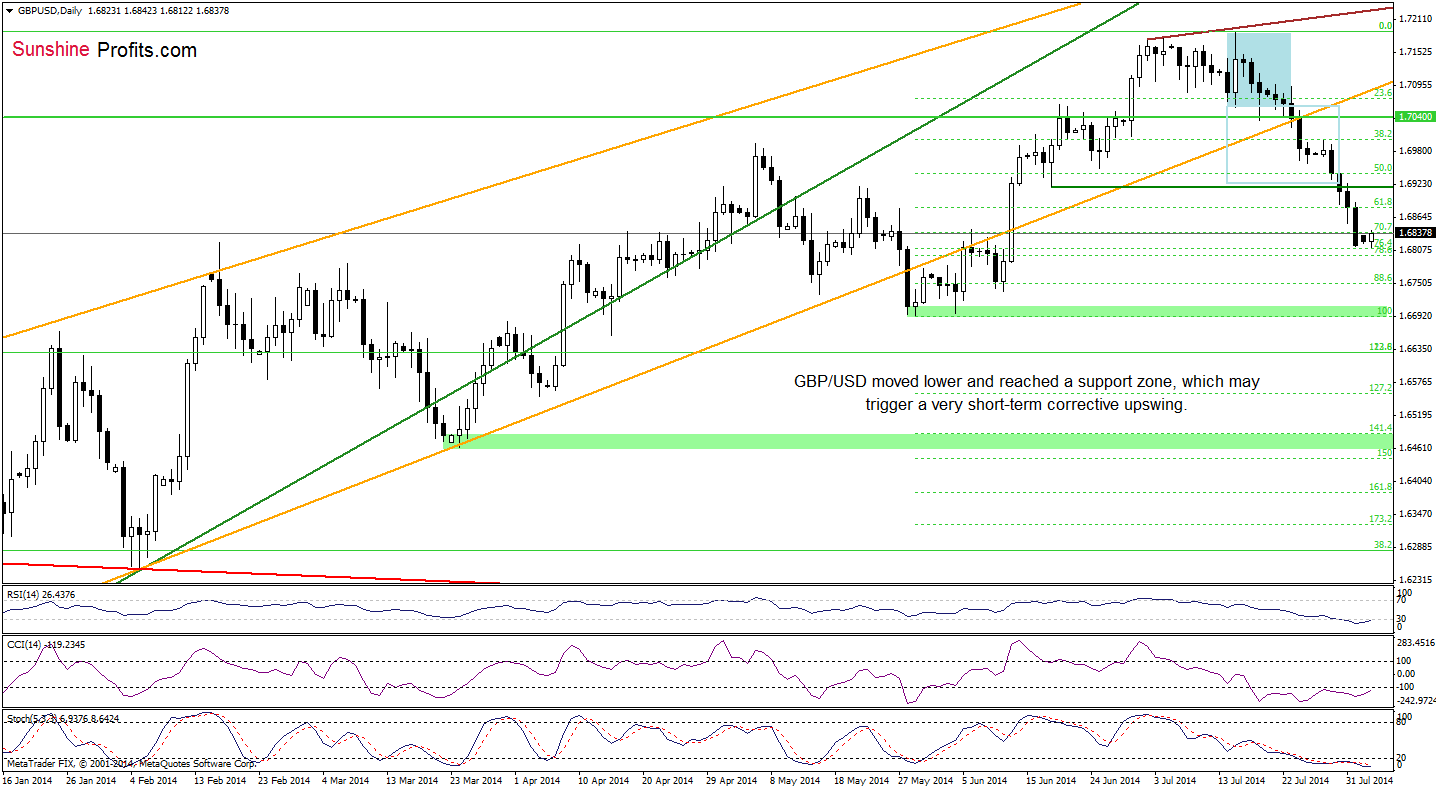
(…) So, where the pair head next? In our opinion, (…) the next move will be to the downside. As you see on the above chart, if the pair breaks below the lower border of the consolidation, the nearest downside target will be the 2009 high, and the next - the medium-term orange line. Please note that only if the pair breaks below these lines, we’ll see a correction to around June 18 low, where the size of a pullback will correspond to the height of the formation.
As you can see on the above chart, our projections were correct. The currency bears not only realized the above-mentioned scenario, but also managed to push the pair lower – to the support zone created by the 76.4% and 78.6% Fibonacci retracement levels based on the May-July rally. Based on our experience, we believe that this is very important area, because in many cases in the past (and not only on the currency market) this zone managed to pause or even stop further deterioration. Therefore, if history repeats itself, we’ll see a corrective upswing to around 1.6917 (the June 18 low) in the coming day (or days). Nevertheless, if it is broken, the exchange rate, will extend declines and drop to 1.6753 or even to the May low of 1.6691.
Very short-term outlook: mixed
Short-term outlook: mixed
MT outlook: bearish
LT outlook: mixed
Trading position (short-term): In our opinion, no positions are justified from the risk/reward perspective. We will keep you informed should anything change, or should we see a confirmation/invalidation of the above.
USD/CHF
Quoting our Forex Trading Alert posted on July 25:
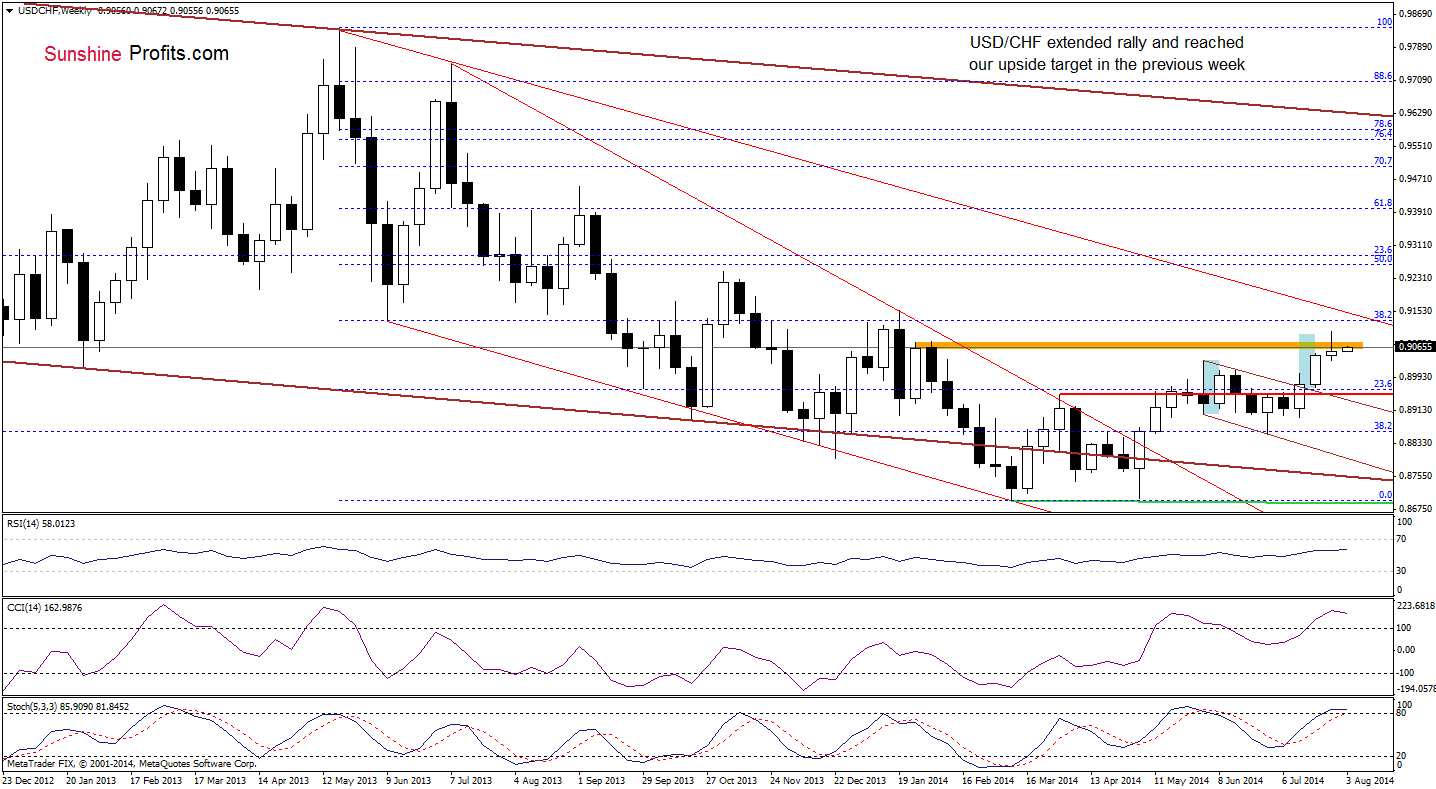
(…) taking into account the current position of the indicators (which still have space for further growths), it seems that the exchange rate will move higher and reach its next upside target (around 0.9091), which corresponds to the height of the trend channel.
As you see on the above chart, the situation in the medium term has improved in the previous week as we expected. On the weekly chart, we see that USD/CHF extended rally and reached its upside target, but then gave up some gains. Despite this small drop, the pair is still trading near last week’s high, which suggests that currency bulls may try to push the exchange rate higher – to the 38.2% Fibonacci retracement based on the entire May 2013-March 2014 decline (this area is also reinforced by the long-term declining resistance line, which will likely stop further improvement). Nevertheless, we should keep an eye on the current USD/CHF moves because the position of the indicators suggests that correction in the coming week (or weeks) is quite likely.
Are there any short-term factors that could stop further improvement? Let’s check.
On July 25, we wrote:
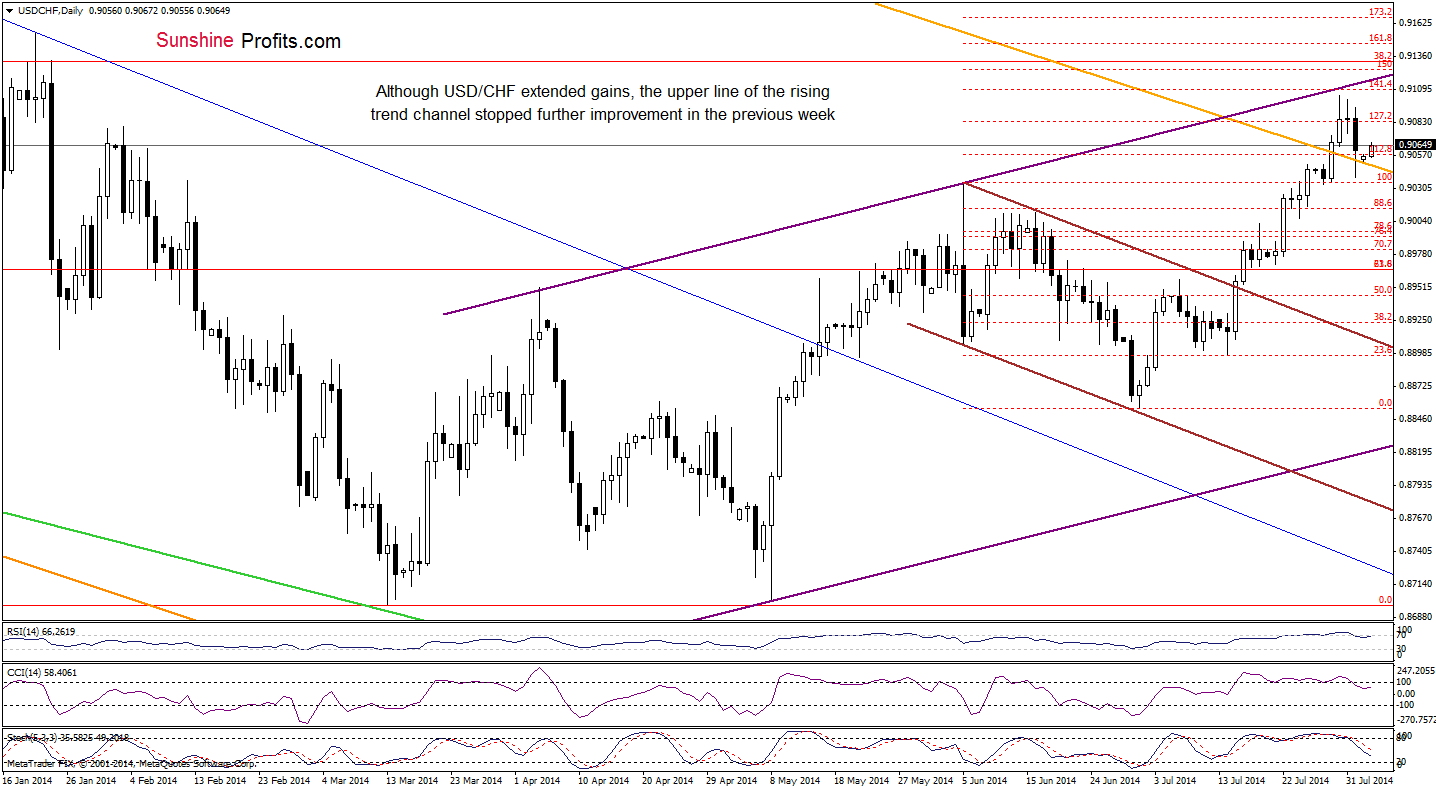
(…) it seems that there is nothing that could stop currency bulls before a test of the strength of the resistance zone created by the 112.8% Fibonacci extension and the declining resistance line (marked with orange and based on the May and July 2013 highs).
In our last commentary on this currency pair we added:
(…) USD/CHF reached our upside target. (…) if currency bulls manage to push the pair higher, the next upside target will be at 0.9083 (the 127.2% Fibonacci extension) or even around 0.9109, where the upper line of the rising trend channel (marked with purple) intersects the 141.4% Fibonacci extension.
From this perspective, we see that currency bulls realized the above-mentioned scenario, just as we expected - the exchange rate broke above the 127.2% Fibonacci extension and approach the upper line of the rising trend channel last week. The proximity to this strong resistance encouraged forex traders to push the sell button, which resulted in a pullback to the previously-broken orange support/resistance line. So far, it holds, which means that we may see another attempt to break above the upper border of the trend channel in the near future. However, taking into account sell signals generated by the indicators, we should also consider a bearish scenario, which suggests a drop below the nearest support and correction to at least Friday’s low of 0.9039.
Very short-term outlook: mixed
Short-term outlook: mixed
MT outlook: mixed with bullish bias
LT outlook: bearish
Trading position (short-term): In our opinion no positions are justified from the risk/reward perspective. We will keep you informed should anything change, or should we see a confirmation/invalidation of the above.
Thank you.
Nadia Simmons
Forex & Oil Trading Strategist
Przemyslaw Radomski, CFA
Founder, Editor-in-chief
Gold & Silver Trading Alerts
Forex Trading Alerts
Oil Investment Updates
Oil Trading Alerts

