

The week is over, and a new one starts. The weekly pairs’ closes provide us with more clues to manage the trade(s) using most up-to-date information. Sensible and careful trading doesn’t end with getting the entry point right and remaining glued to the screen till some predetermined target is hit. So, what are we to do?
- EUR/USD:short (a stop-loss order at 1.1416; the initial downside target at 1.1305)
- GBP/USD: none
- USD/JPY: none
- USD/CAD: none
- USD/CHF: none
- AUD/USD: half of short positions (with a stop-loss order at our entry level at 0.7228 and the next downside target at 0.7041)
EUR/USD
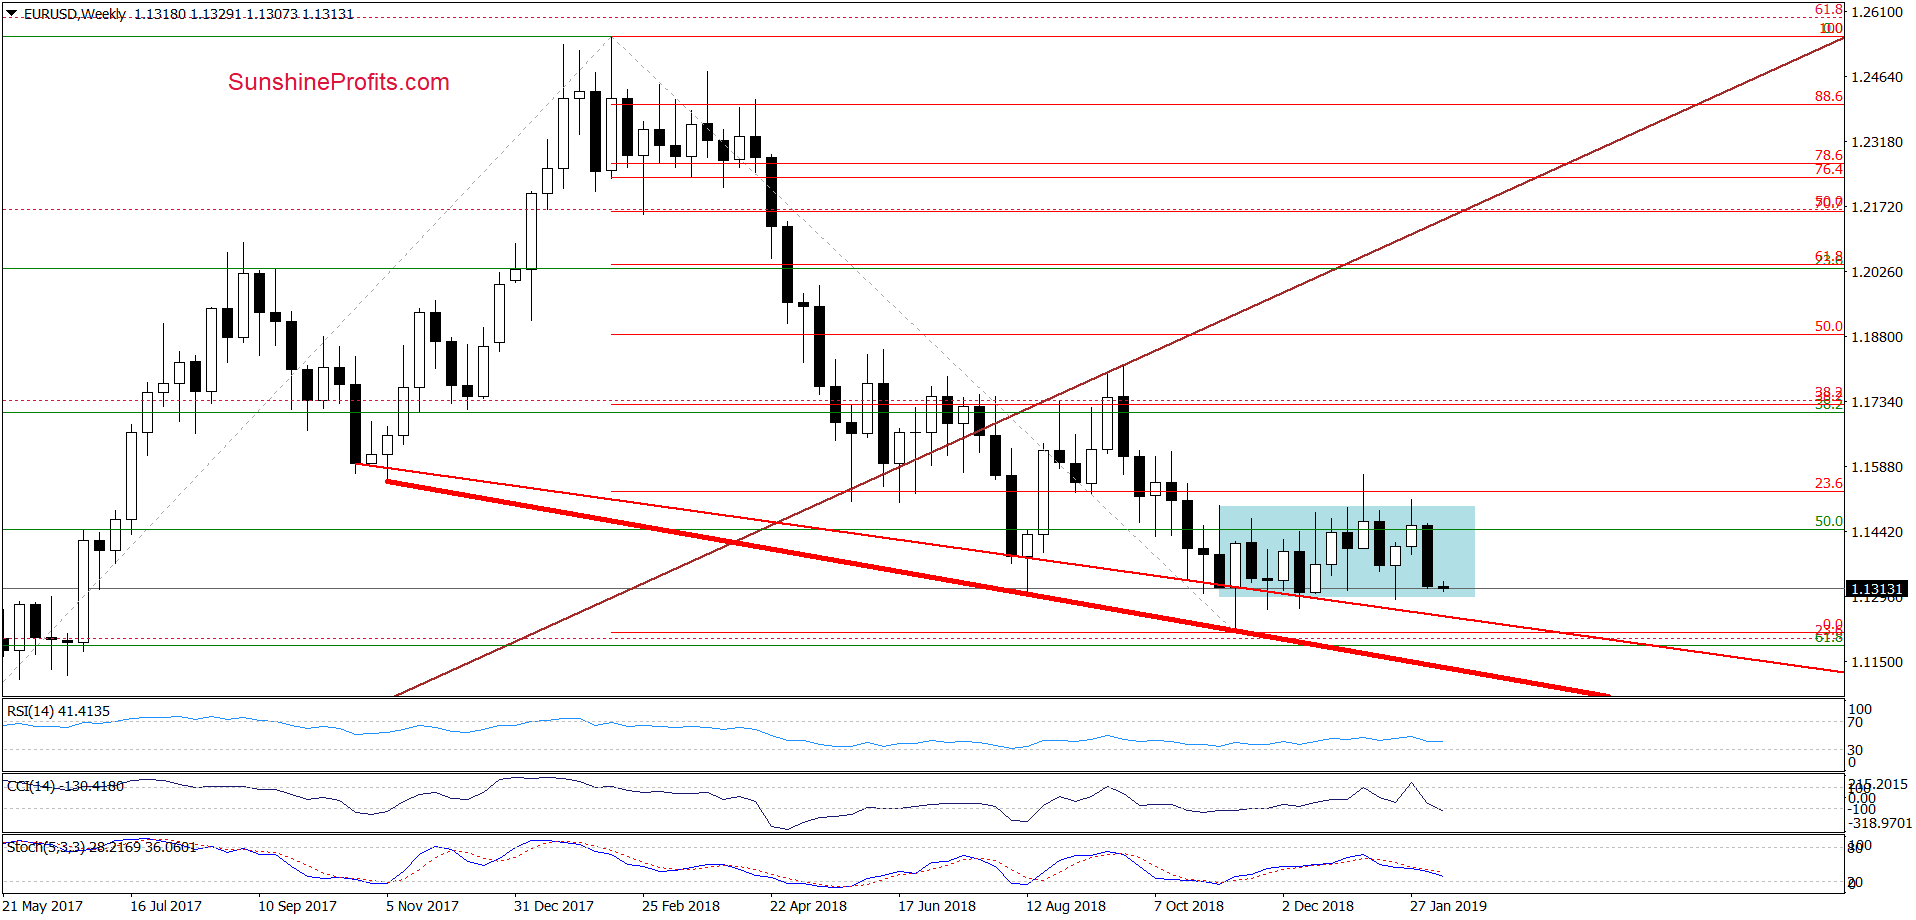
On the weekly term chart, we see that EUR/USD decline took the pair to the lower border of the blue consolidation. As the CCI issued its sell signal and the Stochastic Oscillator’s sell signal is on, we are of the opinion that further deterioration is still ahead of us.
Let’s take a look at the very short-term picture for more clues.
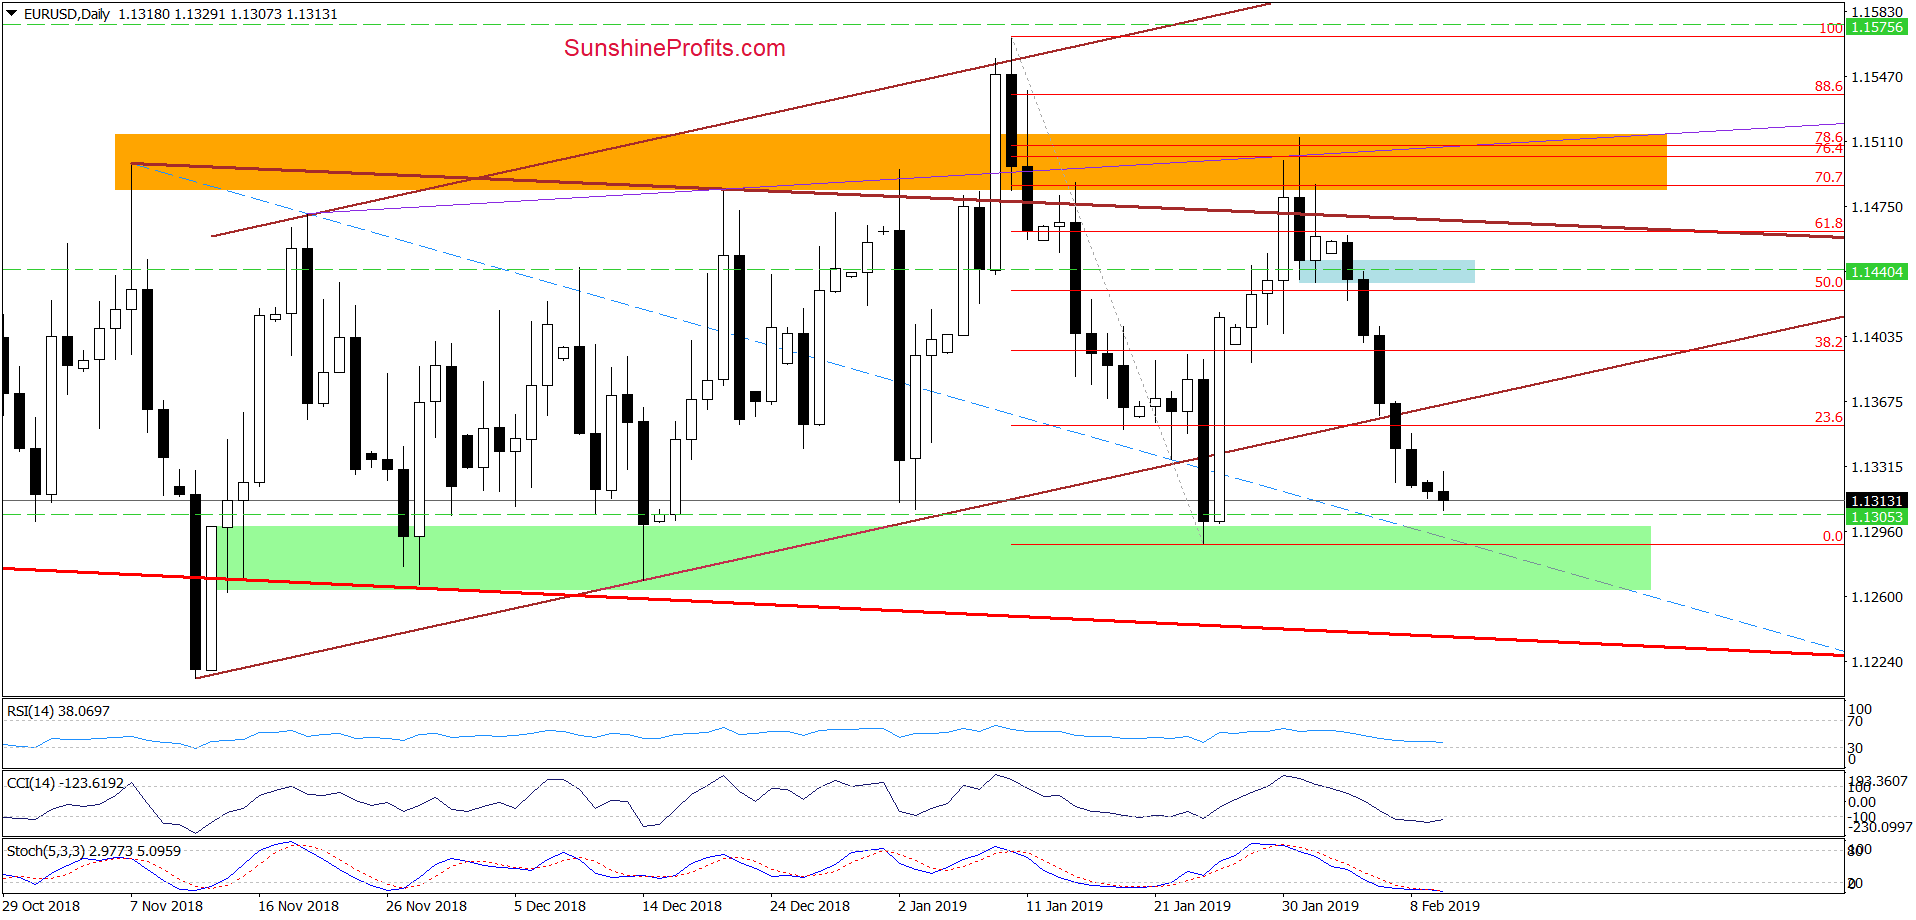
From the daily perspective, we see that EUR/USD finished another session below the lower border of the brown rising trend channel. As there are no buy signals generated by the daily indicators, the probability of another attempt to move lower remains high.
Taking this fact into account, we believe that this recent commentary (where we took some profits off the table and adjusted the stop-loss order) on this currency pair is up-to-date also today:
(…) The indicators are still positioned in a supportive way for such an outcome.
(…) we continue to believe that we’ll see a realization our pro-bearish scenario from our Friday’s alert:
(…) EUR/USD will likely turn south and re-test the lower border of the brown triangle or even the green support area, which stopped the sellers several times in recent weeks.
Finishing today’s commentary on this currency pair, we would like to add that we decided to move our stop-loss order below the entry price to protect some of our profits. Additionally, if the exchange rate drops to our initial downside target, we’ll close half of the current position and take profits off the table. The other half will stay in play with the lowered stop-loss order.
Trading position (short-term; our opinion): Profitable short positions with a stop-loss order at 1.1416 and the initial downside target at 1.1305 are justified from the risk/reward perspective. We will keep you informed should anything change, or should we see a confirmation/invalidation of the above.
USD/JPY
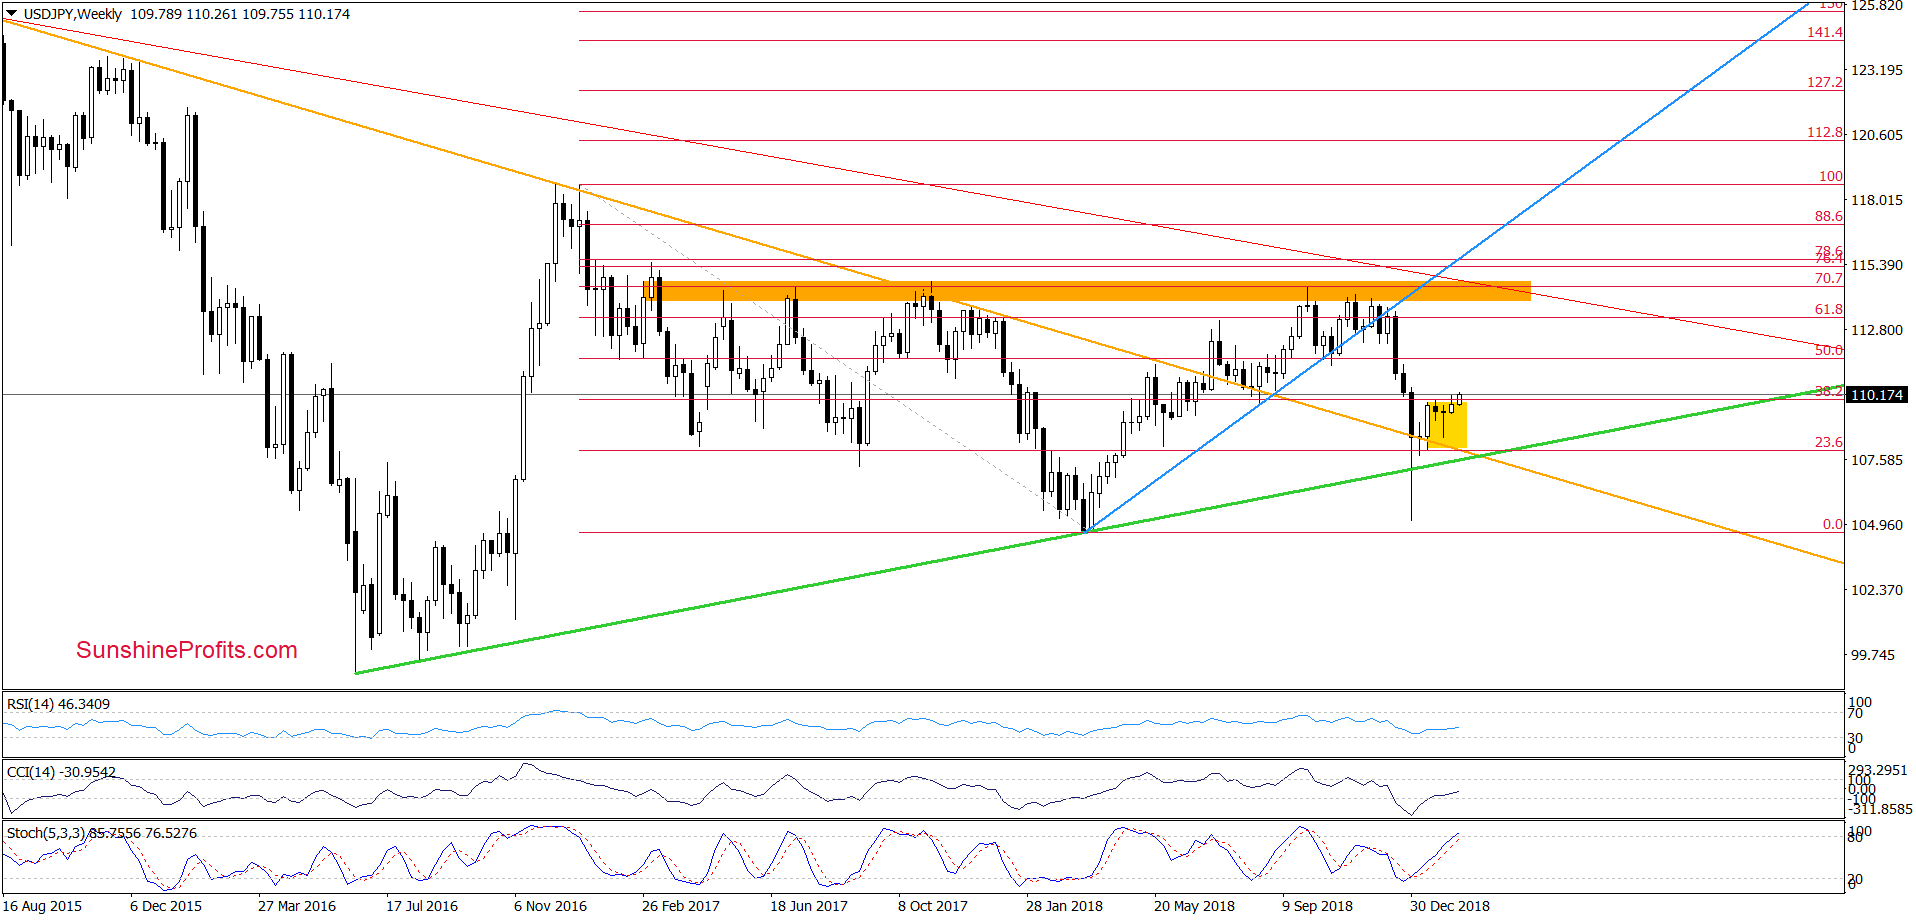
Looking at the weekly chart, we see that although USD/JPY moved a bit above the upper border of the yellow consolidation, this improvement was very temporary, and the pair pulled back before the week closed.
Earlier today, the bulls pushed the pair higher, but the week has only begun. There are four more days to go, which means that it’s prudent not to read too much into today’s move yet.
Having said all that, let’s check what can we infer from the daily chart.
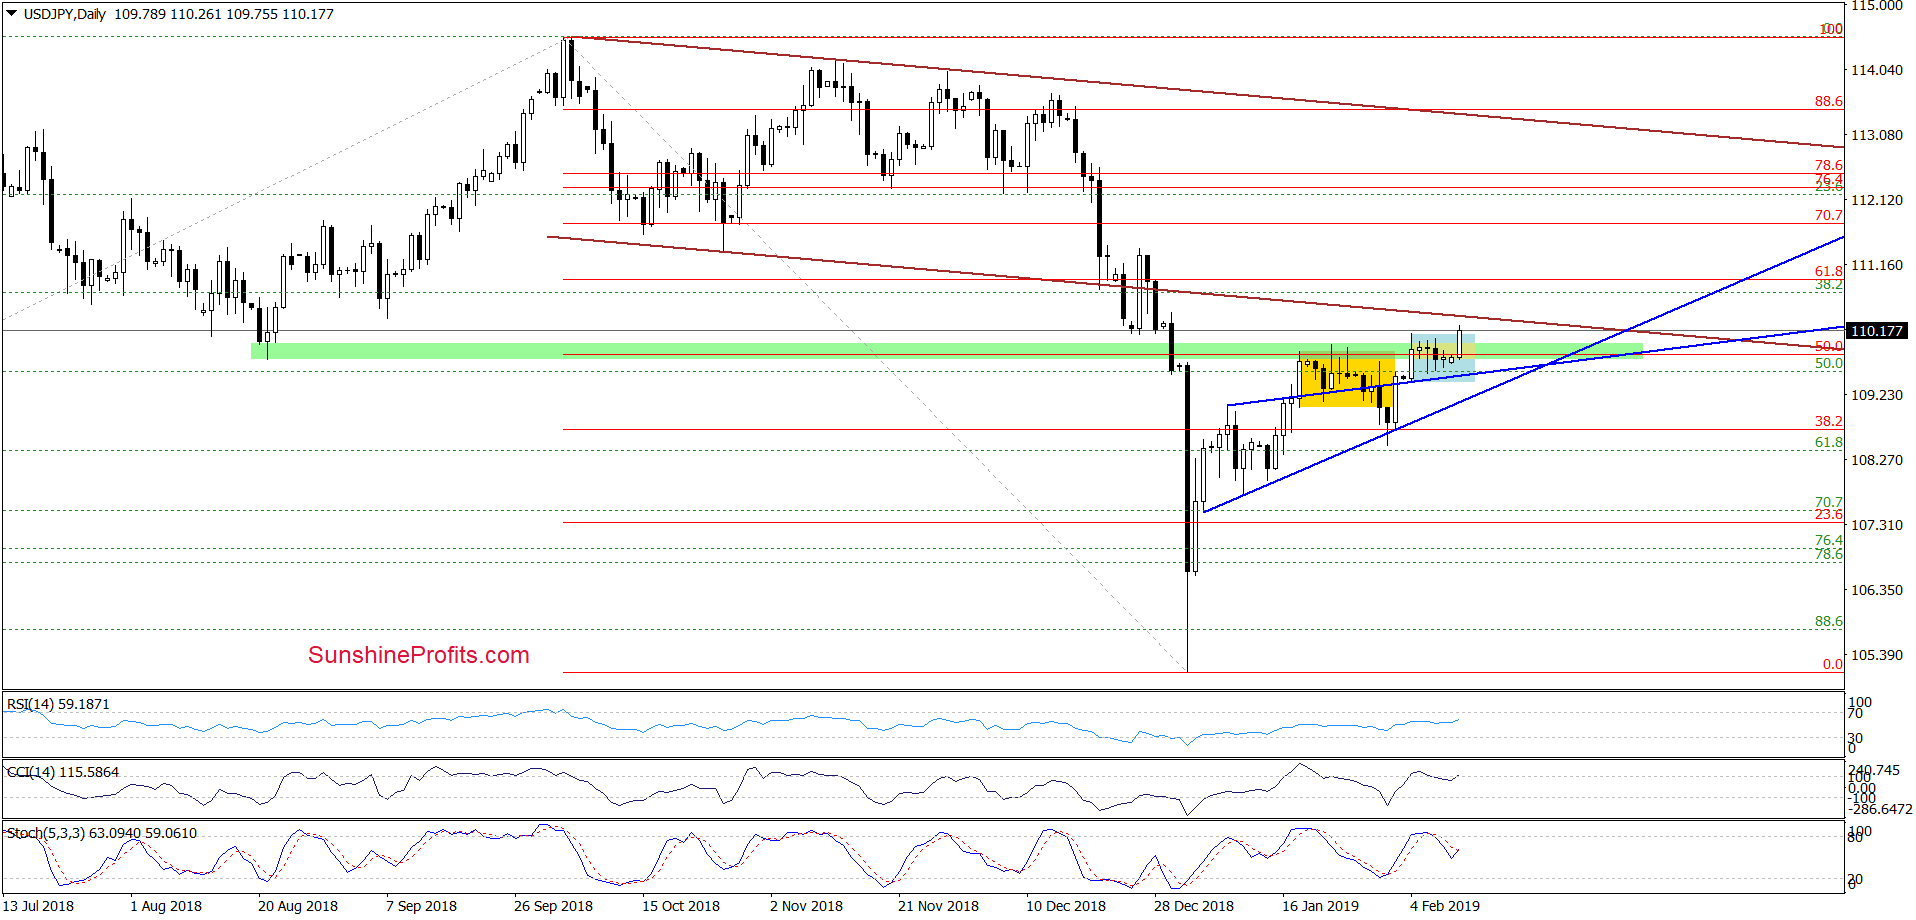
We see that USD/JPY has remained constrained inside the blue consolidation between the previously broken upper border of the blue triangle and the lower border of the brown declining trend channel for most of the previous week.
Earlier today, currency bulls triggered one more upswing, which took USD/JPY above the upper border of the blue consolidation. The daily indicators are short-term positioned in a way favoring the bullish resolution. Taking these into account, it is likely that the exchange rate will test the lower border of the brown declining trend channel in the very near future.
If the bulls show weakness here and don’t manage to push the price higher, we’ll likely see a reversal and lower values of USD/JPY. However, the bearish scenario will become more likely only if we see another reversal and a drop below both lines of the blue triangle. Seeing that, we’ll likely open short positions.
Trading position (short-term; our opinion): No positions are justified from the risk/reward perspective. As always, we will keep you – our subscribers – informed should anything change, or should we see a confirmation/invalidation of the above.
USD/CAD
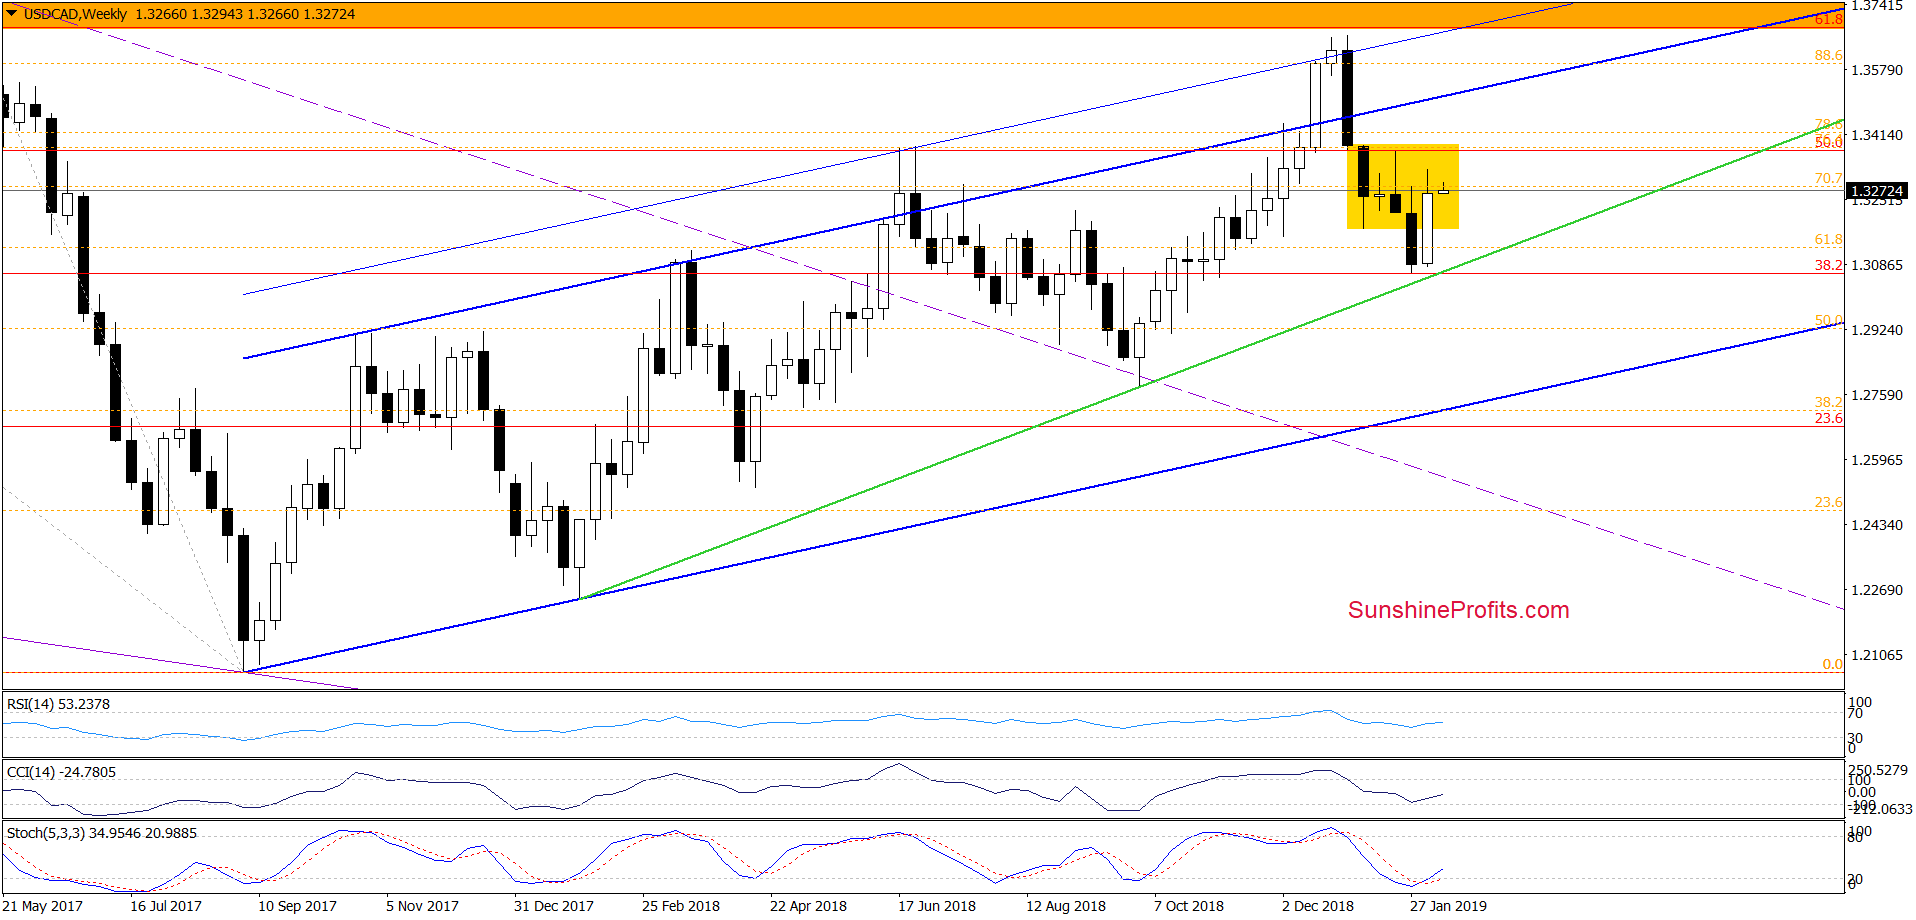
The first thing that catches the eye on the weekly chart, is an invalidation of the earlier breakdown below the lower border of the yellow consolidation. This is a positive development for the bulls.
Additionally, the CCI and the Stochastic Oscillator generated buy signals. The likelihood of further improvement in the coming week(s) has risen.
Are there any factors that can stop the bulls? Let’s examine the daily chart to find out.
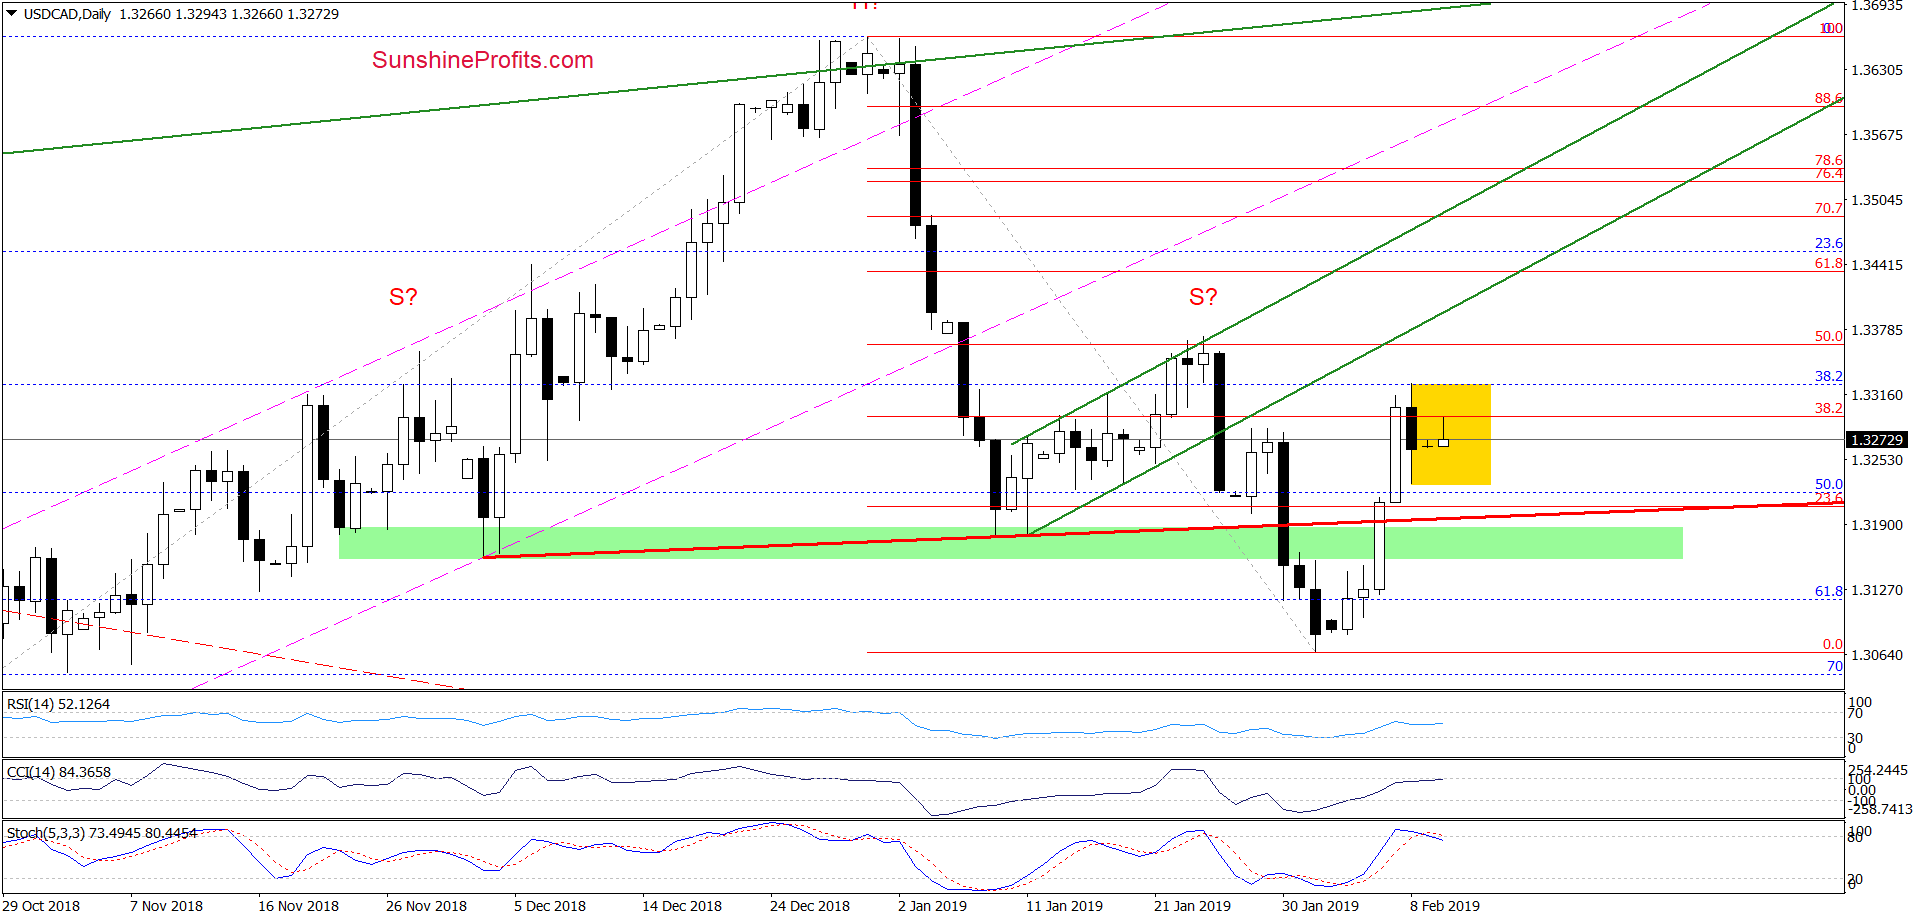
On Thursday, we wrote the following:
(…) As the daily indicators currently generated multiple buy signals, we think that we’ll likely see breakdown verification first before the price commits to the next move down.
Looking at the daily chart, we see that the buyers not only tested, but also managed to break above the red resistance line. In this way, USD/CAD invalidated the earlier breakdown below both the red resistance line and the green support zone, which is a bullish development.
Form today’s point of view, we see that the situation developed in tune with our expectations and USD/CAD closed Thursday’s session above the 38.2% Fibonacci retracement. Although currency bulls pushed the exchange rate higher on Friday, the improvement was short-lived and the pair reversed to end the day lower. The earlier breakout of the 38.2% Fibonacci retracement was thus invalidated.
Although this is a bearish development, there are no definitive sell signals generated yet at the moment of writing these words. Combined with the above-mentioned invalidation of the breakdown below the lower border of the yellow consolidation on the weekly chart, the buyers can pin their hopes on one more move to the upside in the very near future.
If they show strength and trigger an upswing, we could see a test of the 50% Fibonacci retracement or even of the previously broken lower border of the green rising trend channel. Nevertheless, the daily indicators’ point of view shows that the space for gains is quite limited and reversal in the coming days should not surprise us.
If the situation develops in tune with our assumptions and currency bulls show weakness in the coming day(s), we’ll consider opening short positions.
Trading position (short-term; our opinion): No positions are justified from the risk/reward perspective. We will keep you – our subscribers – informed should anything change, or should we see a confirmation/invalidation of the above.
AUD/USD
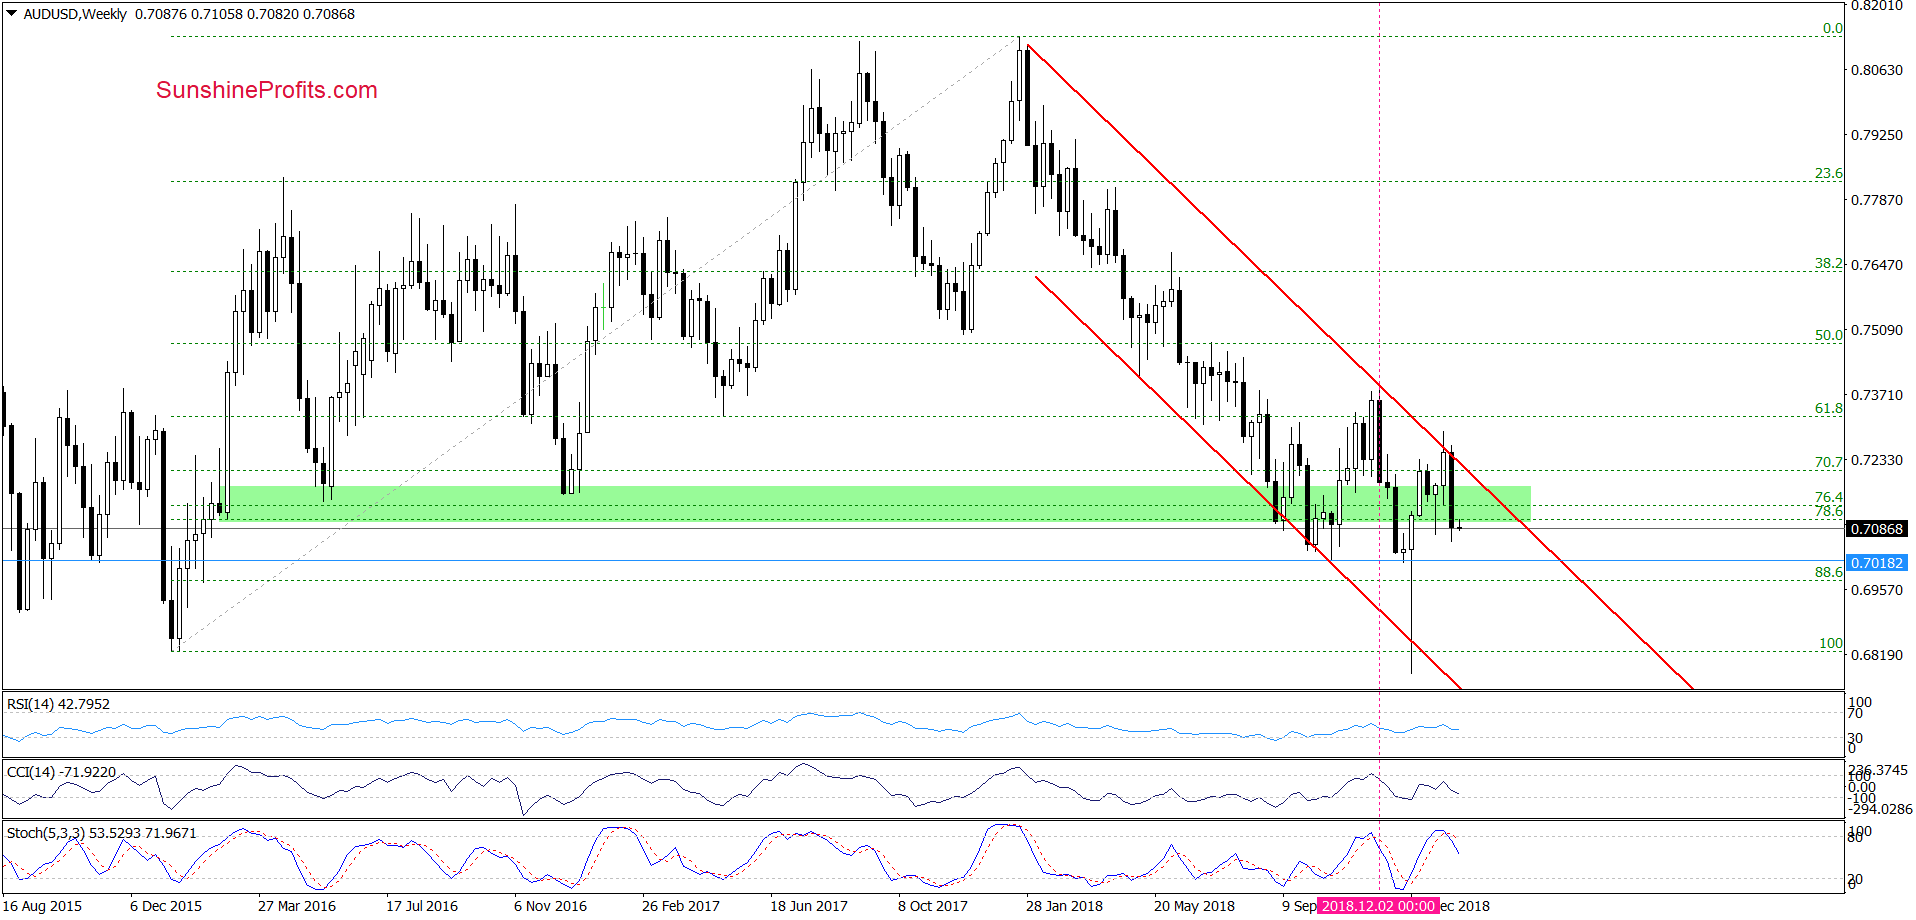
On the weekly chart, we see an invalidation of the tiny breakout above the upper border of the red declining trend channel at the beginning of the previous week. This triggered a sharp move to the downside, which took AUD/USD to finish the week below the green support zone.
Additionally, the Stochastic Oscillator flashed the sell signal, increasing the probability of further deterioration in the coming week. It is worth noting that last time we saw a similar reading of the indicator was at the beginning of December, which translated into a decline to fresh multi-month lows at the end of the month.
Are there any factors that can encourage the buyers to act?
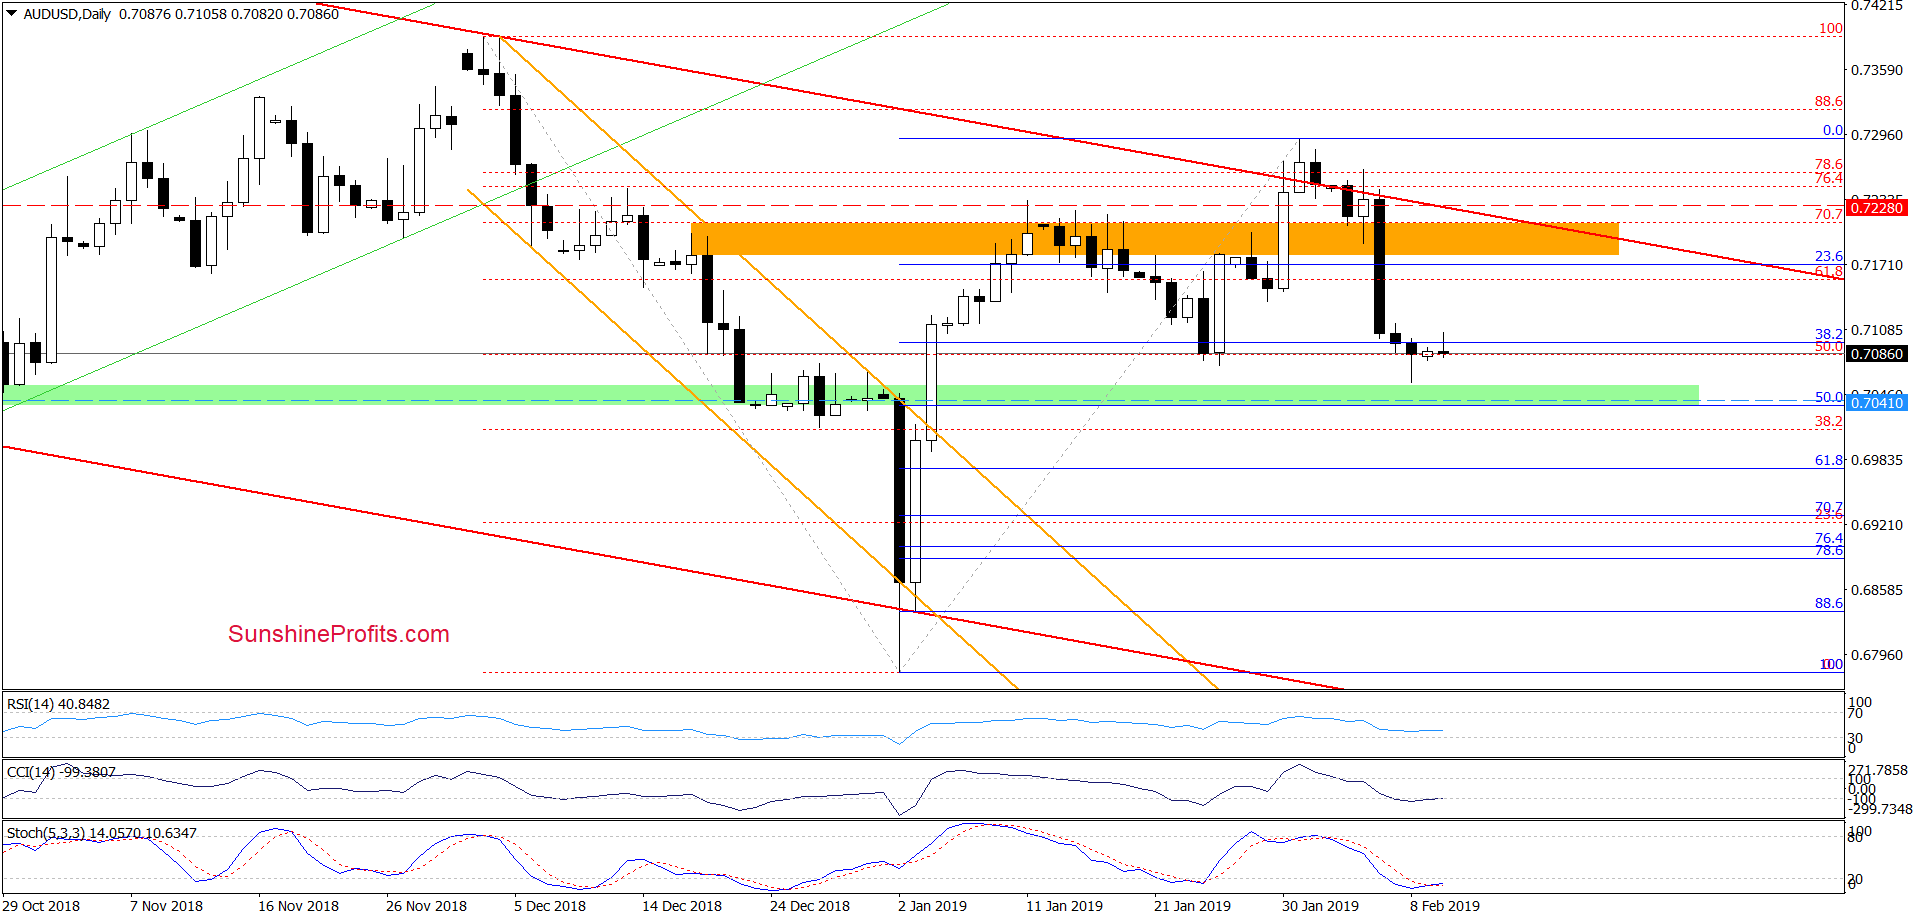
First, let’s recall the quote from our recent commentary (where we took some profits off the table) on this pair:
(…) AUD/USD slipped to our initial downside target earlier today. Taking this fact into account, we decided to close half of our short positions and take profits off the table. The other half of the current positions remains in the cards, but we decided to lower our stop-loss order (similarly to what we one in the case of EUR/USD) to protect our capital. (…)
We see that AUD/USD moved a bit lower during Friday’s session, making our short positions more profitable. Thanks to this downswing, the pair approached the green support zone on the daily chart and our next downside target. Although the exchange rate rebounded before the session’s close, there are no buy signals generated by the daily indicators, which in combination with the weekly picture suggests that another move to the downside is still ahead of us.
If this is the case, and AUD/USD extends losses from here, we could see not only a drop to our downside target, but also a test of the 61.8% Fibonacci retracement later in the week.
Trading position (short-term; our opinion): Half of profitable short positions (with a stop-loss order at our entry level at 0.7228 and the next downside target at 0.7041) are justified from the risk/reward perspective. We will keep you informed should anything change, or should we see a confirmation/invalidation of the above.
Thank you.
Nadia Simmons
Forex & Oil Trading Strategist

