
Briefly: In our opinion no speculative positions are currently justified from the risk/reward perspective.
More precisely, gold managed to close the session higher, which is a sign of strength. Is gold strong enough to continue rallying past the medium-term resistance line? Could it be the case that the final bottom is actually already behind us?
As always, there are no sure bets in the investment business, and at this time our answer to the above questions is “it could be the case, but it’s not likely the case”.
Let’s take a look at what happened last week (charts courtesy of http://stockcharts.com).
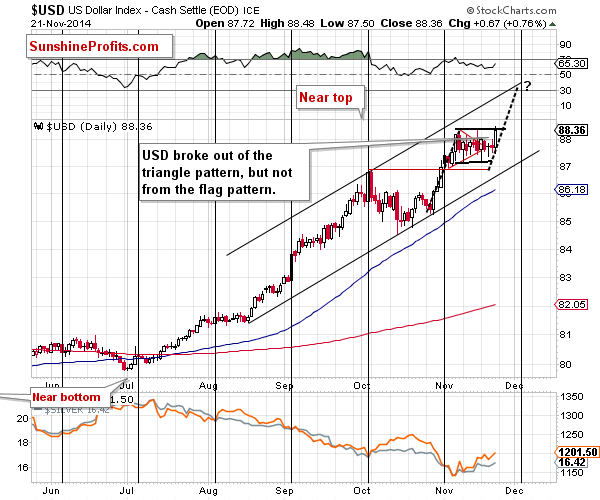
The USD Index moved visibly higher on Friday, breaking out of the triangle pattern. The implications are bullish but not strongly bullish, as the pattern started to resemble more of a flag than a triangle. Since the flag pattern was not broken, many traders probably thought that the situation hadn’t changed. This could explain the lack of response in the precious metals market. If we saw a strong breakout and metals didn’t react, then it would definitely be a sign of strength, but at this time, it could be the case that the market participants are still not viewing the dollar’s move as a something real.
Our previous comments remain up-to-date:
The downside is limited in case of a breakdown, and the upside is visibly higher in case of a breakout. If we see a move similar to the one that preceded the recent consolidation, then we could see a move close to the 89 level that would materialize in the first part of December. This scenario seems quite likely also given the resistance line that would be reached (it would simply “fit”) and the cyclical turning point – we are likely to see at least a local top close to it.
We could see a small move lower before the rally starts, though. This means that the above doesn’t invalidate our previous outlook and price targets for the precious metals sector.
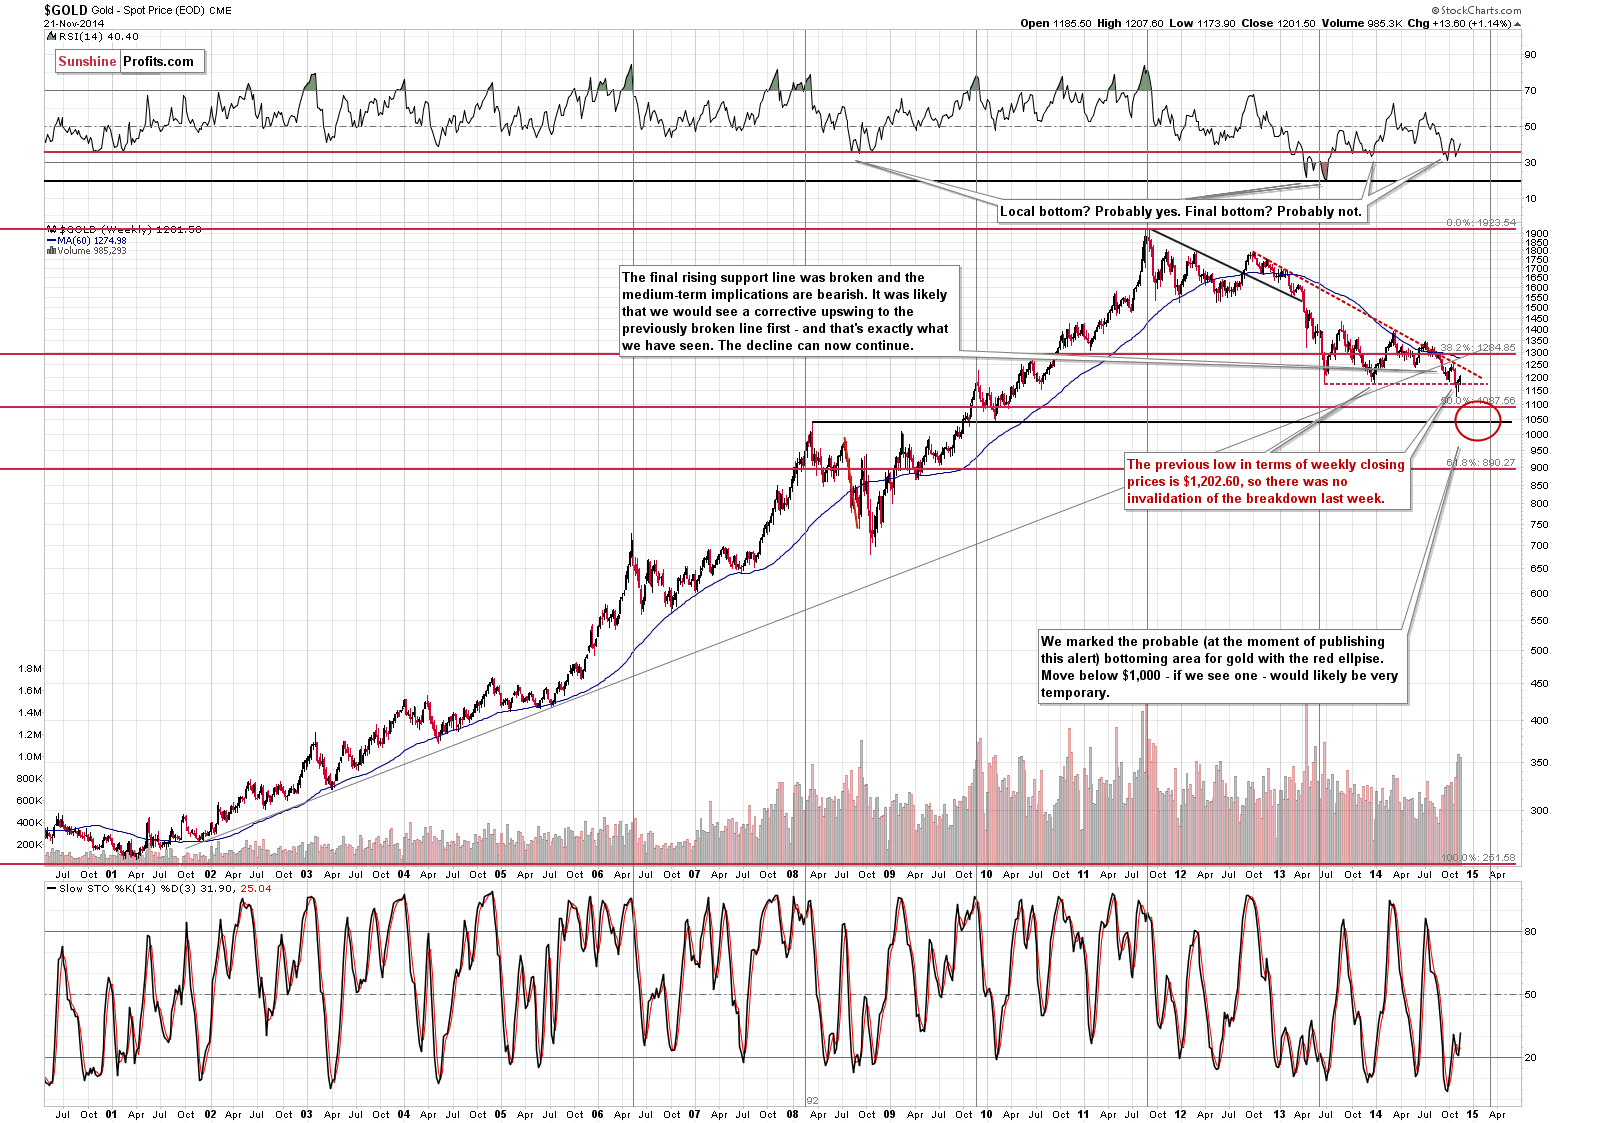
From the long-term perspective, we continue to see that the trend remains down as the declining resistance line was not reached, let alone broken.
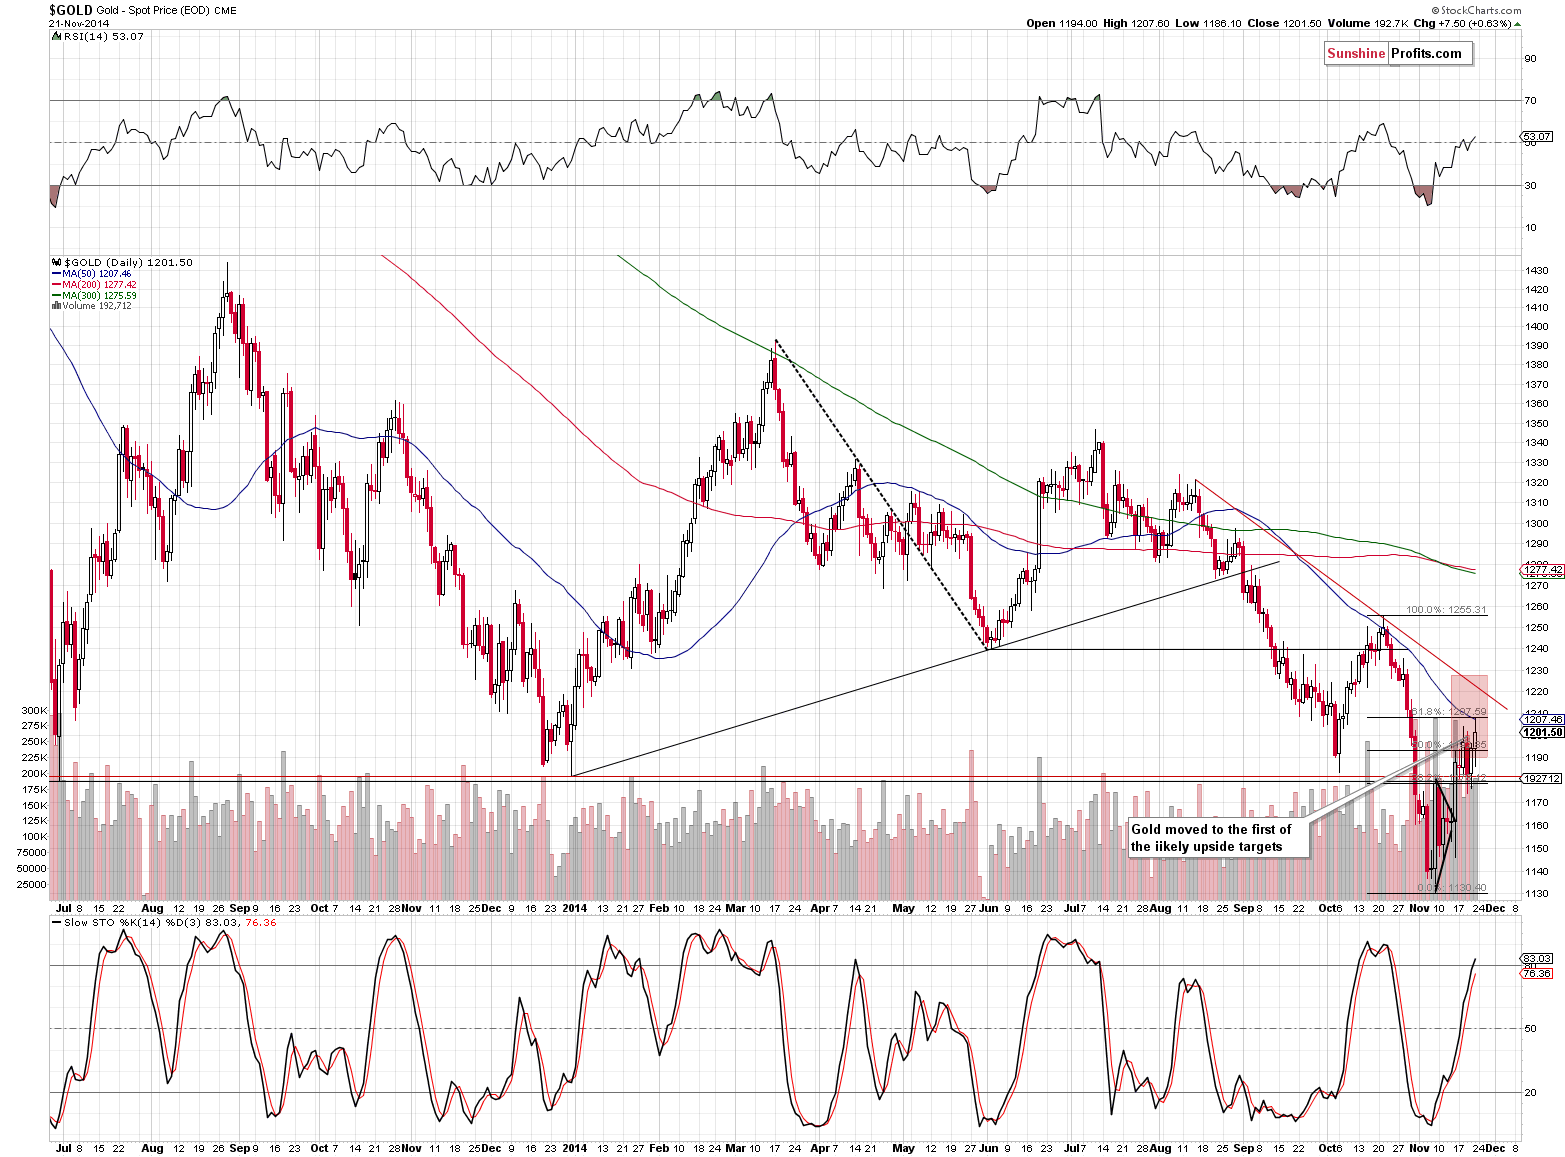
The short-term chart provides more interesting details. Namely, we can see that gold moved to the lower of our upside target levels. This level is created by the 61.8% Fibonacci retracement level and the 50-day moving average. The last time gold touched its 50-day MA, it was one day ahead of the top.
The implications of the above are bearish, but at this time we can’t rule out another $20 or so move higher, which would take gold to the declining resistance line.
Since gold moved higher along with the USD, we could very well see a further upswing (if the USD declines at least a bit), but if the USD breaks above the flag pattern, then gold will likely decline right away.
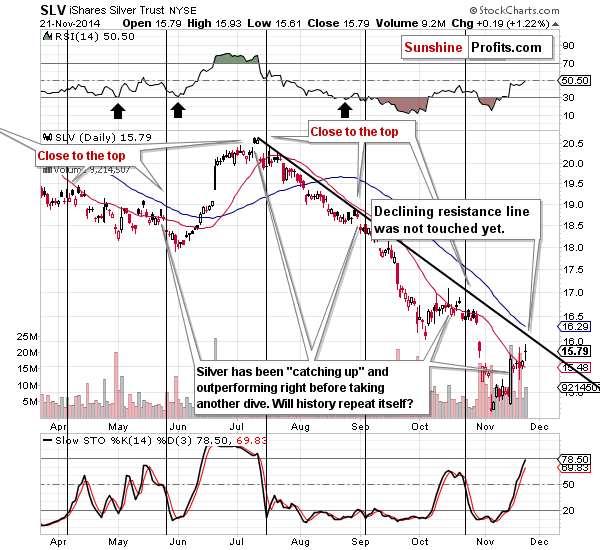
In case of the SLV ETF (proxy for silver), we see a similar picture. There is a sign that the top is in (silver moved to the 20-day moving average and then moved slightly above it, just like in mid-October), but the declining resistance line was not reached. Will silver move much higher? Not necessarily, but whatever move it would make to the upside is likely to be quite sharp if it is the final stage of the rally. For instance, we wouldn’t be too surprised to see a $1 rally in silver followed by a $3 decline in the following weeks.
All in all, the rally in silver seems over or close to being over. This is more precise in terms of time than in terms of price, which means that while the price at which silver will top is difficult to estimate, it seems that we will not have to wait for this top long (perhaps less than a week).
Having said that, let’s take a look at the gold stocks.
Quoting our previous comments on the HUI Index once again seems appropriate:
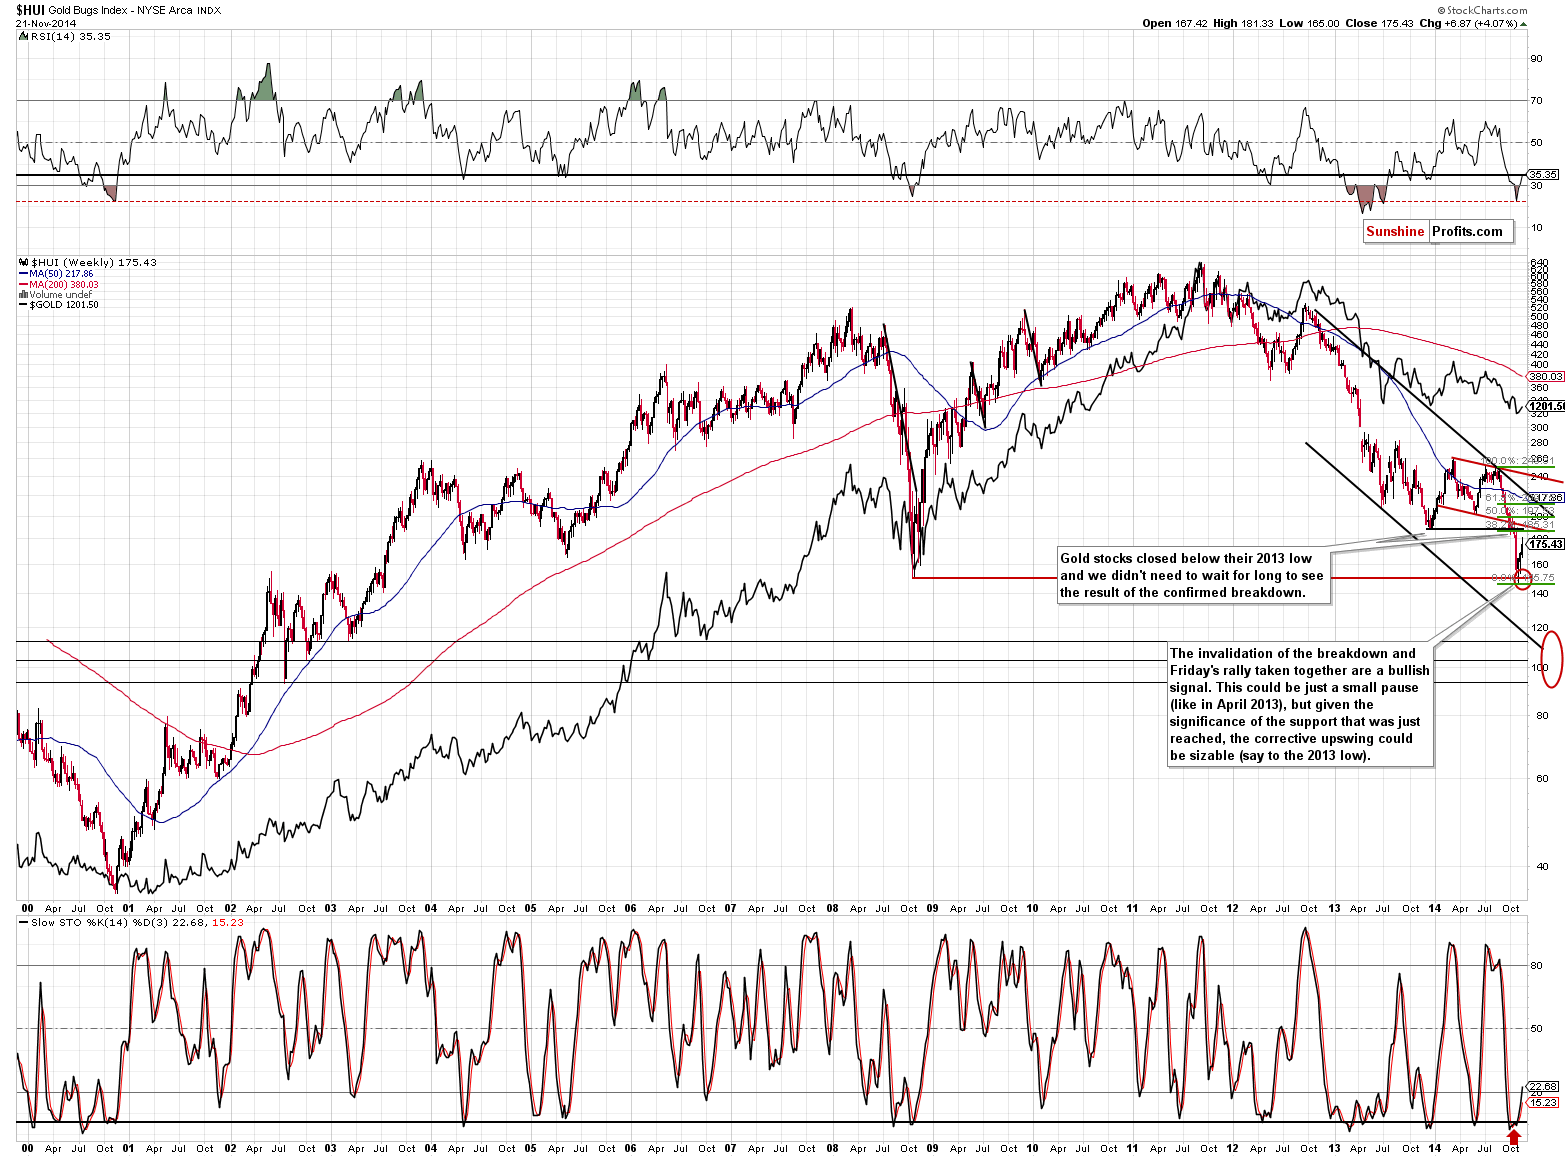
Gold miners have their resistance level relatively high, but since they are ones that have recently dropped particularly significantly, it’s no wonder that the correction is also big.
(…)
Gold stocks moved higher last week after reaching our initial target area but that’s no proof that the decline is completely over. During the 2008 decline there were sharp corrective upswings as well, but they didn’t mean that the decline was over. The current decline has been significant, so a corrective upswing (a pause within the decline) would be something normal.
How high could gold stocks go before the decline is resumed? It’s a tough call as the market has been very volatile lately, but at this time we wouldn’t rule out a move back to the previously broken support at the 2013 low. The 38.2% Fibonacci retracement based on the recent decline is very close to it, so it seems quite likely that the 185-190 level would stop a rally.
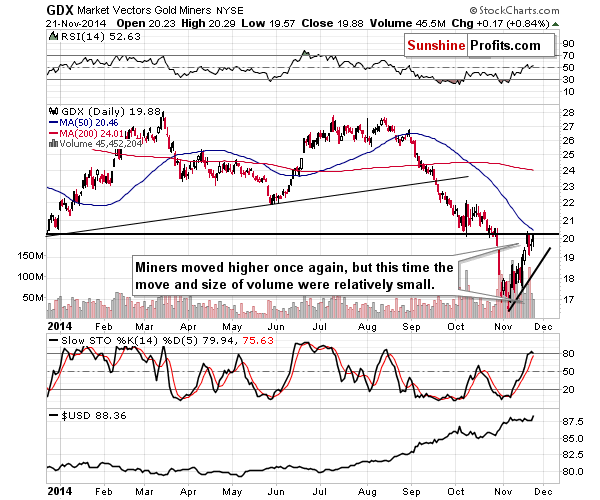
While the above remains up-to-date, the particularly interesting fact is that the GDX ETF is already at its 2013 low, but the XAU and HUI indices are not. The latter are more important than the ETF, so we don’t view the move to the 2013 low as being completed.
However, as you can see on the above chart, the resistance is very close (…). This means that we will probably consider opening short positions shortly. We want to see a confirmation in volume and perhaps an intra-day reversal before we jump back into the short positions, though.
The mining stocks moved higher on Friday, but the move was accompanied by relatively low volume. Consequently, Friday’s session was not bullish in the case of mining stocks, but rather bearish. Again, with this bearish sign (and the GDX ETF at its 2013 low) we could be seeing a local top, or it could be still slightly ahead of us.
What about platinum?
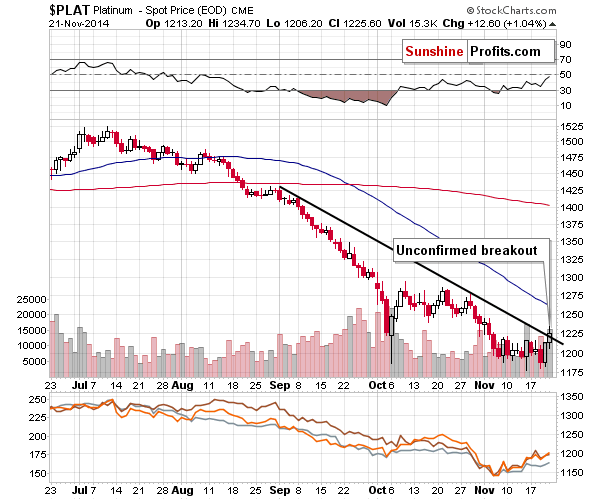
The platinum broke above the declining resistance line, as we commented on in Friday’s alert. We wrote the following:
The platinum market moved higher yesterday, just like gold, but is significant about the above chart and the move itself is that the declining resistance line is particularly clearly visible and platinum is now very close to it. Local tops and bottoms in platinum and the rest of the precious metals market are in tune with each other (bottom in early October, top in mid-October)), so since we likely to see a local top (or a breakout, but that’s not a likely outcome) soon in platinum, then the entire market is likely close to a local top. That’s in tune with our previous outlook, so this scenario is even more likely to materialize.
We saw a breakout, but the continuation of the rally is still not the most likely outcome in our view. We will get a more meaningful bullish signal if this breakout is confirmed, for instance by 2 more consecutive closes above the resistance line. For now, the breakout remains unconfirmed and thus of limited significance.
Summing up, we have some signs that the precious metals market is topping at this time, but without a clearer and more definitive bearish confirmation it seems that opening a speculative short position is not justified from the risk/reward perspective. We are very close to the point when it will be, but we are not at it just yet.
As always, we will continue to monitor the situation and report to you – our subscribers – accordingly. We will aim to multiply the recent profits and will quite likely open another trading position shortly – stay tuned.
On an administrative note, the markets in the U.S. will be closed on Thursday and we expect the trading activities to be limited on Friday as well. Consequently, we there will be no Gold & Silver Trading Alerts on Thursday and Friday. The alerts will be posted until Wednesday and will then be posted normally beginning on Monday, Dec 1.
To summarize:
Trading capital (our opinion): No positions
Long-term capital (our opinion): No positions
Insurance capital (our opinion): Full position
Please note that a full position doesn’t mean using all of the capital for a given trade. You will find details on our thoughts on gold portfolio structuring in the Key Insights section on our website.
As a reminder – “initial target price” means exactly that – an “initial” one, it’s not a price level at which we suggest closing positions. If this becomes the case (like it did in the previous trade) we will refer to these levels as levels of exit orders (exactly as we’ve done previously). Stop-loss levels, however, are naturally not “initial”, but something that, in our opinion, might be entered as an order.
Our preferred ways to invest in and to trade gold along with the reasoning can be found in the how to buy gold section. Additionally, our preferred ETFs and ETNs can be found in our Gold & Silver ETF Ranking.
As always, we'll keep you - our subscribers - updated should our views on the market change. We will continue to send out Gold & Silver Trading Alerts on each trading day and we will send additional Alerts whenever appropriate.
The trading position presented above is the netted version of positions based on subjective signals (opinion) from your Editor, and the automated tools (SP Indicators and the upcoming self-similarity-based tool).
As a reminder, Gold & Silver Trading Alerts are posted before or on each trading day (we usually post them before the opening bell, but we don't promise doing that each day). If there's anything urgent, we will send you an additional small alert before posting the main one.
=====
Latest Free Trading Alerts:
S&P 500 breached the level of 2,070, as it continued its bull-run. Is holding short position still justified?
Stock Trading Alert: Indexes Made New Highs – Will Uptrend Extend Even Further?
We saw a significant move down yesterday. The move brought Bitcoin down to $350. The volume was up and so the depreciation seemed quite important. Was it?
Bitcoin Trading Alert: Is a Move below $350 Underway?
=====
Hand-picked precious-metals-related links:
The Dutch do what the Germans couldn't: Get their gold back
The Real Reason Why The Netherlands Repatriated Its Gold
Gold Wagers Gain as China Rate Reduction Stems Rout
Gold Speculators sharply raised net bullish positions last week as Gold gains
Silver Mine Supply To Peak 2-3 Years & Drawdown Of LBMA Inventory – GFMS
Gold premiums fall in absence of fresh import curbs
=====
In other news:
Global stocks grind higher after central bank stimulus signals
Draghi Urgency for ECB Action Gets Final Reality Check: Economy
Falling inflation a worry for Europe but also the world
China rate cut no magic bullet for economy
Why Countries Wage Currency Wars
=====
Thank you.
Sincerely,
Przemyslaw Radomski, CFA
Founder, Editor-in-chief
Gold & Silver Trading Alerts
Forex Trading Alerts
Oil Investment Updates
Oil Trading Alerts

